Arlington: Fire Incidents, Texas (TX)
Where are fire incidents reported in Arlington, TX
Something went wrong! Please refresh the page.
| Fire incidents reported | |
|---|---|
| Sreet name | Count |
| COOPER ST | 794 |
| COLLINS ST | 604 |
| PARK ROW DR | 520 |
| DIVISION ST | 436 |
| ARKANSAS LN | 370 |
| RANDOL MILL RD | 330 |
| ABRAM ST | 294 |
| SH 360 FWY | 282 |
| I20 FWY | 260 |
| WATSON RD | 258 |
| GREEN OAKS BLV | 208 |
| COWBOYS WAY | 200 |
| I20 HWY | 196 |
| CENTER ST | 190 |
| FIELDER RD | 190 |
| PIONEER PW | 182 |
| PIONEER PKY | 176 |
| MATLOCK RD | 170 |
| I20 FW | 158 |
| OAK ST | 132 |
| INTERSTATE 20 FWY | 130 |
| BALLPARK WAY | 128 |
| SANFORD ST | 126 |
| SHERRY ST | 124 |
| LAMAR BL | 118 |
| SUBLETT RD | 114 |
| MAYFIELD RD | 112 |
| PIONEER PWY | 108 |
| MITCHELL ST | 106 |
| I30 FWY | 104 |
| Other | 6,294 |
2005 - 2018 National Fire Incident Reporting System (NFIRS) incidents
- Incident types reported to NFIRS in Arlington, TX
- 83,13942.5%Rescue & EMS
- 54,13827.7%Good Intent Call
- 18,0079.2%Hazardous Condition
- 16,4228.4%Service Call
- 13,4146.9%Fire
- 10,3715.3%False Alarm
- Fire incident types reported to NFIRS in Arlington, TX
- 5,55241.4%Outside Fires
- 4,84636.1%Structure Fires
- 2,64019.7%Mobile Property/Vehicle Fires
- 3762.8%Other
 According to the data from the years 2005 - 2018 the average number of fires per year is 956. The highest number of reported fire incidents - 1,449 took place in 2006, and the least - 512 in 2005. The data has a growing trend.
The average number of yearly fire incidents per 10k residents in Arlington, TX compared to nearest cities:
(Note: Based on data for the last 3 years, including only cities with population 5,000 and above)
| Arlington: | 23.6 |
| Grand Prairie: | 27.7 |
| Kennedale: | 64.9 |
| Mansfield: | 22.7 |
| Forest Hill: | 53.9 |
| Richland Hills: | 17.8 |
| Hurst: | 28.8 |
| Bedford: | 29.2 |
| Euless: | 29.7 |
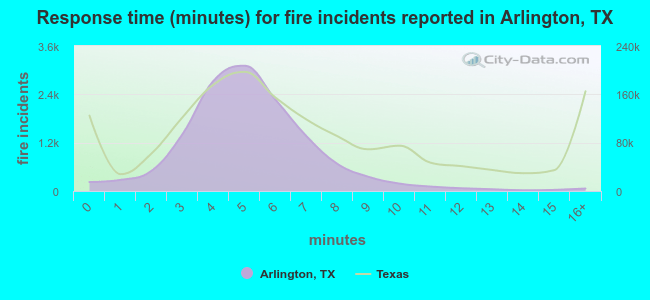 The median response time based on all reported fire incidents is 5 minutes. This is lower than the state median value.
The median response time in Arlington, TX compared to nearest cities:
(Note: Based on data for all years, including only cities with at least 500 fire incidents)
| Arlington: | 5 minutes |
| Grand Prairie: | 7 minutes |
| Kennedale: | 4 minutes |
| Mansfield: | 6 minutes |
| Forest Hill: | 5 minutes |
| Richland Hills: | 5 minutes |
| Hurst: | 5 minutes |
| Bedford: | 4 minutes |
| Euless: | 5 minutes |
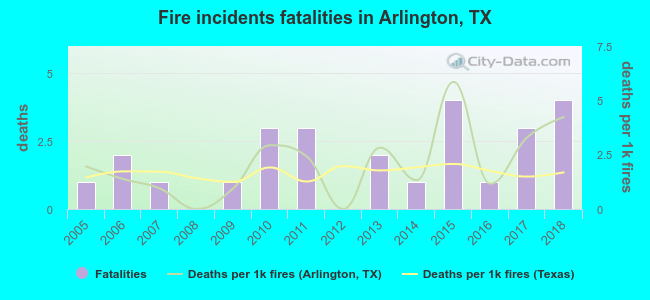 According to the reports from the years 2005 - 2018 the average number of fire-related fatalities per year is 2. The highest number of deaths - 4 took place in 2015, and the lowest - 0 in 2008. The data has a growing trend.
The average number of deaths per 1,000 fire incidents is 2. This indicator was the highest - 6 in 2015, and the lowest 0 in 2008. The trend for deaths per 1,000 incidents is increasing. Compared to the Texas value the number of fatalities per 1,000 incidents is about the same.
According to the reports from the years 2005 - 2018 the average number of fire-related fatalities per year is 2. The highest number of deaths - 4 took place in 2015, and the lowest - 0 in 2008. The data has a growing trend.
The average number of deaths per 1,000 fire incidents is 2. This indicator was the highest - 6 in 2015, and the lowest 0 in 2008. The trend for deaths per 1,000 incidents is increasing. Compared to the Texas value the number of fatalities per 1,000 incidents is about the same.Deaths per 1,000 incidents in Arlington, TX compared to nearest cities:
(Note: Based on data for all years, including only cities with at least 2,500 fire incidents)
| Arlington: | 1.9 |
| Grand Prairie: | 3.9 |
| Mansfield: | 0.7 |
| Bedford: | 1.5 |
| Euless: | 1.3 |
| Haltom City: | 1.4 |
| Fort Worth: | 1.9 |
| Duncanville: | 0.8 |
| Cedar Hill: | 1.3 |
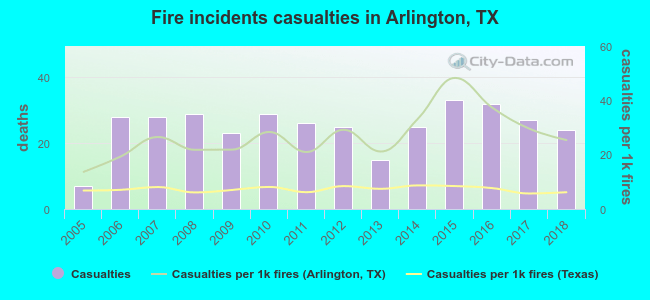 Based on the reports from the years 2005 - 2018 the average number of fire-related yearly casualties is 25. The highest number of injuries - 33 took place in 2015, and the lowest - 7 in 2005. The data has an increasing trend.
The average number of casualties per 1,000 fire incidents is 27. This indicator was the highest - 48 in 2015, and the lowest 14 in 2005. The trend for injuries per 1,000 fires is growing. Compared to the Texas value the number of injuries per 1,000 incidents is much higher.
Based on the reports from the years 2005 - 2018 the average number of fire-related yearly casualties is 25. The highest number of injuries - 33 took place in 2015, and the lowest - 7 in 2005. The data has an increasing trend.
The average number of casualties per 1,000 fire incidents is 27. This indicator was the highest - 48 in 2015, and the lowest 14 in 2005. The trend for injuries per 1,000 fires is growing. Compared to the Texas value the number of injuries per 1,000 incidents is much higher.Casualties per 1,000 incidents in Arlington, TX compared to nearest cities:
(Note: Based on data for all years, including only cities with at least 500 fire incidents)
| Arlington: | 26.2 |
| Grand Prairie: | 20.4 |
| Kennedale: | 12.2 |
| Mansfield: | 18.9 |
| Forest Hill: | 9.5 |
| Richland Hills: | 9.8 |
| Hurst: | 8.2 |
| Bedford: | 30.9 |
| Euless: | 35.9 |
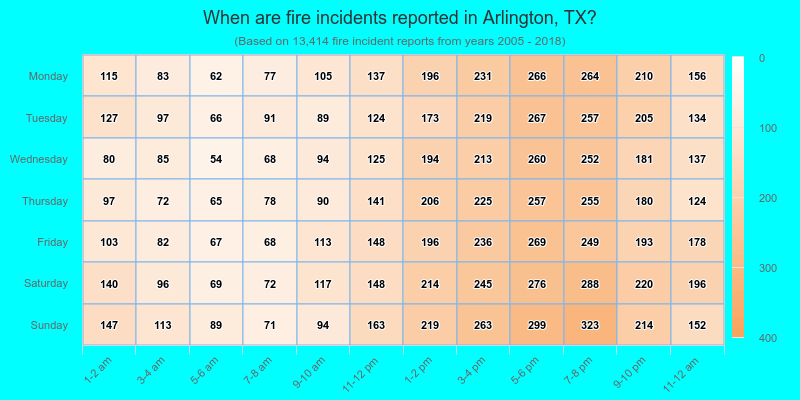
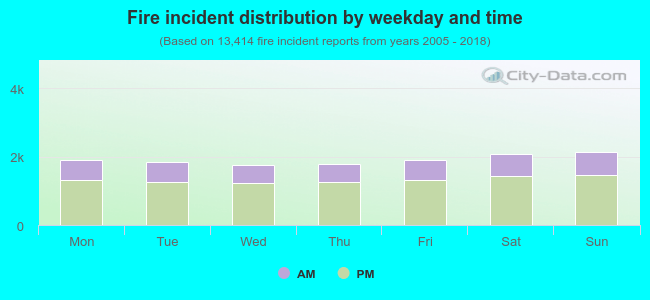 30.7% incidents where reported in the morning and 69.3% in the evening. The most fires (16.0%) took place on Sunday, and the least (13.0%) on Wednesday.
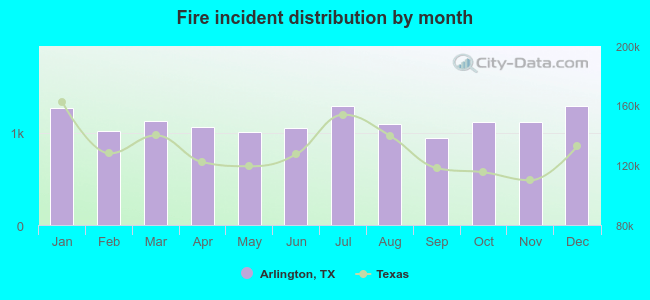 Based on the 13,414 incident reports from years 2005 - 2018 most fires (9.6%) took place during December, and the least (7.0%) in September.
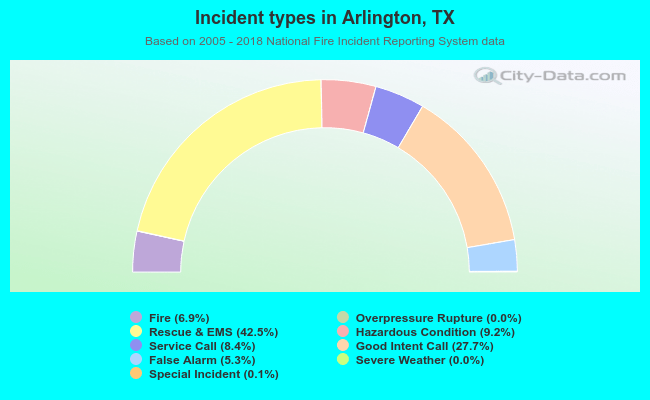 Out of all 195,747 cases reported during the years 2005 - 2018, the most belonged to the categories: Rescue & EMS (42.5%), Good Intent Call (27.7%), and Hazardous Condition (9.2%).
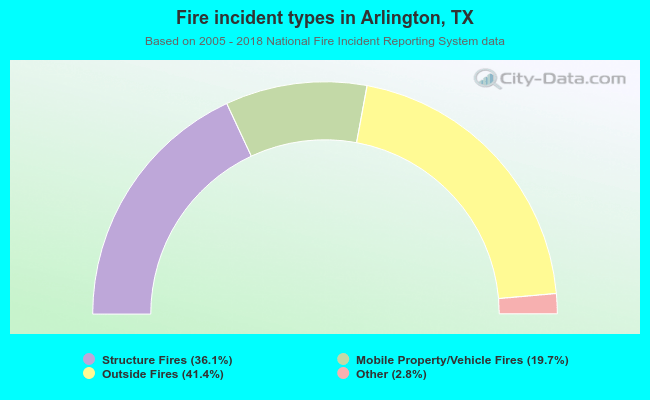 When looking into fire subcategories, the most incidents belonged to: Outside Fires (41.4%), and Structure Fires (36.1%).