Clarkston: Fire Incidents, Washington (WA)
Where are fire incidents reported in Clarkston, WA
Something went wrong! Please refresh the page.
|
| |||||||||||||||||||||||||||||||||||||||||||||||||||||||||||||||||||||||||||||||||||||||||||||||||||||||||||||
| Other | 1 | |||||||||||||||||||||||||||||||||||||||||||||||||||||||||||||||||||||||||||||||||||||||||||||||||||||||||||||
2002 - 2018 National Fire Incident Reporting System (NFIRS) incidents
- Incident types reported to NFIRS in Clarkston, WA
- 1,33943.6%Fire
- 72923.7%Hazardous Condition
- 3009.8%Good Intent Call
- 2879.3%Rescue & EMS
- 2387.7%False Alarm
- 1735.6%Service Call
- Fire incident types reported to NFIRS in Clarkston, WA
- 73354.7%Outside Fires
- 42031.4%Structure Fires
- 14811.1%Mobile Property/Vehicle Fires
- 382.8%Other
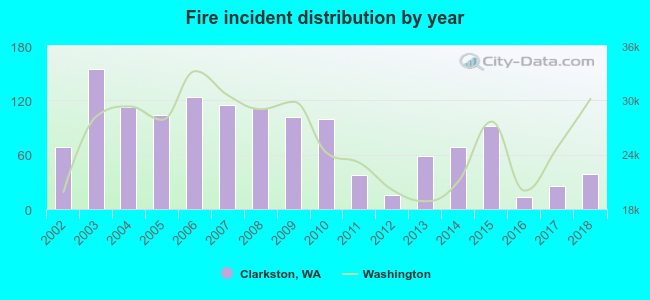 According to the data from the years 2002 - 2018 the average number of fire incidents per year is 79. The highest number of fire incidents - 155 took place in 2003, and the least - 13 in 2016. The data has a declining trend.
The average number of yearly fire incidents per 10k residents in Clarkston, WA compared to nearest cities:
(Note: Based on data for the last 3 years, including only cities with population 5,000 and above)
| Clarkston: | 34.9 |
| Pullman: | 24.1 |
| Walla Walla: | 26.3 |
| College Place: | 13.0 |
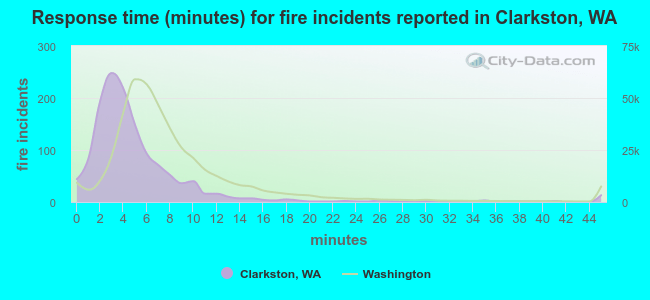 The median response time based on all reported fire incidents is 4 minutes. This is lower than the state median value.
The median response time in Clarkston, WA compared to nearest cities:
(Note: Based on data for all years, including only cities with at least 500 fire incidents)
| Clarkston: | 4 minutes |
| Lewiston: | 4 minutes |
| Moscow: | 5 minutes |
| Pullman: | 6 minutes |
| Kamiah: | 9 minutes |
| Walla Walla: | 4 minutes |
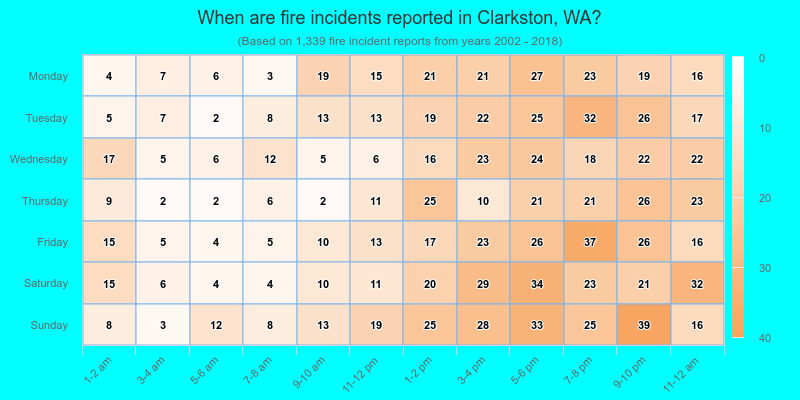
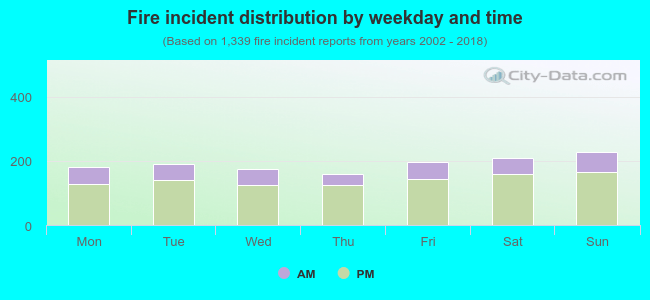 26.1% incidents where reported in the morning and 73.9% in the evening. The most fires (17.1%) took place on Sunday, and the least (11.8%) on Thursday.
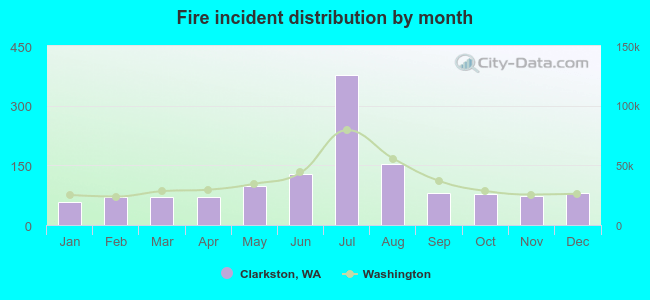 Based on the 1,339 fire incident reports from years 2002 - 2018 most fires (28.1%) took place during July, and the least (4.3%) in January.
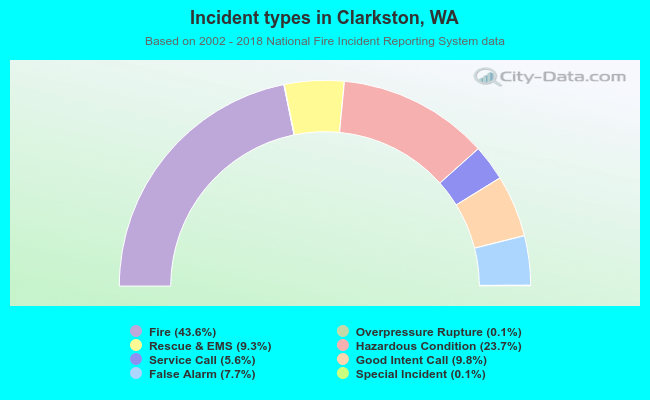 Out of all 3,071 cases reported during the years 2002 - 2018, the most belonged to the categories: Fire (43.6%), Hazardous Condition (23.7%), and Good Intent Call (9.8%).
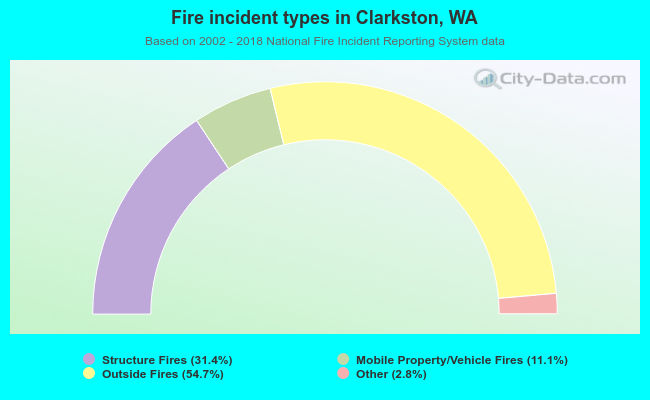 When looking into fire subcategories, the most reports belonged to: Outside Fires (54.7%), and Structure Fires (31.4%).