College Place: Fire Incidents, Washington (WA)
Where are fire incidents reported in College Place, WA
Something went wrong! Please refresh the page.
|
| |||||||||||||||||||||||||||||||||||||||||||||||||||||||||||||||||||||||||||||||||||||||||||||||||||||||||||||
2002 - 2018 National Fire Incident Reporting System (NFIRS) incidents
- Incident types reported to NFIRS in College Place, WA
- 1,99561.7%Rescue & EMS
- 37211.5%Fire
- 2427.5%Service Call
- 2407.4%Hazardous Condition
- 2216.8%False Alarm
- 1494.6%Good Intent Call
- 70.2%Severe Weather
- 60.2%Special Incident
- Fire incident types reported to NFIRS in College Place, WA
- 15842.5%Structure Fires
- 14037.6%Outside Fires
- 5414.5%Mobile Property/Vehicle Fires
- 205.4%Other
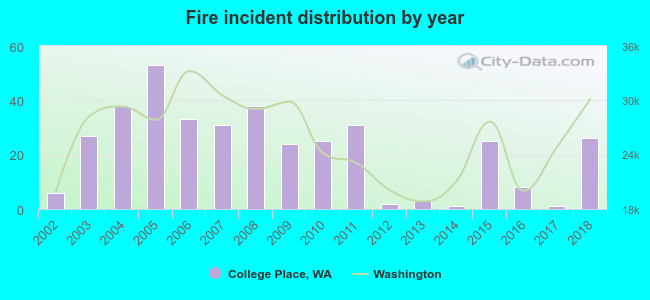 Based on the data from the years 2002 - 2018 the average number of fires per year is 22. The highest number of fire incidents - 53 took place in 2005, and the least - 1 in 2014. The data has an increasing trend.
The average number of yearly fire incidents per 10k residents in College Place, WA compared to nearest cities:
(Note: Based on data for the last 3 years, including only cities with population 5,000 and above)
| College Place: | 13.0 |
| Walla Walla: | 26.3 |
| Finley: | 8.3 |
| Pasco: | 47.5 |
| Kennewick: | 54.0 |
| Richland: | 34.6 |
| Connell: | 17.9 |
| West Richland: | 39.9 |
| Othello: | 54.1 |
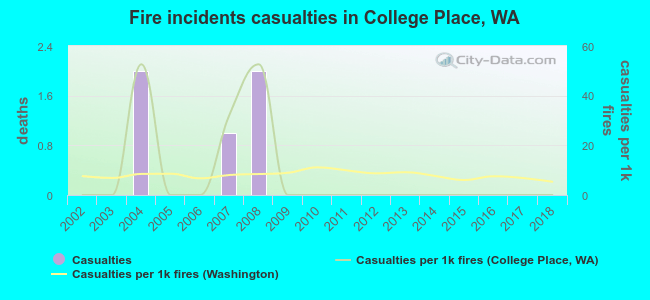 According to the data from the years 2002 - 2018 the average number of fire-related yearly casualties is 0. The highest number of reported casualties - 2 took place in 2004, and the lowest - 0 in 2002. The data has a constant trend.
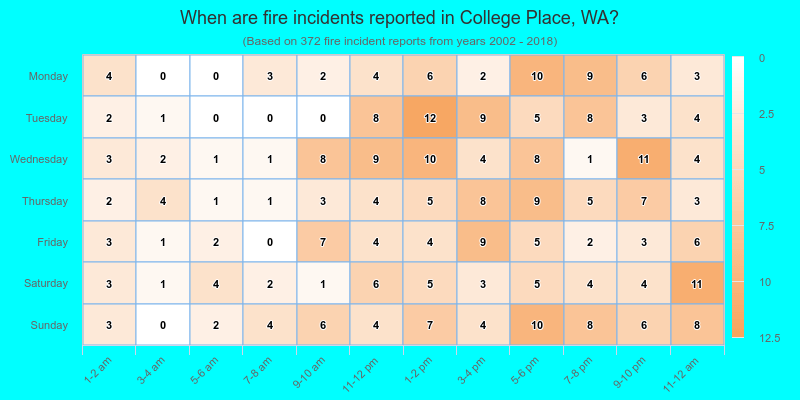
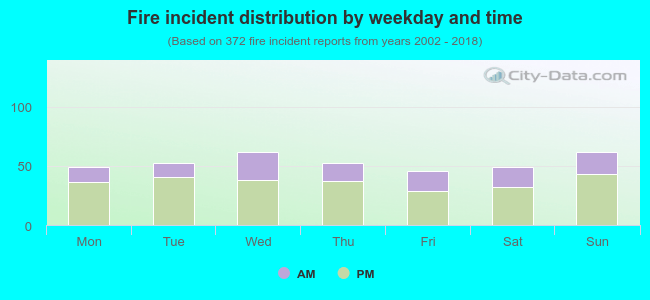 31.2% incidents where reported in the morning and 68.8% in the evening. The most fires (16.7%) took place on Wednesday, and the least (12.4%) on Friday.
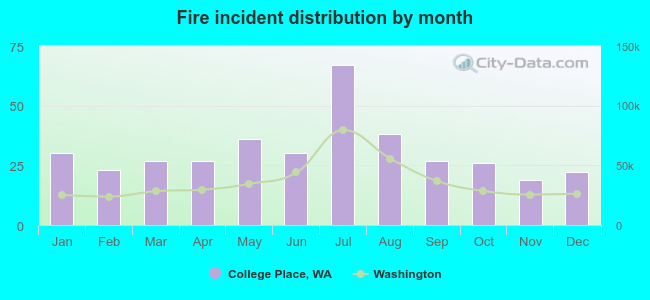 According to the 372 incident reports from years 2002 - 2018 most fires (18.0%) took place during July, and the least (5.1%) in November.
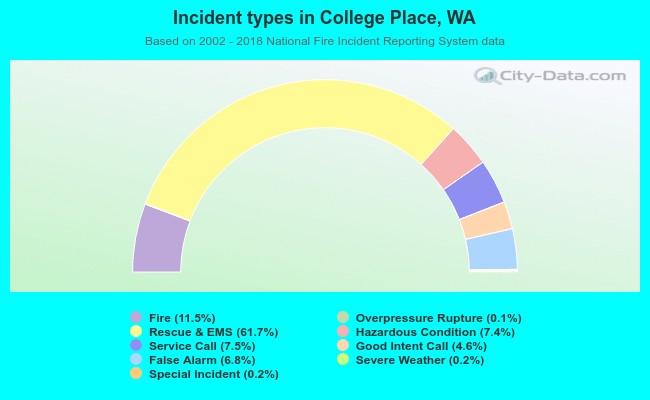 Out of all 3,234 cases reported during the years 2002 - 2018, the most belonged to the categories: Rescue & EMS (61.7%), Fire (11.5%), and Service Call (7.5%).
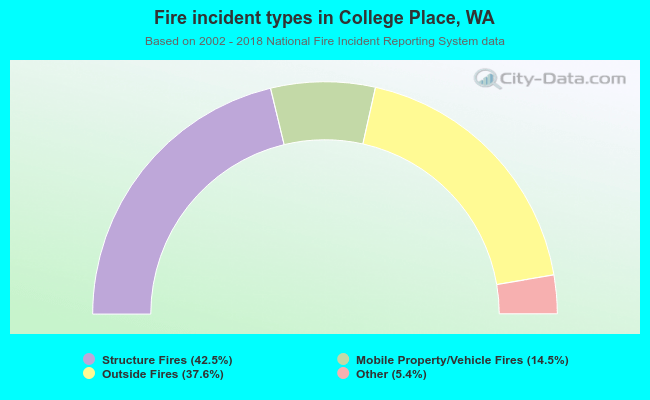 When looking into fire subcategories, the most reports belonged to: Structure Fires (42.5%), and Outside Fires (37.6%).