Moscow: Fire Incidents, Idaho (ID)
Where are fire incidents reported in Moscow, ID
Something went wrong! Please refresh the page.
| Fire incidents reported | |
|---|---|
| Sreet name | Count |
| MAIN ST | 138 |
| PARADISE CREEK ST | 134 |
| A ST | 88 |
| 6TH ST | 86 |
| HWY 95 | 74 |
| ELM ST | 62 |
| ALMON ST | 60 |
| ROBINSON PARK RD | 56 |
| HWY 8 | 52 |
| PULLMAN RD | 50 |
| PALOUSE RIVER DR | 46 |
| LENVILLE RD | 36 |
| TAYLOR AVE | 36 |
| BLAINE | 34 |
| BLAKE AVE | 34 |
| EID RD | 34 |
| MOUNTAIN VIEW | 32 |
| D ST | 30 |
| DEAKIN AVE | 30 |
| 3RD ST | 28 |
| SAMARITAN LN | 28 |
| POLK | 26 |
| IDAHO | 24 |
| OLD PULLMAN HWY | 24 |
| WASHINGTON | 24 |
| 5TH ST | 22 |
| C ST | 22 |
| LILLEY | 22 |
| NEZ PERCE DR | 22 |
| 95 HWY | 20 |
| Other | 61 |
2002 - 2018 National Fire Incident Reporting System (NFIRS) incidents
- Incident types reported to NFIRS in Moscow, ID
- 4,98952.3%Rescue & EMS
- 1,43515.1%Fire
- 1,09111.4%Hazardous Condition
- 1,09011.4%False Alarm
- 5645.9%Good Intent Call
- 3273.4%Service Call
- 150.2%Overpressure Rupture
- 130.1%Severe Weather
- Fire incident types reported to NFIRS in Moscow, ID
- 64544.9%Structure Fires
- 54738.1%Outside Fires
- 14710.2%Mobile Property/Vehicle Fires
- 966.7%Other
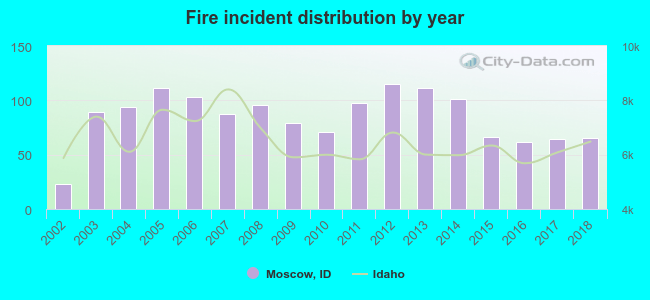 Based on the data from the years 2002 - 2018 the average number of fires per year is 84. The highest number of fire incidents - 115 took place in 2012, and the least - 23 in 2002. The data has an increasing trend.
The average number of yearly fire incidents per 10k residents in Moscow, ID compared to nearest cities:
(Note: Based on data for the last 3 years, including only cities with population 5,000 and above)
| Moscow: | 25.7 |
| Lewiston: | 36.1 |
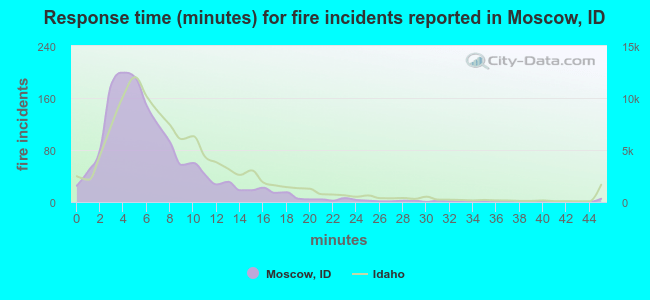 The median response time based on all reported fire incidents is 5 minutes. This is lower than the Idaho median value.
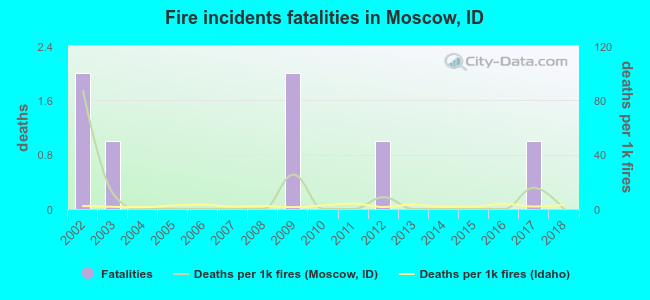 Based on the reports from the years 2002 - 2018 the average number of fire-related yearly deaths is 0. The highest number of reported deaths - 2 took place in 2002, and the lowest - 0 in 2004. The data has a declining trend.
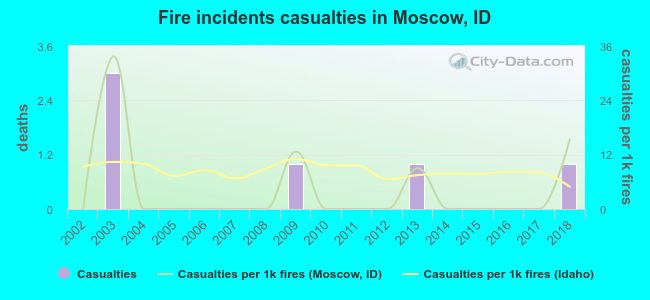 Based on the reports from the years 2002 - 2018 the average number of fire-related yearly casualties is 0. The highest number of injuries - 3 took place in 2003, and the lowest - 0 in 2002. The data has a growing trend.
The average number of injuries per 1,000 fires is 4. This indicator was the highest - 34 in 2003, and the lowest 0 in 2002. The trend for casualties per 1,000 fires is rising. Compared to the state value the number of injuries per 1,000 fires is lower.
Based on the reports from the years 2002 - 2018 the average number of fire-related yearly casualties is 0. The highest number of injuries - 3 took place in 2003, and the lowest - 0 in 2002. The data has a growing trend.
The average number of injuries per 1,000 fires is 4. This indicator was the highest - 34 in 2003, and the lowest 0 in 2002. The trend for casualties per 1,000 fires is rising. Compared to the state value the number of injuries per 1,000 fires is lower.
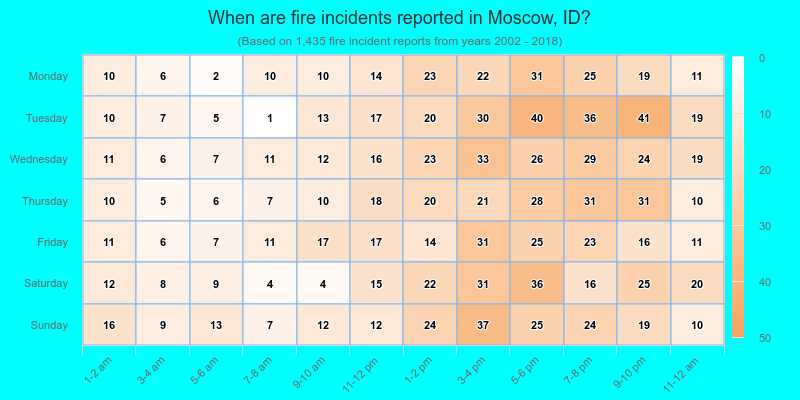
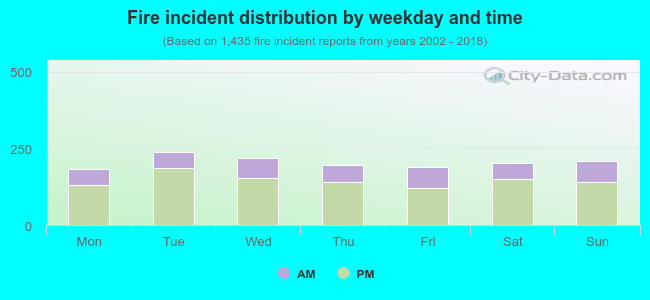 28.9% incidents where reported in the morning and 71.1% in the evening. The most fires (16.7%) took place on Tuesday, and the least (12.8%) on Monday.
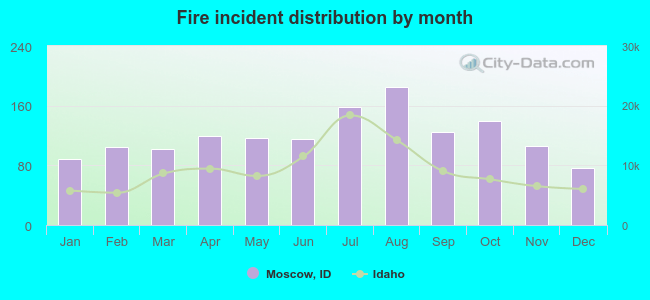 According to the 1,435 fire incidents from years 2002 - 2018 most fires (12.9%) took place during August, and the least (5.3%) in December.
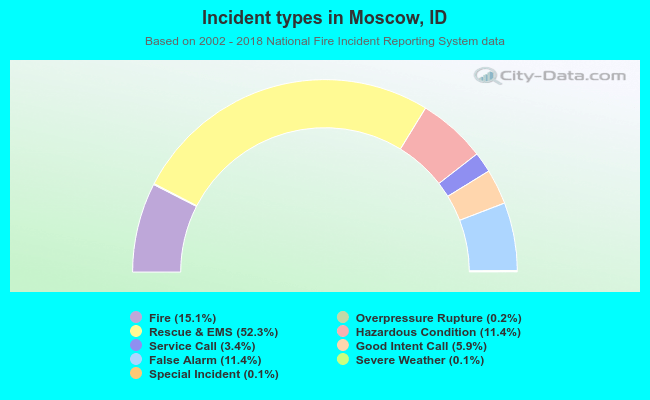 Out of all 9,533 cases reported during the years 2002 - 2018, the most belonged to the categories: Rescue & EMS (52.3%), Fire (15.1%), and Hazardous Condition (11.4%).
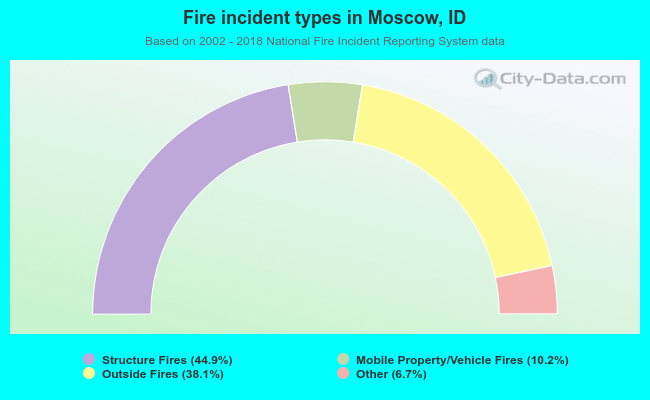 When looking into fire subcategories, the most incidents belonged to: Structure Fires (44.9%), and Outside Fires (38.1%).