Anna: Fire Incidents, Illinois (IL)
Where are fire incidents reported in Anna, IL
Something went wrong! Please refresh the page.
|
| |||||||||||||||||||||||||||||||||||||||||||||||||||||||||||||||||||||||||||||||||||||||||||||||||||||||||||||
| Other | 177 | |||||||||||||||||||||||||||||||||||||||||||||||||||||||||||||||||||||||||||||||||||||||||||||||||||||||||||||
2003 - 2018 National Fire Incident Reporting System (NFIRS) incidents
- Incident types reported to NFIRS in Anna, IL
- 55349.8%Fire
- 15614.1%Service Call
- 1089.7%Hazardous Condition
- 1009.0%False Alarm
- 807.2%Good Intent Call
- 484.3%Rescue & EMS
- 393.5%Severe Weather
- 242.2%Special Incident
- 20.2%Overpressure Rupture
- Fire incident types reported to NFIRS in Anna, IL
- 28651.7%Structure Fires
- 13424.2%Outside Fires
- 11120.1%Mobile Property/Vehicle Fires
- 224.0%Other
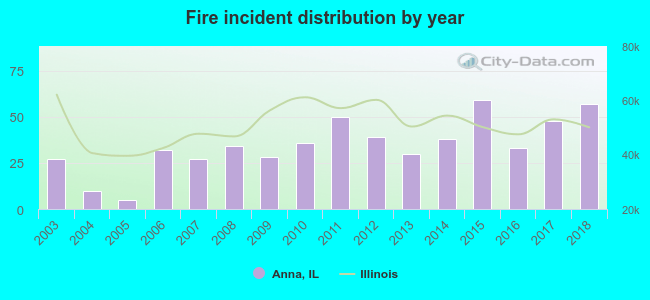 According to the data from the years 2003 - 2018 the average number of fire incidents per year is 35. The highest number of reported fire incidents - 59 took place in 2015, and the least - 5 in 2005. The data has an increasing trend.
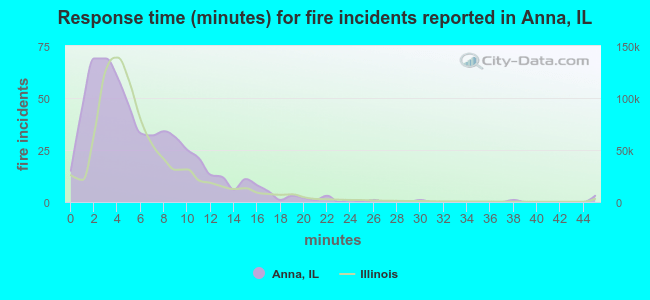 The median response time based on all reported fire incidents is 5 minutes. This is comparable to the Illinois median value.
The median response time in Anna, IL compared to nearest cities:
(Note: Based on data for all years, including only cities with at least 500 fire incidents)
| Anna: | 5 minutes |
| Carbondale: | 4 minutes |
| Murphysboro: | 5 minutes |
| Carterville: | 6 minutes |
| Marion: | 5 minutes |
| Herrin: | 4 minutes |
| Johnston City: | 6 minutes |
| Cairo: | 3 minutes |
| Mitchell: | 5 minutes |
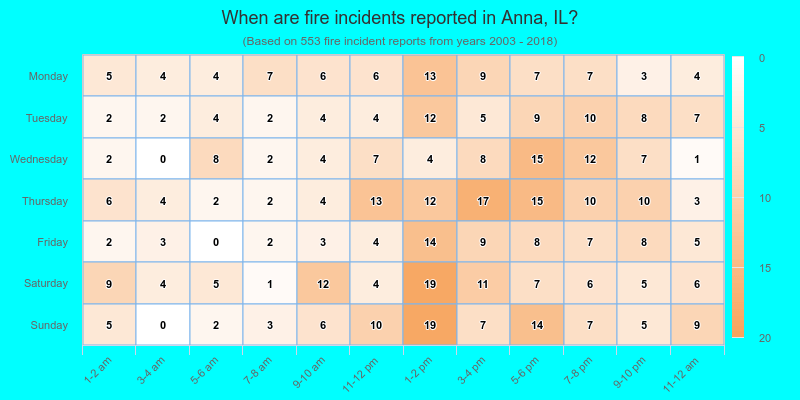
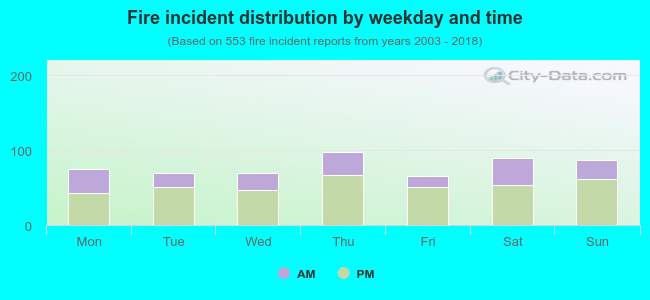 32.4% incidents where reported in the morning and 67.6% in the evening. The most fires (17.7%) took place on Thursday, and the least (11.8%) on Friday.
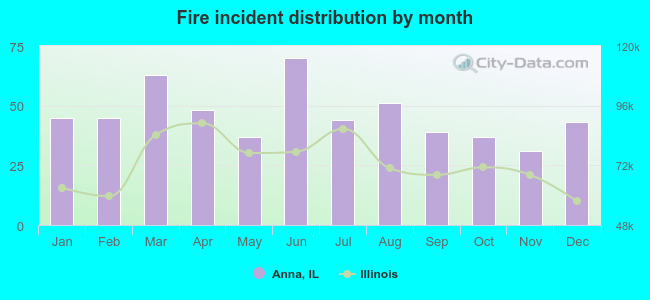 Based on the 553 fire incidents from years 2003 - 2018 most fires (12.7%) took place during June, and the least (5.6%) in November.
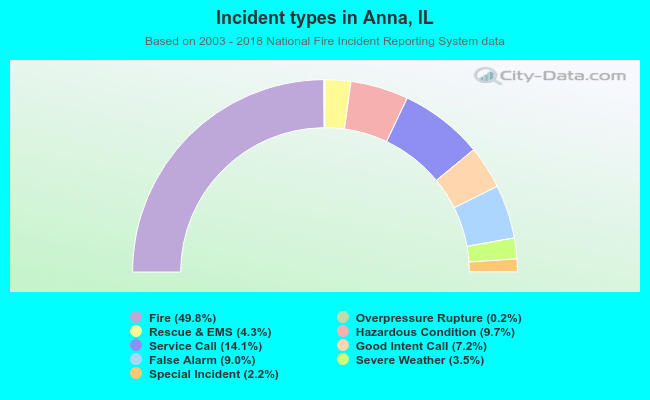 Out of all 1,110 cases reported during the years 2003 - 2018, the most belonged to the categories: Fire (49.8%), Service Call (14.1%), and Hazardous Condition (9.7%).
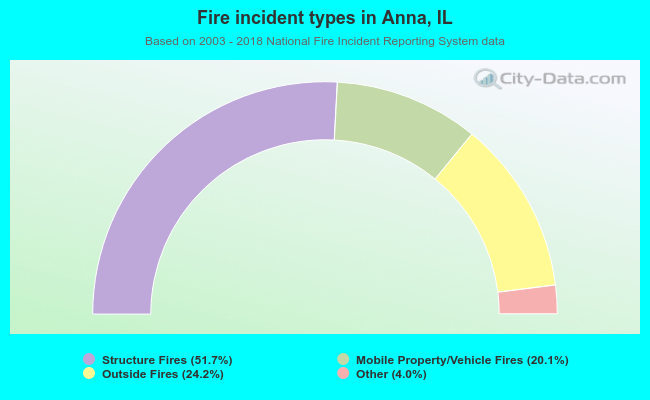 When looking into fire subcategories, the most reports belonged to: Structure Fires (51.7%), and Outside Fires (24.2%).