Cairo: Fire Incidents, Illinois (IL)
Where are fire incidents reported in Cairo, IL
Something went wrong! Please refresh the page.
|
| |||||||||||||||||||||||||||||||||||||||||||||||||||||||||||||||||||||||||||||||||||||||||||||||||||||||||||||
2004 - 2018 National Fire Incident Reporting System (NFIRS) incidents
- Incident types reported to NFIRS in Cairo, IL
- 52688.3%Fire
- 6010.1%Hazardous Condition
- 40.7%Good Intent Call
- 30.5%Service Call
- 20.3%Rescue & EMS
- 10.2%Special Incident
- Fire incident types reported to NFIRS in Cairo, IL
- 29756.5%Structure Fires
- 11622.1%Outside Fires
- 6211.8%Other
- 519.7%Mobile Property/Vehicle Fires
 Based on the data from the years 2004 - 2018 the average number of fires per year is 35. The highest number of fires - 94 took place in 2004, and the least - 3 in 2018. The data has a dropping trend.
 The median response time based on all reported fire incidents is 3 minutes. This is lower compared to the state median value.
The median response time in Cairo, IL compared to nearest cities:
(Note: Based on data for all years, including only cities with at least 500 fire incidents)
| Cairo: | 3 minutes |
| Metropolis: | 5 minutes |
| Anna: | 5 minutes |
 40.5% incidents where reported in the morning and 59.5% in the evening. The most fires (22.6%) took place on Sunday, and the least (9.7%) on Tuesday.
 According to the 526 reports from years 2004 - 2018 most fires (12.4%) took place during March, and the least (2.1%) in December.
 Out of all 596 cases reported during the years 2004 - 2018, the most belonged to the categories: Fire (88.3%), Rescue & EMS (10.1%), and Service Call (0.7%).
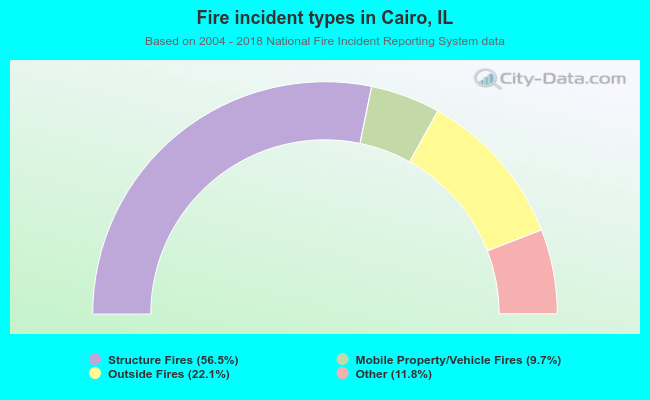 When looking into fire subcategories, the most incidents belonged to: Structure Fires (56.5%), and Outside Fires (22.1%).