Ann Arbor: Fire Incidents, Michigan (MI)
Where are fire incidents reported in Ann Arbor, MI
Something went wrong! Please refresh the page.
| Fire incidents reported | |
|---|---|
| Sreet name | Count |
| STATE ST | 316 |
| JACKSON RD | 260 |
| MAIN ST | 246 |
| PACKARD RD | 216 |
| WASHTENAW AVE | 170 |
| PLYMOUTH RD | 132 |
| MAPLE RD | 126 |
| HILL ST | 120 |
| CHURCH ST | 114 |
| LIBERTY ST | 114 |
| STADIUM BLVD | 112 |
| UNIVERSITY | 104 |
| FOURTH AVE | 96 |
| PLATT RD | 88 |
| HURON ST | 84 |
| FULLER RD | 76 |
| JACKSON | 74 |
| MILLER AVE | 74 |
| DIVISION ST | 70 |
| BROADWAY ST | 68 |
| OAKLAND AVE | 66 |
| FOREST AVE | 64 |
| HURON RIVER DR | 58 |
| JACKSON AVE | 58 |
| JOY RD | 58 |
| WASHINGTON ST | 58 |
| BRIARWOOD CIR | 56 |
| PAULINE BLVD | 56 |
| FOURTH | 54 |
| ZEEB RD | 54 |
| Other | 2,500 |
2002 - 2018 National Fire Incident Reporting System (NFIRS) incidents
- Incident types reported to NFIRS in Ann Arbor, MI
- 32,87150.8%Rescue & EMS
- 7,86112.2%Hazardous Condition
- 7,48211.6%Good Intent Call
- 6,89510.7%False Alarm
- 5,7428.9%Fire
- 3,4945.4%Service Call
- 2250.3%Overpressure Rupture
- 970.1%Special Incident
- Fire incident types reported to NFIRS in Ann Arbor, MI
- 2,45742.8%Structure Fires
- 1,99534.7%Outside Fires
- 1,06618.6%Mobile Property/Vehicle Fires
- 2243.9%Other
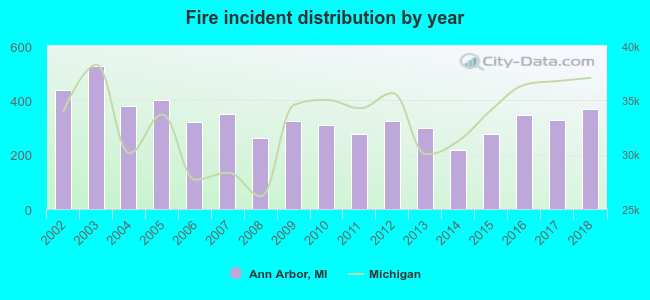 According to the data from the years 2002 - 2018 the average number of fires per year is 338. The highest number of reported fires - 527 took place in 2003, and the least - 216 in 2014. The data has a dropping trend.
The average number of yearly fire incidents per 10k residents in Ann Arbor, MI compared to nearest cities:
(Note: Based on data for the last 3 years, including only cities with population 5,000 and above)
| Ann Arbor: | 29.5 |
| Ypsilanti: | 189.9 |
| Saline: | 48.4 |
| Whitmore Lake: | 81.0 |
| Milan: | 71.1 |
| Canton: | 16.6 |
| South Lyon: | 54.9 |
| Chelsea: | 85.7 |
| Plymouth Township: | 2.4 |
 The median response time based on all reported fire incidents is 5 minutes. This is lower than the state median value.
The median response time in Ann Arbor, MI compared to nearest cities:
(Note: Based on data for all years, including only cities with at least 500 fire incidents)
| Ann Arbor: | 5 minutes |
| Ypsilanti: | 5 minutes |
| Saline: | 6 minutes |
| Dexter: | 8 minutes |
| Whitmore Lake: | 8 minutes |
| Milan: | 10 minutes |
| Canton: | 6 minutes |
| South Lyon: | 7 minutes |
| Belleville: | 7 minutes |
 Based on the data from the years 2002 - 2018 the average number of fire-related yearly deaths is 1. The highest number of reported deaths - 4 took place in 2003, and the lowest - 0 in 2004. The data has a declining trend.
The average number of deaths per 1,000 fire incidents is 2. This indicator was the highest - 9 in 2009, and the lowest 0 in 2004. The trend for fatalities per 1,000 fire incidents is decreasing. Compared to the Michigan value the number of deaths per 1,000 fires is about the same.
Based on the data from the years 2002 - 2018 the average number of fire-related yearly deaths is 1. The highest number of reported deaths - 4 took place in 2003, and the lowest - 0 in 2004. The data has a declining trend.
The average number of deaths per 1,000 fire incidents is 2. This indicator was the highest - 9 in 2009, and the lowest 0 in 2004. The trend for fatalities per 1,000 fire incidents is decreasing. Compared to the Michigan value the number of deaths per 1,000 fires is about the same.Deaths per 1,000 incidents in Ann Arbor, MI compared to nearest cities:
(Note: Based on data for all years, including only cities with at least 2,500 fire incidents)
| Ann Arbor: | 2.4 |
| Ypsilanti: | 3.0 |
| Taylor: | 3.2 |
| Dearborn: | 1.8 |
| Southfield: | 3.1 |
| Monroe: | 2.7 |
 Based on the reports from the years 2002 - 2018 the average number of fire-related yearly casualties is 5. The highest number of reported casualties - 11 took place in 2004, and the lowest - 0 in 2014. The data has a declining trend.
The average number of casualties per 1,000 fires is 13. This indicator was the highest - 30 in 2013, and the lowest 0 in 2014. The trend for casualties per 1,000 fires is decreasing. Compared to the Michigan value the number of injuries per 1,000 fires is about the same.
Based on the reports from the years 2002 - 2018 the average number of fire-related yearly casualties is 5. The highest number of reported casualties - 11 took place in 2004, and the lowest - 0 in 2014. The data has a declining trend.
The average number of casualties per 1,000 fires is 13. This indicator was the highest - 30 in 2013, and the lowest 0 in 2014. The trend for casualties per 1,000 fires is decreasing. Compared to the Michigan value the number of injuries per 1,000 fires is about the same.Casualties per 1,000 incidents in Ann Arbor, MI compared to nearest cities:
(Note: Based on data for all years, including only cities with at least 500 fire incidents)
| Ann Arbor: | 13.4 |
| Ypsilanti: | 36.3 |
| Saline: | 1.9 |
| Dexter: | 2.7 |
| Whitmore Lake: | 3.7 |
| Milan: | 7.8 |
| Canton: | 24.2 |
| South Lyon: | 7.6 |
| Belleville: | 8.6 |
 33.5% incidents where reported in the morning and 66.5% in the evening. The most fires (16.3%) took place on Saturday, and the least (12.9%) on Monday.
 Based on the 5,742 fire incidents from years 2002 - 2018 most fires (11.8%) took place during April, and the least (6.2%) in December.
 Out of all 64,693 cases reported during the years 2002 - 2018, the most belonged to the categories: Rescue & EMS (50.8%), Hazardous Condition (12.2%), and Good Intent Call (11.6%).
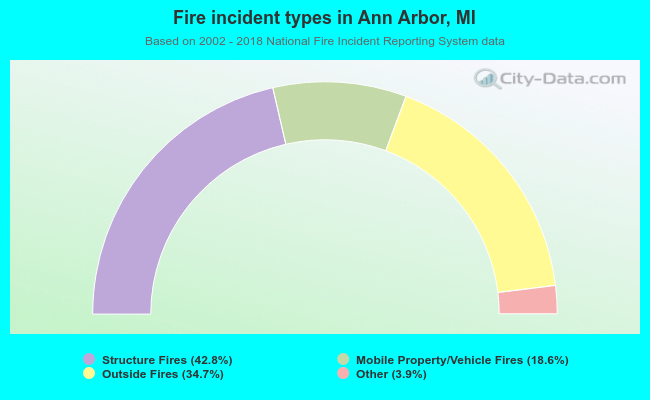 When looking into fire subcategories, the most incidents belonged to: Structure Fires (42.8%), and Outside Fires (34.7%).