Taylor: Fire Incidents, Michigan (MI)
Where are fire incidents reported in Taylor, MI
Something went wrong! Please refresh the page.
| Fire incidents reported | |
|---|---|
| Sreet name | Count |
| TELEGRAPH | 290 |
| EUREKA | 280 |
| EUREKA RD | 212 |
| TELEGRAPH RD | 164 |
| ECORSE | 148 |
| PINE | 140 |
| BEECH DALY | 136 |
| PARDEE | 122 |
| I94 | 100 |
| BEECH DALY RD | 96 |
| PINE ST | 90 |
| WICK | 86 |
| GODDARD | 76 |
| PARDEE RD | 76 |
| NORTHLINE | 70 |
| NORTHLINE RD | 66 |
| VAN BORN | 58 |
| POND VILLAGE | 56 |
| WICK RD | 56 |
| PENNSYLVANIA | 52 |
| POND VILLAGE DR | 50 |
| ECORSE RD | 48 |
| GODDARD RD | 48 |
| SYRACUSE | 48 |
| CORNELL | 46 |
| VAN BORN RD | 46 |
| ZIEGLER | 46 |
| WEDDEL | 44 |
| WEDDEL ST | 44 |
| JACKSON | 40 |
| Other | 901 |
2002 - 2018 National Fire Incident Reporting System (NFIRS) incidents
- Incident types reported to NFIRS in Taylor, MI
- 30,78160.4%Rescue & EMS
- 7,13614.0%Hazardous Condition
- 3,9347.7%Good Intent Call
- 3,7357.3%Fire
- 3,6017.1%Service Call
- 1,5913.1%False Alarm
- 850.2%Severe Weather
- 510.1%Special Incident
- Fire incident types reported to NFIRS in Taylor, MI
- 1,32635.5%Structure Fires
- 1,28234.3%Outside Fires
- 95925.7%Mobile Property/Vehicle Fires
- 1684.5%Other
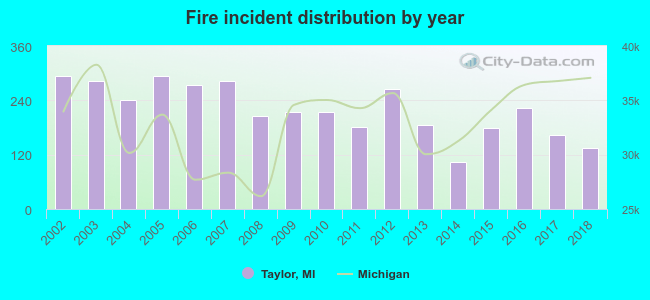 Based on the data from the years 2002 - 2018 the average number of fires per year is 220. The highest number of fire incidents - 293 took place in 2002, and the least - 104 in 2014. The data has a decreasing trend.
The average number of yearly fire incidents per 10k residents in Taylor, MI compared to nearest cities:
(Note: Based on data for the last 3 years, including only cities with population 5,000 and above)
| Taylor: | 28.1 |
| Allen Park: | 25.0 |
| Southgate: | 18.0 |
| Lincoln Park: | 28.0 |
| Inkster: | 58.9 |
| Melvindale: | 31.6 |
| Romulus: | 49.8 |
| Wyandotte: | 23.3 |
| Riverview: | 31.4 |
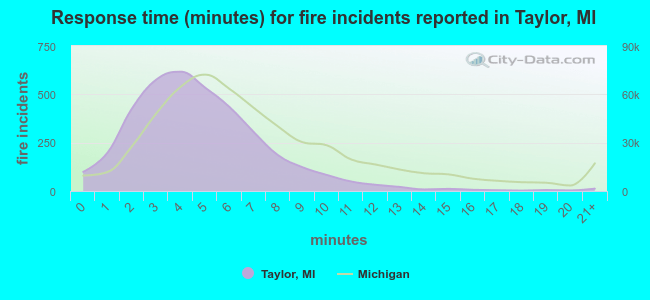 The median response time based on all reported fire incidents is 4 minutes. This is lower compared to the state median value.
The median response time in Taylor, MI compared to nearest cities:
(Note: Based on data for all years, including only cities with at least 500 fire incidents)
| Taylor: | 4 minutes |
| Allen Park: | 5 minutes |
| Southgate: | 5 minutes |
| Lincoln Park: | 4 minutes |
| Inkster: | 5 minutes |
| Melvindale: | 3 minutes |
| Romulus: | 7 minutes |
| Wyandotte: | 4 minutes |
| Dearborn Heights: | 6 minutes |
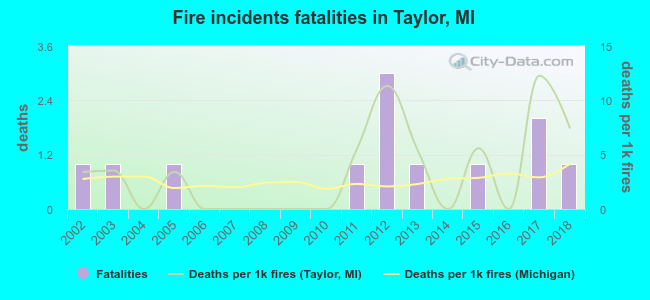 Based on the reports from the years 2002 - 2018 the average number of fire-related fatalities per year is 1. The highest number of reported deaths - 3 took place in 2012, and the lowest - 0 in 2004. The data has a constant trend.
The average number of deaths per 1,000 fires is 3. This indicator was the highest - 12 in 2017, and the lowest 0 in 2004. The trend for fatalities per 1,000 fires is increasing. Compared to the Michigan value the number of fatalities per 1,000 fire incidents is higher.
Based on the reports from the years 2002 - 2018 the average number of fire-related fatalities per year is 1. The highest number of reported deaths - 3 took place in 2012, and the lowest - 0 in 2004. The data has a constant trend.
The average number of deaths per 1,000 fires is 3. This indicator was the highest - 12 in 2017, and the lowest 0 in 2004. The trend for fatalities per 1,000 fires is increasing. Compared to the Michigan value the number of fatalities per 1,000 fire incidents is higher.
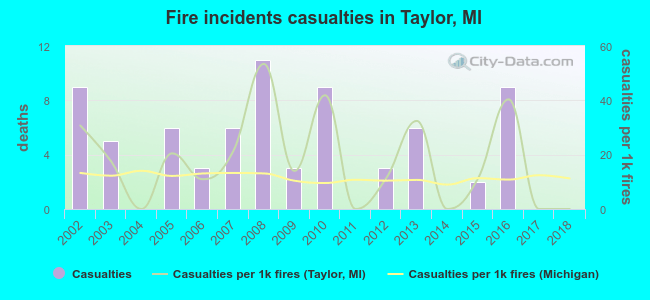 According to the data from the years 2002 - 2018 the average number of fire-related yearly casualties is 4. The highest number of casualties - 11 took place in 2008, and the lowest - 0 in 2004. The data has a declining trend.
The average number of casualties per 1,000 fire incidents is 18. This indicator was the highest - 53 in 2008, and the lowest 0 in 2004. The trend for injuries per 1,000 fires is dropping. Compared to the Michigan value the number of injuries per 1,000 fires is higher.
According to the data from the years 2002 - 2018 the average number of fire-related yearly casualties is 4. The highest number of casualties - 11 took place in 2008, and the lowest - 0 in 2004. The data has a declining trend.
The average number of casualties per 1,000 fire incidents is 18. This indicator was the highest - 53 in 2008, and the lowest 0 in 2004. The trend for injuries per 1,000 fires is dropping. Compared to the Michigan value the number of injuries per 1,000 fires is higher.Casualties per 1,000 incidents in Taylor, MI compared to nearest cities:
(Note: Based on data for all years, including only cities with at least 500 fire incidents)
| Taylor: | 19.3 |
| Allen Park: | 3.9 |
| Southgate: | 14.5 |
| Lincoln Park: | 31.9 |
| Inkster: | 8.1 |
| Melvindale: | 30.6 |
| Romulus: | 14.2 |
| Wyandotte: | 26.9 |
| Dearborn Heights: | 21.4 |
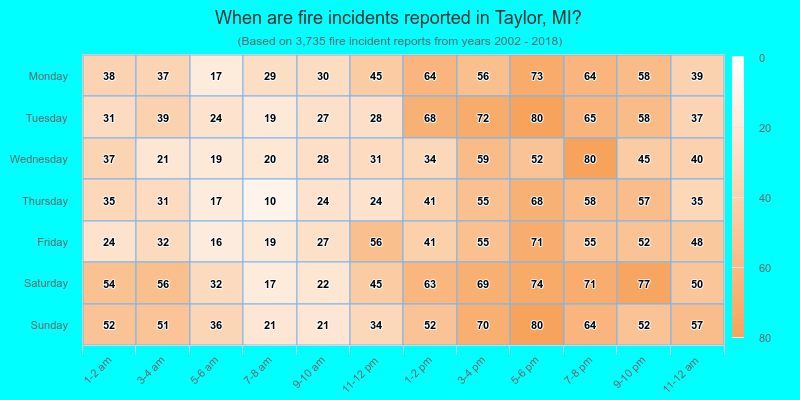
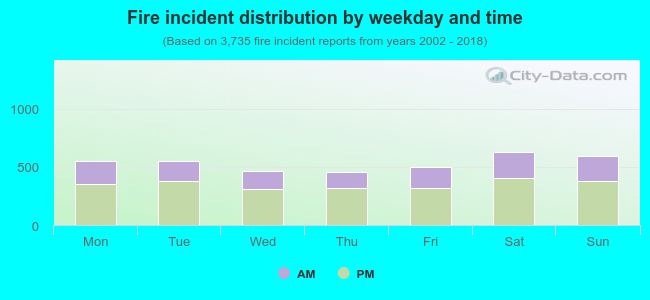 34.2% incidents where reported in the morning and 65.8% in the evening. The most fires (16.9%) took place on Saturday, and the least (12.2%) on Thursday.
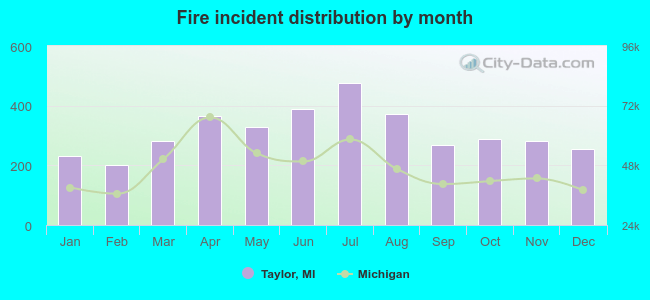 According to the 3,735 fire incident reports from years 2002 - 2018 most fires (12.7%) took place during July, and the least (5.4%) in February.
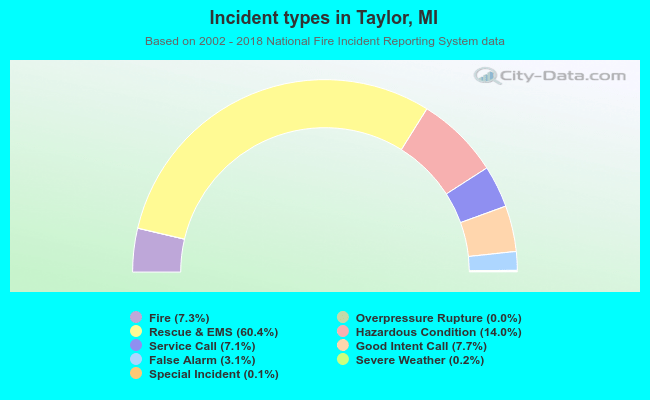 Out of all 50,920 cases reported during the years 2002 - 2018, the most belonged to the categories: Rescue & EMS (60.4%), Hazardous Condition (14.0%), and Good Intent Call (7.7%).
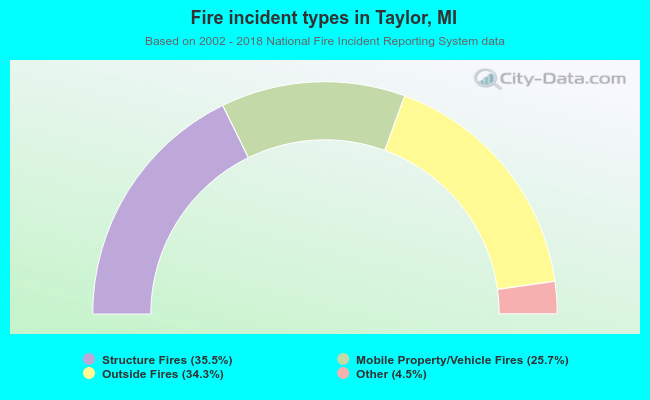 When looking into fire subcategories, the most reports belonged to: Structure Fires (35.5%), and Outside Fires (34.3%).