Chelsea: Fire Incidents, Michigan (MI)
Where are fire incidents reported in Chelsea, MI
Something went wrong! Please refresh the page.
|
| |||||||||||||||||||||||||||||||||||||||||||||||||||||||||||||||||||||||||||||||||||||||||||||||||||||||||||||
2002 - 2018 National Fire Incident Reporting System (NFIRS) incidents
- Incident types reported to NFIRS in Chelsea, MI
- 3,79350.8%Rescue & EMS
- 1,10214.8%Good Intent Call
- 96312.9%Hazardous Condition
- 7059.4%Fire
- 4546.1%Service Call
- 4265.7%False Alarm
- 90.1%Severe Weather
- 90.1%Special Incident
- Fire incident types reported to NFIRS in Chelsea, MI
- 27839.4%Outside Fires
- 25235.7%Structure Fires
- 14720.9%Mobile Property/Vehicle Fires
- 284.0%Other
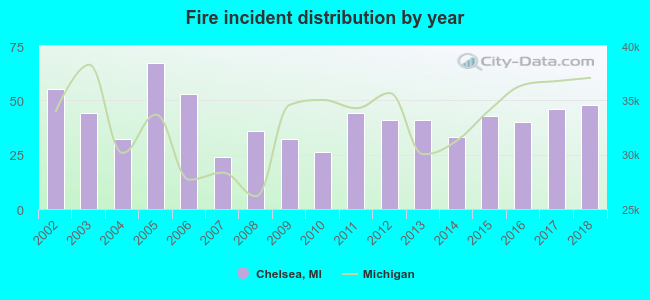 Based on the data from the years 2002 - 2018 the average number of fire incidents per year is 41. The highest number of fires - 67 took place in 2005, and the least - 24 in 2007. The data has a dropping trend.
The average number of yearly fire incidents per 10k residents in Chelsea, MI compared to nearest cities:
(Note: Based on data for the last 3 years, including only cities with population 5,000 and above)
| Chelsea: | 85.7 |
| Ann Arbor: | 29.5 |
| Whitmore Lake: | 81.0 |
| Saline: | 48.4 |
| Brighton: | 156.3 |
| Jackson: | 120.5 |
| Howell: | 162.9 |
| Ypsilanti: | 189.9 |
| South Lyon: | 54.9 |
 The median response time based on all reported fire incidents is 8 minutes. This is higher compared to the state median value.
The median response time in Chelsea, MI compared to nearest cities:
(Note: Based on data for all years, including only cities with at least 500 fire incidents)
| Chelsea: | 8 minutes |
| Dexter: | 8 minutes |
| Pinckney: | 8 minutes |
| Manchester: | 11 minutes |
| Ann Arbor: | 5 minutes |
| Whitmore Lake: | 8 minutes |
| Saline: | 6 minutes |
| Brooklyn: | 8 minutes |
| Brighton: | 8 minutes |
 33.2% incidents where reported in the morning and 66.8% in the evening. The most fires (19.9%) took place on Saturday, and the least (11.3%) on Wednesday.
 Based on the 705 fire incident reports from years 2002 - 2018 most fires (17.0%) took place during April, and the least (4.5%) in September.
 Out of all 7,468 cases reported during the years 2002 - 2018, the most belonged to the categories: Rescue & EMS (50.8%), Good Intent Call (14.8%), and Hazardous Condition (12.9%).
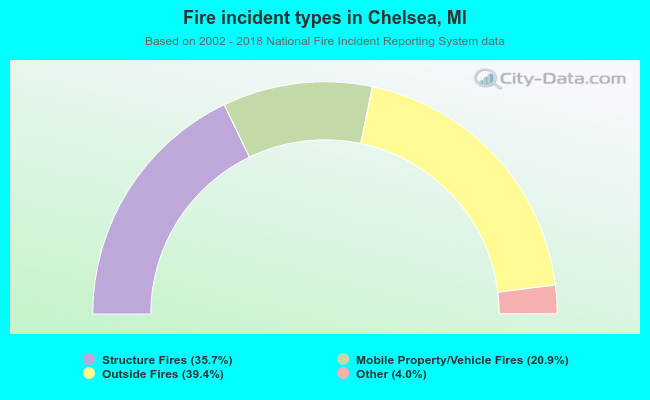 When looking into fire subcategories, the most incidents belonged to: Outside Fires (39.4%), and Structure Fires (35.7%).