Rockwall County, Texas (TX)
County owner-occupied free and clear houses and condos in 2010: 3,918
County owner-occupied houses and condos in 2000: 12,010
Renter-occupied apartments: 4,562 (it was 2,520 in 2000)
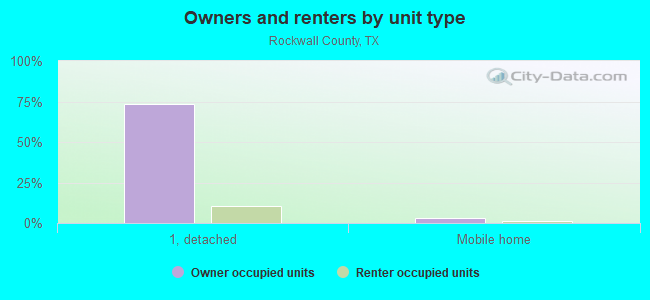
| % of renters here: | 17% |
| State: | 36% |
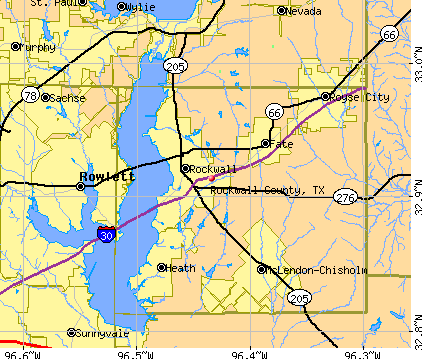
Land area: 129 sq. mi.
Water area: 19.9 sq. mi.
Population density: 957 people per square mile (very high).
Industries providing employment: Educational, health and social services (21.5%), Professional, scientific, management, administrative, and waste management services (16.4%), Retail trade (11.2%).
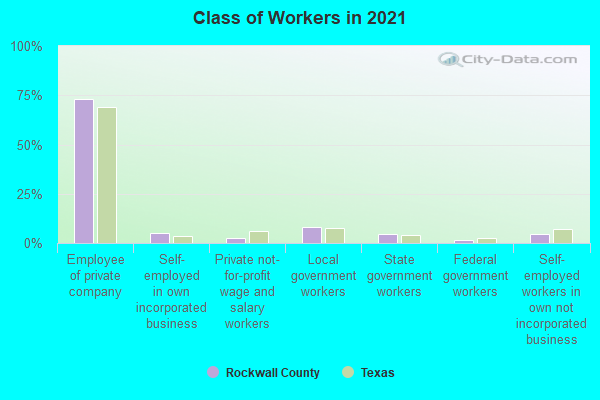
Type of workers:
- Private wage or salary: 80%
- Government: 14%
- Self-employed, not incorporated: 6%
- Unpaid family work: 0%
- OSM Map
- General Map
- Google Map
- MSN Map

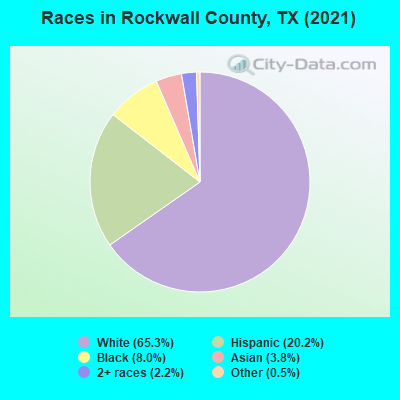
- 77,87563.2%White Non-Hispanic Alone
- 25,77520.9%Hispanic or Latino
- 10,5188.5%Black Non-Hispanic Alone
- 4,2683.5%Asian alone
- 3,5122.9%Two or more races
- 7430.6%Some other race alone
- 3010.2%Native Hawaiian and Other
Pacific Islander alone - 2160.2%American Indian and Alaska Native alone
| Median resident age: | 38.3 years |
| Texas median age: | 35.6 years |
| Males: 62,263 | |
| Females: 60,945 |

 | When will Sherman/Denison Be In DFW Metro? (66 replies) |
| 2023 DFW County Appraisals & Assessments Thread (75 replies) |
| FACT: Texas is 30 years behind California (71 replies) |
| 2024 DFW Appraisals & Assessments Thread (16 replies) |
| 2022 DFW County Appraisals & Assessments Thread (55 replies) |
| Best suburbs drivable to Big Baylor Hospital... (28 replies) |
| Rockwall County: | 2.0 people |
| Texas: | 3 people |
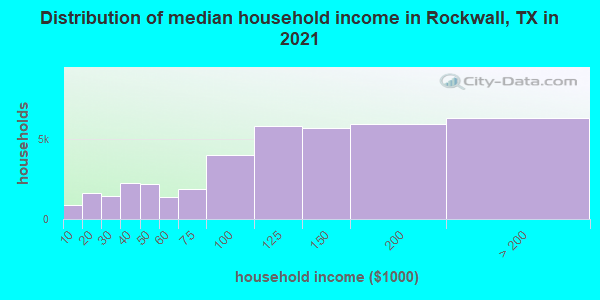
Estimated median household income in 2022: $123,767 ($65,164 in 1999)
| This county: | $123,767 |
| Texas: | $72,284 |
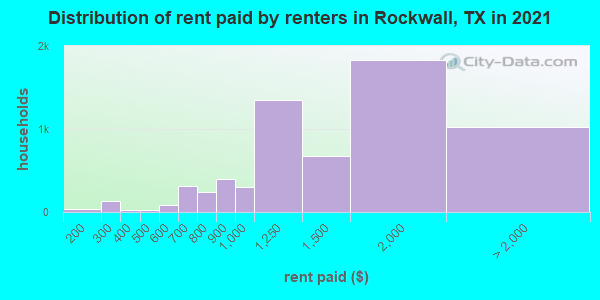
Median contract rent in 2022 for apartments: $1,763 (lower quartile is $1,412, upper quartile is $2,150)
| This county: | $1763 |
| State: | $1117 |
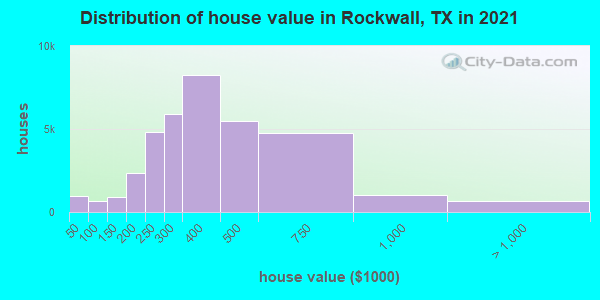
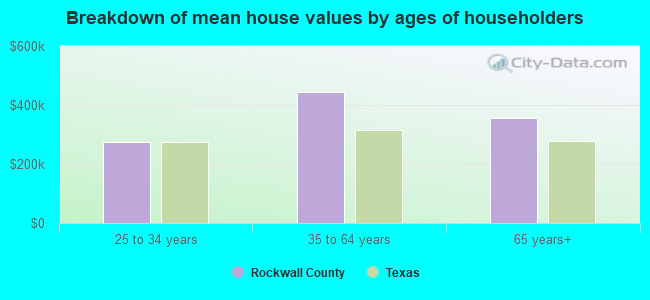
Estimated median house or condo value in 2022: $422,500 (it was $141,900 in 2000)
| Rockwall: | $422,500 |
| Texas: | $275,400 |
Mean price in 2022:
Median monthly housing costs for homes and condos with a mortgage: $2,361Detached houses: $455,191
Here: $455,191 State: $369,058 Townhouses or other attached units: $271,934
Here: $271,934 State: $327,631 In 3-to-4-unit structures: $150,727
Here: $150,727 State: $209,652 In 5-or-more-unit structures: $374,076
Here: $374,076 State: $413,944 Mobile homes: $101,574
Here: $101,574 State: $124,413
Median monthly housing costs for units without a mortgage: $944
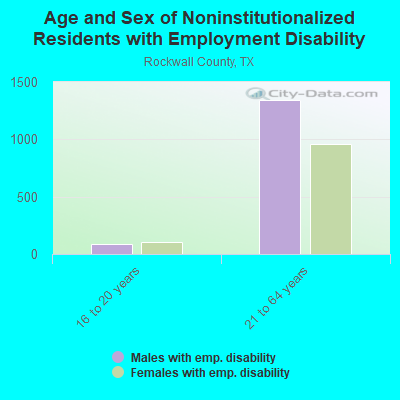
Institutionalized population: 659
Crime in 2021 (reported by the sheriff's office or county police, not the county total):
- Murders: 0
- Rapes: 4
- Robberies: 0
- Assaults: 21
- Burglaries: 20
- Thefts: 66
- Auto thefts: 13
Crime in 2020 (reported by the sheriff's office or county police, not the county total):
- Murders: 0
- Rapes: 2
- Robberies: 1
- Assaults: 11
- Burglaries: 14
- Thefts: 42
- Auto thefts: 8
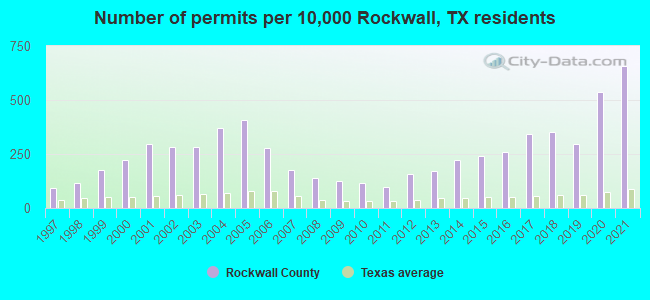
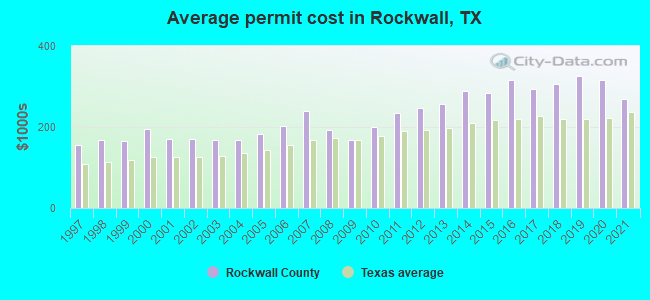
Single-family new house construction building permits:
- 2022: 2497 buildings, average cost: $296,900
- 2021: 2830 buildings, average cost: $268,400
- 2020: 2306 buildings, average cost: $315,100
- 2019: 1283 buildings, average cost: $325,800
- 2018: 1517 buildings, average cost: $305,200
- 2017: 1468 buildings, average cost: $293,700
- 2016: 1116 buildings, average cost: $317,000
- 2015: 1046 buildings, average cost: $284,600
- 2014: 965 buildings, average cost: $288,800
- 2013: 741 buildings, average cost: $256,900
- 2012: 675 buildings, average cost: $247,700
- 2011: 411 buildings, average cost: $233,800
- 2010: 489 buildings, average cost: $200,800
- 2009: 545 buildings, average cost: $166,500
- 2008: 589 buildings, average cost: $192,800
- 2007: 759 buildings, average cost: $240,200
- 2006: 1190 buildings, average cost: $201,800
- 2005: 1756 buildings, average cost: $183,400
- 2004: 1598 buildings, average cost: $168,100
- 2003: 1219 buildings, average cost: $168,500
- 2002: 1224 buildings, average cost: $171,000
- 2001: 1267 buildings, average cost: $171,000
- 2000: 955 buildings, average cost: $194,400
- 1999: 761 buildings, average cost: $165,900
- 1998: 495 buildings, average cost: $169,200
- 1997: 391 buildings, average cost: $154,600
Median real estate property taxes paid for housing units with mortgages in 2022: $6,715 (1.5%)
Median real estate property taxes paid for housing units with no mortgage in 2022: $5,026 (1.3%)
| Rockwall County: | 4.0% |
| Texas: | 14.0% |
Median age of residents in 2022: 38.3 years old
(Males: 38.1 years old, Females: 38.6 years old)
(Median age for: White residents: 40.6 years old, Black residents: 41.0 years old, American Indian residents: 28.1 years old, Asian residents: 41.6 years old, Hispanic or Latino residents: 28.6 years old, Other race residents: 43.1 years old)
Area name: Dallas, TX HUD Metro FMR Area
Fair market rent in 2006 for a 1-bedroom apartment in Rockwall County is $607 a month.
Fair market rent for a 2-bedroom apartment is $733 a month.
Fair market rent for a 3-bedroom apartment is $954 a month.
Cities in this county include: Northwest Rockwall, Rockwall, South Rockwall, Northeast Rockwall, Heath, Royse City, McLendon-Chisholm, Fate, Mobile City.
2023 air pollution in Rockwall County:
Ozone (1-hour): 0.029 ppm (standard limit: 0.12 ppm). Below U.S. average.
Notable locations in this county outside city limits:
Notable locations in Rockwall County: Sand Flat Community Center (A), Henderson County Clint W Murchison Memorial Library (B), Southwest Rains Volunteer Fire Department (C), Rockey Point Center (D). Display/hide their locations on the map
Churches in Rockwall County include: Prairie Grove Church (A), Prospect Church (B), County Line Church (C), Richland Baptist Church (D), Dunbar Union Church (E), Woosky Church (F), Clarks Chapel (G), Bois D'Arc Church (H), Church of the Living God (I). Display/hide their locations on the map
Cemeteries: Slatter Cemetery (1), Robertson-Henrys Chapel Cemetery (2), Lone Star Cemetery (3), Richland-Benton Hill Cemetery (4), Burke-Yandell Cemetery (5), Parks Cemetery (6), Campbell Cemetery (7). Display/hide their locations on the map
Lakes and reservoirs: Twin Lakes (A), Holcomb Lake (B), Flag Pond (C), Fish Lake (D), Highland Lake (E), Montgomery Lake (F), Hauak Lake (G), Greenes Lake (H). Display/hide their locations on the map
Streams, rivers, and creeks: Brushy Creek (A), Brickkiln Branch (B), White Oak Branch (C), Bee Branch (D), Sticky Branch (E), Bear Creek (F), Simpkins Creek (G), Schoolhouse Branch (H), Sand Branch (I). Display/hide their locations on the map
Parks in Rockwall County include: Sky Point Park (1), Jenkins Park (2). Display/hide their locations on the map
Neighboring counties: Emanuel County, Georgia  , Union Parish, Louisiana , Union County, Arkansas , Heard County, Georgia .
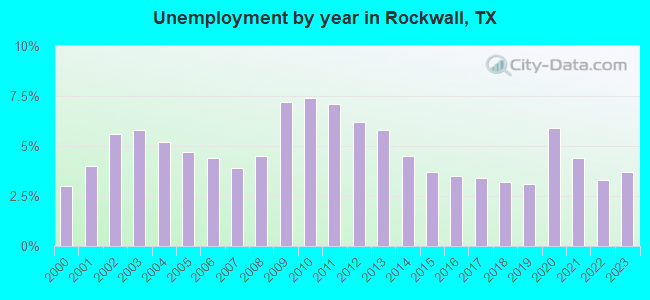
| Here: | 3.2% |
| Texas: | 3.5% |
Current college students: 1,854
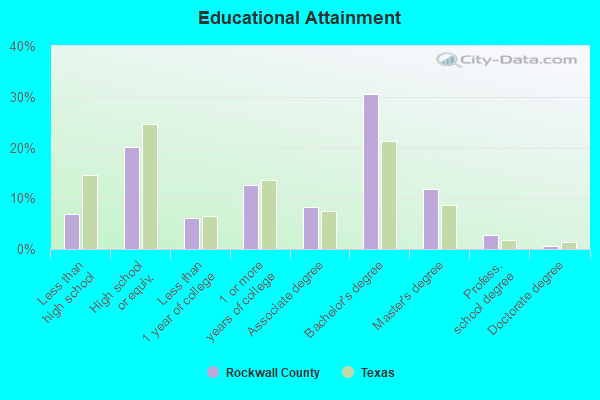
People 25 years of age or older with a high school degree or higher: 93.0%
People 25 years of age or older with a bachelor's degree or higher: 41.3%
Number of foreign born residents: 10,379 (69.3% naturalized citizens)
| Rockwall County: | 8.4% |
| Whole state: | 17.2% |
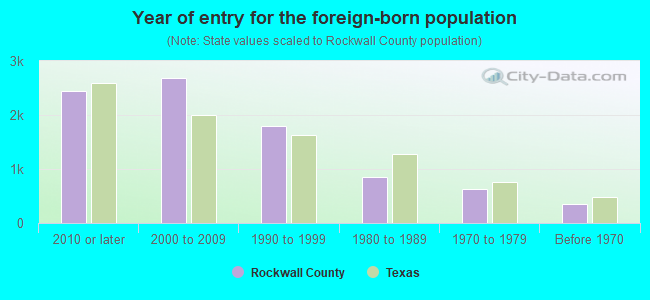
- Year of entry for the foreign-born population
- 2,7882010 or later
- 2,1902000 to 2009
- 1,9081990 to 1999
- 8581980 to 1989
- 6291970 to 1979
- 352Before 1970
Mean travel time to work (commute): # minutes
Percentage of county residents living and working in this county: 99.7%

Housing units in structures:
- One, detached: 37,925
- One, attached: 785
- Two: 30
- 3 or 4: 934
- 5 to 9: 1,138
- 10 to 19: 271
- 20 to 49: 74
- 50 or more: 1,727
- Mobile homes: 1,266
Housing units in Rockwall County with a mortgage: 26,061 (1,192 second mortgage, 0 home equity loan, 840 both second mortgage and home equity loan)
Houses without a mortgage: 204
| Here: | 11.3% with mortgage |
| State: | 98.4% with mortgage |
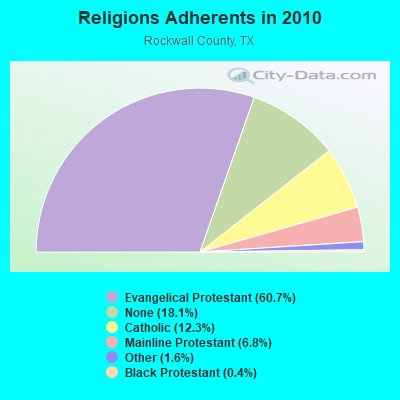
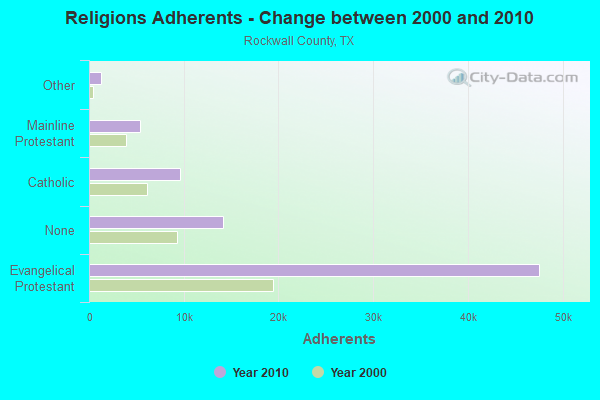
Religion statistics for Rockwall County
| Religion | Adherents | Congregations |
|---|---|---|
| Evangelical Protestant | 47,563 | 58 |
| Catholic | 9,619 | 1 |
| Mainline Protestant | 5,337 | 9 |
| Other | 1,279 | 3 |
| Black Protestant | 338 | 2 |
| None | 14,201 | - |
Source: Clifford Grammich, Kirk Hadaway, Richard Houseal, Dale E.Jones, Alexei Krindatch, Richie Stanley and Richard H.Taylor. 2012. 2010 U.S.Religion Census: Religious Congregations & Membership Study. Association of Statisticians of American Religious Bodies. Jones, Dale E., et al. 2002. Congregations and Membership in the United States 2000. Nashville, TN: Glenmary Research Center.
Food Environment Statistics:
| Rockwall County: | 0.95 / 10,000 pop. |
| State: | 1.47 / 10,000 pop. |
| Here: | 0.14 / 10,000 pop. |
| Texas: | 0.14 / 10,000 pop. |
| This county: | 0.54 / 10,000 pop. |
| Texas: | 1.11 / 10,000 pop. |
| Rockwall County: | 3.12 / 10,000 pop. |
| Texas: | 3.95 / 10,000 pop. |
| This county: | 7.73 / 10,000 pop. |
| State: | 6.13 / 10,000 pop. |
| Rockwall County: | 8.0% |
| Texas: | 8.9% |
| Rockwall County: | 26.8% |
| State: | 26.6% |
| Here: | 14.3% |
| State: | 15.7% |
Agriculture in Rockwall County:
Average size of farms: 121 acresAverage value of agricultural products sold per farm: $7,790
Average value of crops sold per acre for harvested cropland: $74.44
The value of nursery, greenhouse, floriculture, and sod as a percentage of the total market value of agricultural products sold: 0.81%
The value of livestock, poultry, and their products as a percentage of the total market value of agricultural products sold: 64.86%
Average total farm production expenses per farm: $10,071
Harvested cropland as a percentage of land in farms: 30.50%
Irrigated harvested cropland as a percentage of land in farms: 0.73%
Average market value of all machinery and equipment per farm: $38,090
The percentage of farms operated by a family or individual: 95.84%
Average age of principal farm operators: 55 years
Average number of cattle and calves per 100 acres of all land in farms: 15.56
Milk cows as a percentage of all cattle and calves: 0.60%
All wheat for grain: 3102 harvested acres
Soybeans for beans: 1134 harvested acres
Land in orchards: 79 acres
Tornado activity:
Rockwall County historical area-adjusted tornado activity is significantly below Texas state average. It is 1227213.1 times below overall U.S. average.On 10/18/1993, a category 2 (max. wind speeds 113-157 mph) tornado killed one person and caused between $50,000 and $500,000 in damages.
Earthquake activity:
Rockwall County-area historical earthquake activity is significantly above Texas state average. It is 475% greater than the overall U.S. average.On 11/6/2011 at 03:53:10, a magnitude 5.7 (5.7 MW, Depth: 3.2 mi, Class: Moderate, Intensity: VI - VII) earthquake occurred 182.1 miles away from Rockwall County center
On 9/3/2016 at 12:02:44, a magnitude 5.8 (5.8 MW, Depth: 3.5 mi) earthquake occurred 244.5 miles away from the county center
On 5/17/2012 at 08:12:00, a magnitude 4.8 (4.8 MW, Depth: 3.1 mi, Class: Light, Intensity: IV - V) earthquake occurred 138.6 miles away from the county center
On 6/16/1978 at 11:46:54, a magnitude 5.3 (4.4 MB, 4.6 UK, 5.3 ML) earthquake occurred 251.5 miles away from the county center
On 11/7/2016 at 01:44:24, a magnitude 5.0 (5.0 MW, Depth: 2.8 mi) earthquake occurred 213.9 miles away from Rockwall County center
On 9/6/1997 at 23:38:00, a magnitude 4.5 (4.5 LG, 4.2 LG, Depth: 3.1 mi) earthquake occurred 120.8 miles away from the county center
Magnitude types: regional Lg-wave magnitude (LG), body-wave magnitude (MB), local magnitude (ML), moment magnitude (MW)
Most recent natural disasters:
- Texas Covid-19 Pandemic, Incident Period: January 20, 2020, FEMA Id: 4485, Natural disaster type: Other
- Texas Severe Winter Storms, Tornadoes, Straight-line Winds, and Flooding, Incident Period: December 26, 2016 to January 21, 2016, Major Disaster (Presidential) Declared DR-4255: February 09, 2016, FEMA Id: 4255, Natural disaster type: Winter Storm, Tornado, Flood, Wind
- Texas Wildfires, Incident Period: March 14, 2008 to September 01, 2008, Emergency Declared EM-3284: March 14, 2008, FEMA Id: 3284, Natural disaster type: Fire
- Texas Hurricane Rita, Incident Period: September 23, 2005 to October 14, 2005, Major Disaster (Presidential) Declared DR-1606: September 24, 2005, FEMA Id: 1606, Natural disaster type: Hurricane
- Texas Hurricane Rita, Incident Period: September 20, 2005 to October 14, 2005, Emergency Declared EM-3261: September 21, 2005, FEMA Id: 3261, Natural disaster type: Hurricane
- Texas Hurricane Katrina, Incident Period: August 29, 2005 to October 01, 2005, Emergency Declared EM-3216: September 02, 2005, FEMA Id: 3216, Natural disaster type: Hurricane
- Texas Loss of the Space Shuttle Columbia, Incident Period: February 01, 2003, Emergency Declared EM-3171: February 01, 2003, FEMA Id: 3171, Natural disaster type: Other
- Texas Extreme Fire Hazards, Incident Period: August 01, 1999 to December 10, 1999, Emergency Declared EM-3142: September 01, 1999, FEMA Id: 3142, Natural disaster type: Fire
- Texas Extreme Fire Hazard, Incident Period: August 30, 1993 to November 15, 1993, Emergency Declared EM-3113: September 10, 1993, FEMA Id: 3113, Natural disaster type: Fire
- Texas SEVERE STORMS, TORNADOES, FLOODING, Incident Period: May 04, 1989 to June 07, 1989, Major Disaster (Presidential) Declared DR-828: May 19, 1989, FEMA Id: 828, Natural disaster type: Storm, Tornado, Flood
- 1 other natural disasters have been reported since 1953.
The number of natural disasters in Rockwall County (11) is smaller than the US average (15).
Major Disasters (Presidential) Declared: 4
Emergencies Declared: 6
Causes of natural disasters: Fires: 3, Floods: 3, Hurricanes: 3, Storms: 2, Tornadoes: 2, Wind: 1, Winter Storm: 1, Other: 2 (Note: some incidents may be assigned to more than one category).
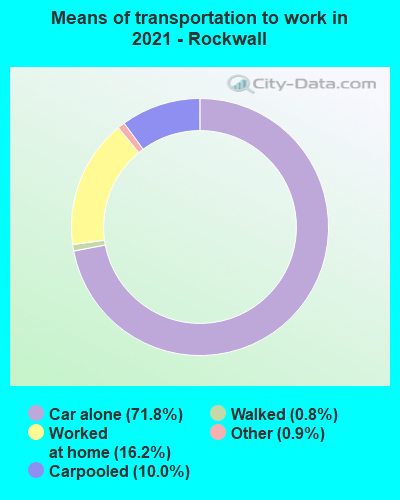
Means of transportation to work:
- Drove a car alone: 29,430 (65.3%)
- Carpooled: 4,513 (10.0%)
- Bus: 16 (0.0%)
- Long-distance train or commuter rail: 52 (0.1%)
- Taxicab, motorcycle, or other means: 546 (1.2%)
- Bicycle: 29 (0.1%)
- Walked: 409 (0.9%)
- Worked at home: 11,470 (25.4%)
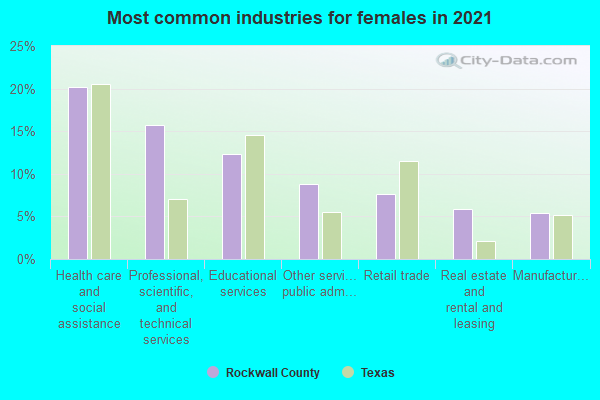
- Health care and social assistance (16%)
- Educational services (14%)
- Professional, scientific, and technical services (11%)
- Retail trade (9%)
- Finance and insurance (8%)
- Manufacturing (7%)
- Other services, except public administration (6%)
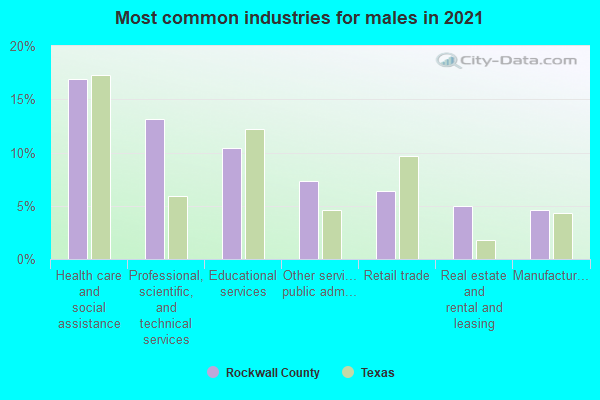
- Health care and social assistance (17%)
- Educational services (15%)
- Professional, scientific, and technical services (13%)
- Retail trade (10%)
- Finance and insurance (9%)
- Manufacturing (8%)
- Other services, except public administration (7%)
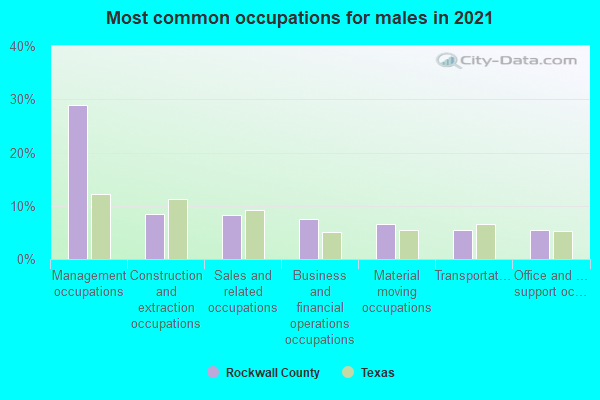
- Management occupations (19%)
- Sales and related occupations (12%)
- Business and financial operations occupations (8%)
- Construction and extraction occupations (7%)
- Architecture and engineering occupations (6%)
- Computer and mathematical occupations (5%)
- Transportation occupations (5%)
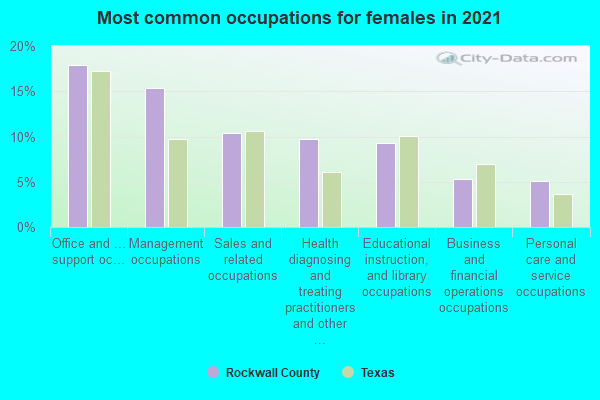
- Office and administrative support occupations (18%)
- Educational instruction, and library occupations (11%)
- Management occupations (11%)
- Business and financial operations occupations (11%)
- Sales and related occupations (9%)
- Health diagnosing and treating practitioners and other technical occupations (8%)
- Healthcare support occupations (5%)
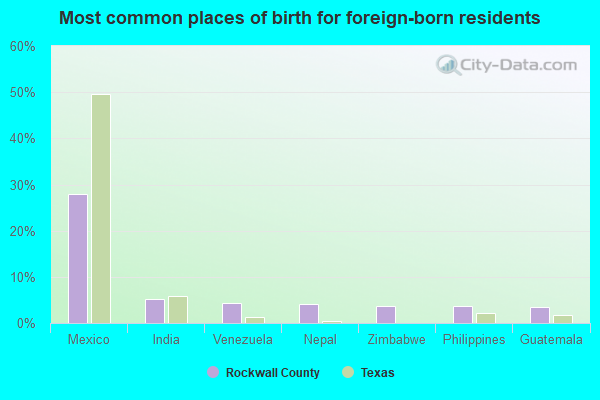
- Mexico (23%)
- India (7%)
- Venezuela (6%)
- Vietnam (4%)
- Canada (4%)
- Philippines (4%)
- Korea (4%)
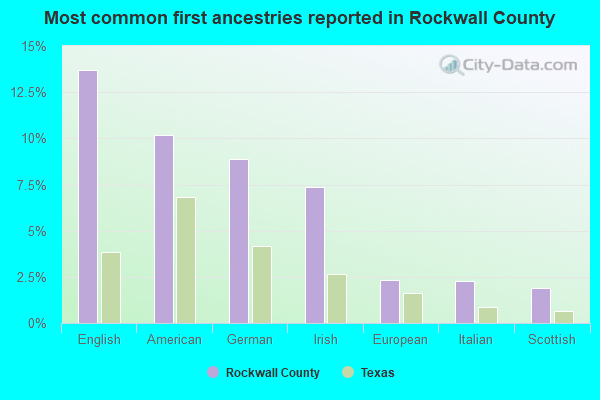
- English (15%)
- American (9%)
- German (8%)
- Irish (8%)
- European (2%)
- Scottish (2%)
- Italian (2%)
167 people in local jails and other municipal confinement facilities
People in group quarters in Rockwall County, Texas in 2000:
- 512 people in nursing homes
- 76 people in local jails and other confinement facilities (including police lockups)
- 10 people in unknown juvenile institutions
- 10 people in homes for the mentally retarded
- 9 people in other nonhousehold living situations
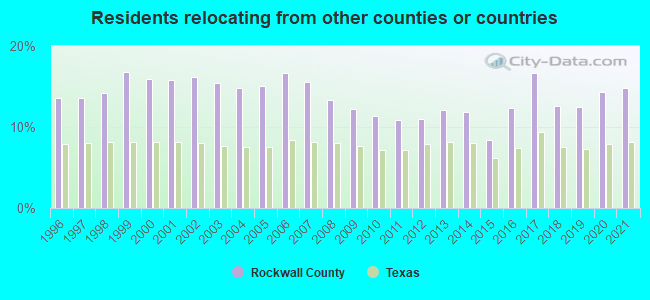
14.79% of this county's 2021 resident taxpayers lived in other counties in 2020 ($98,661 average adjusted gross income)
| Here: | 14.79% |
| Texas average: | 8.12% |
10 or fewer of this county's residents moved from foreign countries.
11.29% relocated from other counties in Texas ($61,830 average AGI)
3.50% relocated from other states ($36,831 average AGI)
Rockwall County: 3.50% Texas average: 2.83%
Top counties from which taxpayers relocated into this county between 2020 and 2021:
| from Dallas County, TX | |
| from Collin County, TX | |
| from Kaufman County, TX | |
| from Hunt County, TX | |
| from Denton County, TX | |
| from Tarrant County, TX | |
| from Los Angeles County, CA |
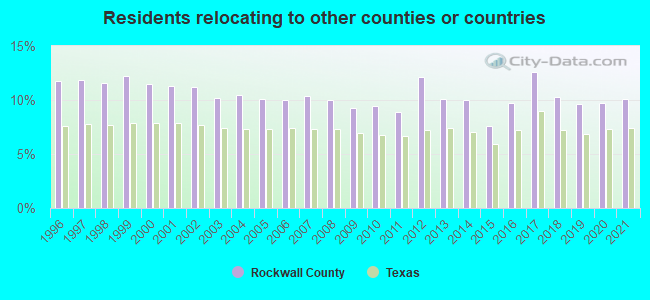
10.13% of this county's 2020 resident taxpayers moved to other counties in 2021 ($89,792 average adjusted gross income)
| Here: | 10.13% |
| Texas average: | 7.40% |
10 or fewer of this county's residents moved to foreign countries.
8.08% relocated to other counties in Texas ($71,000 average AGI)
2.05% relocated to other states ($18,791 average AGI)
Rockwall County: 2.05% Texas average: 2.08%
Top counties to which taxpayers relocated from this county between 2020 and 2021:
| to Dallas County, TX | |
| to Collin County, TX | |
| to Hunt County, TX | |
| to Kaufman County, TX | |
| to Tarrant County, TX | |
| to Denton County, TX | |
| to Harris County, TX |
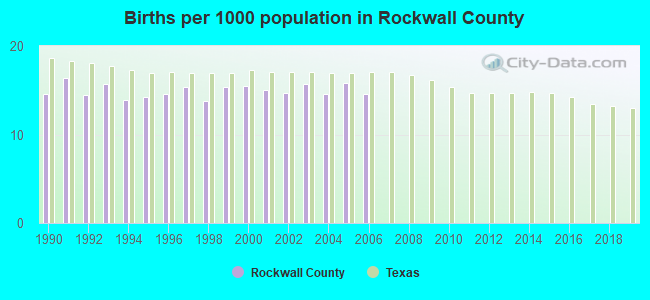
Births per 1000 population from 1990 to 1999: 14.9
Births per 1000 population from 2000 to 2006: 15.1
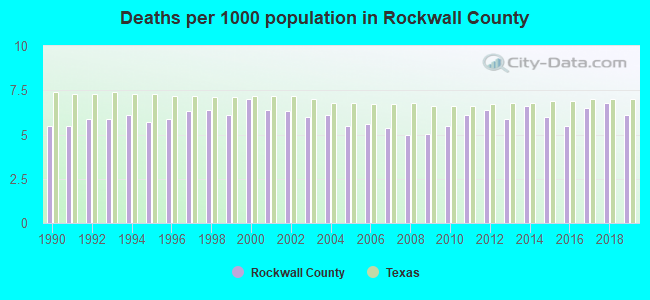
Deaths per 1000 population from 1990 to 1999: 5.9
Deaths per 1000 population from 2000 to 2009: 5.8
Deaths per 1000 population from 2010 to 2020: 6.2
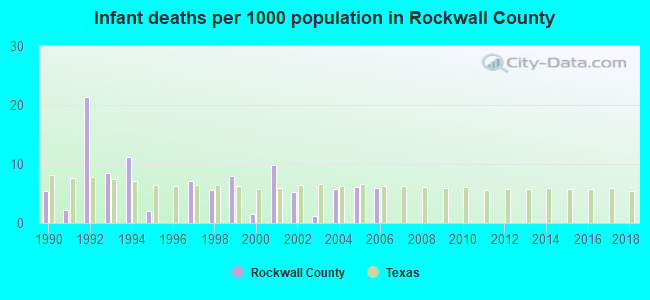
Infant deaths per 1000 live births from 1990 to 1999: 7.1
Infant deaths per 1000 live births from 2000 to 2006: 5.1
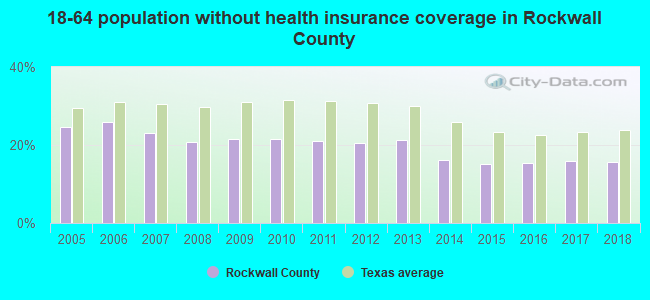
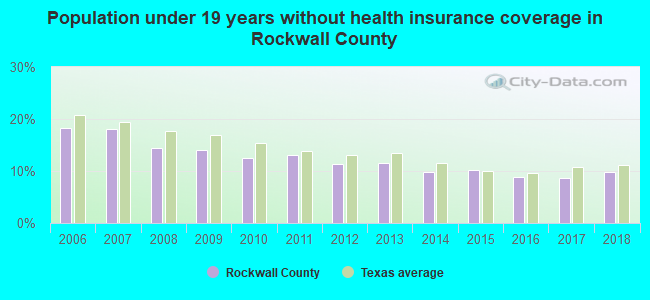
Persons under 19 years old without health insurance coverage in 2018: 9.9%
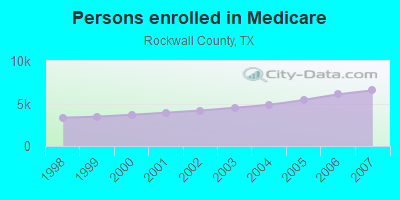
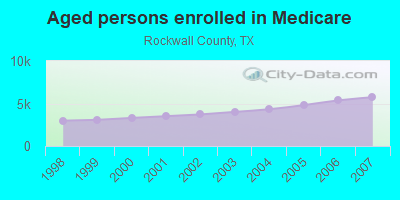
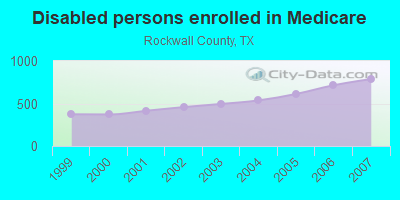
Persons enrolled in hospital insurance and/or supplemental medical insurance (Medicare) in July 1, 2007: 6,531 (5,743 aged, 788 disabled)
Children under 18 without health insurance coverage in 2007: 3,887 (17%)
Most common underlying causes of death in Rockwall County, Texas in 1999 - 2019:
- Acute myocardial infarction, unspecified (717)
- Bronchus or lung, unspecified - Malignant neoplasms (525)
- Atherosclerotic heart disease (504)
- Chronic obstructive pulmonary disease, unspecified (408)
- Alzheimer disease, unspecified (325)
- Unspecified dementia (300)
- Pneumonia, unspecified (212)
- Congestive heart failure (157)
- Stroke, not specified as haemorrhage or infarction (157)
- Atherosclerotic cardiovascular disease, so described (142)
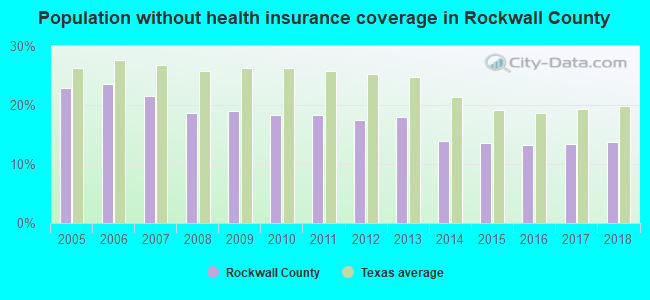
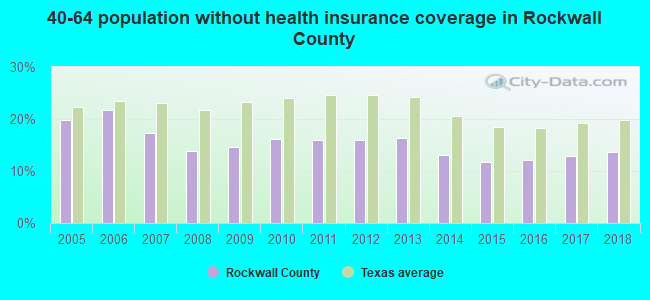
Population without health insurance coverage in 2000: 13%
Children under 18 without health insurance coverage in 2000: 14%
Medical specialist MDs per 100,000 population in 2005: 604
Dentists per 100,000 population in 1998: 3
Total births per 100,000 population, July 2005 - July 2006 : 48
Total deaths per 100,000 population, July 2005 - July 2006: 75
Limited-service eating places per 100,000 population in 2005 : 13
Beer, wine & liquor stores per 100,000 population in 2005: 1
Suicides per 1,000,000 population from 2000 to 2006: 124.9. This is more than state average.
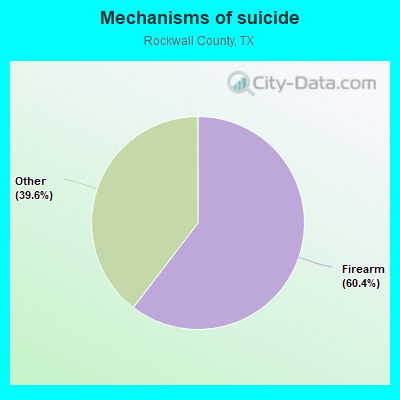
- Firearm - 75.4
- Other - 49.4
Household type by relationship:
Households: 123,208- Male householders: 21,878 (2,818 living alone), Female householders: 20,078 (3,724 living alone)
29,330 spouses (28,992 opposite-sex spouses), 2,381 unmarried partners, (2,368 opposite-sex unmarried partners), 41,167 children (38,156 natural, 1,084 adopted, 1,927 stepchildren), 1,829 grandchildren, 395 brothers or sisters, 2,121 parents, 83 foster children, 1,404 other relatives, 1,844 non-relatives
- In group quarters: 698
Size of family households: 11,310 2-persons, 7,038 3-persons, 8,339 4-persons, 4,149 5-persons, 1,237 6-persons, 914 7-or-more-persons.
Size of nonfamily households: 6,542 1-person, 2,427 2-persons.
27,021 married couples with children.
3,123 single-parent households (860 men, 2,263 women).
85.4% of residents of Rockwall speak English at home.
10.4% of residents speak Spanish at home (72% speak English very well, 19% speak English well, 8% speak English not well, 2% don't speak English at all).
1.9% of residents speak other Indo-European language at home (71% speak English very well, 21% speak English well, 8% speak English not well).
1.7% of residents speak Asian or Pacific Island language at home (75% speak English very well, 17% speak English well, 5% speak English not well, 3% don't speak English at all).
0.6% of residents speak other language at home (84% speak English very well, 16% speak English well).
In fiscal year 2004:
Federal Government expenditure: $206,676,000 ($3,547 per capita)
Department of Defense expenditure: $53,172,000
Federal direct payments to individuals for retirement and disability: $87,193,000
Federal other direct payments to individuals: $25,048,000
Federal direct payments not to individuals: $786,000
Federal grants: $35,674,000
Federal procurement contracts: $51,161,000 ($44,723,000 Department of Defense)
Federal salaries and wages: $6,815,000 ($0,000 Department of Defense)
Federal Government direct loans: $1,653,000
Federal guaranteed/insured loans: $97,554,000
Federal Government insurance: $25,363,000
Population change from April 1, 2000 to July 1, 2005:
Births: 4,081| Here: | 65 per 1000 residents |
| State: | 85 per 1000 residents |
Deaths: 1,659
| Here: | 26 per 1000 residents |
| State: | 35 per 1000 residents |
Net international migration: +545
| Here: | +9 per 1000 residents |
| State: | +29 per 1000 residents |
Net internal migration: +17,074
| Here: | +271 per 1000 residents |
| State: | +10 per 1000 residents |
Total withdrawal of fresh water for public supply: 0.00 millions of gallons per day (all from surface)
| Here: | 7.5 |
| State: | 6.3 |
| Here: | 4.9 |
| State: | 4.0 |
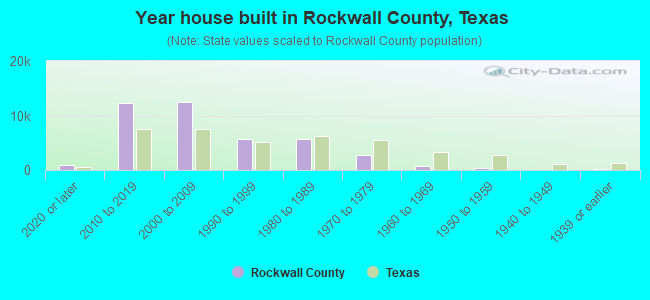
- Year house built in Rockwall County, Texas
- 4,5652020 or later
- 13,7492010 to 2019
- 11,5872000 to 2009
- 6,6771990 to 1999
- 4,8271980 to 1989
- 2,1041970 to 1979
- 2891960 to 1969
- 1751950 to 1959
- 471940 to 1949
- 1301939 or earlier
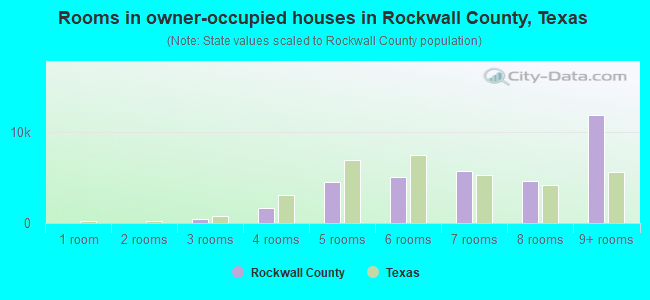
- Rooms in owner-occupied houses in Rockwall County, Texas
- 901 room
- 02 rooms
- 1293 rooms
- 1,7344 rooms
- 3,8305 rooms
- 5,4156 rooms
- 5,9437 rooms
- 5,5008 rooms
- 12,1599+ rooms
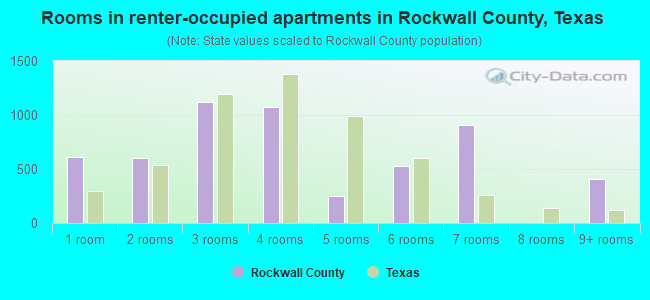
- Rooms in renter-occupied apartments in Rockwall County, Texas
- 681 room
- 2832 rooms
- 9363 rooms
- 1,9494 rooms
- 9125 rooms
- 6676 rooms
- 1,1287 rooms
- 4238 rooms
- 7909+ rooms
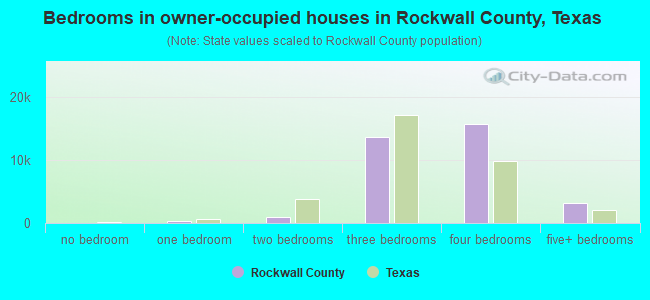
- Bedrooms in owner-occupied houses in Rockwall County, Texas
- 90no bedroom
- 1951 bedroom
- 1,0492 bedrooms
- 12,9563 bedrooms
- 15,1694 bedrooms
- 5,3415+ bedrooms

- Bedrooms in renter-occupied apartments in Rockwall County, Texas
- 68no bedroom
- 1,3171 bedroom
- 1,6162 bedrooms
- 2,7053 bedrooms
- 1,2614 bedrooms
- 1895+ bedrooms
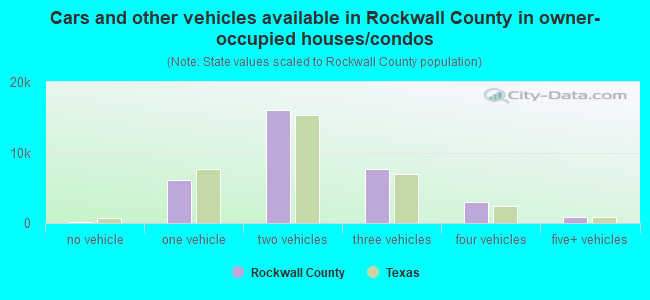
- Cars and other vehicles available in Rockwall County in owner-occupied houses/condos
- 912no vehicle
- 4,6851 vehicle
- 15,7552 vehicles
- 8,4383 vehicles
- 3,2824 vehicles
- 1,7285+ vehicles
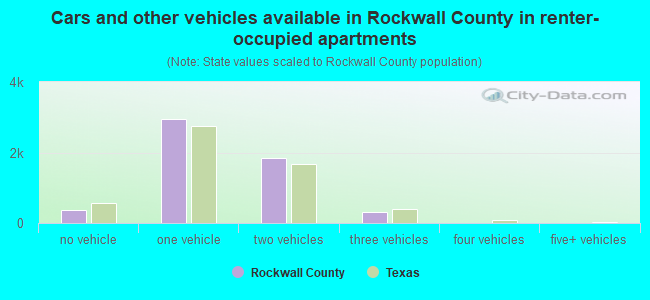
- Cars and other vehicles available in Rockwall County in renter-occupied apartments
- 485no vehicle
- 1,7731 vehicle
- 3,3992 vehicles
- 1,0943 vehicles
- 3204 vehicles
- 855+ vehicles
88.6% of Rockwall County residents lived in the same house 1 years ago.
Out of people who lived in different houses, 16% lived in this county.
Out of people who lived in different counties, 69% lived in Texas.
| Rockwall County: | 88.6% |
| State average: | 85.7% |
Place of birth for U.S.-born residents:
- This state: 69,806
- Other state: 40,062
- Northeast: 3,550
- Midwest: 13,057
- South: 11,972
- West: 11,483
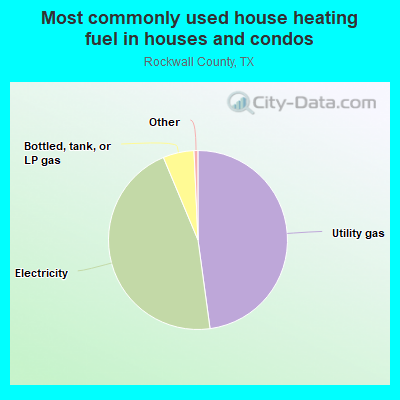
- 46.9%Utility gas
- 45.8%Electricity
- 6.3%Bottled, tank, or LP gas
- 0.4%Wood
- 0.2%No fuel used
- 0.2%Solar energy
- 0.1%Other fuel
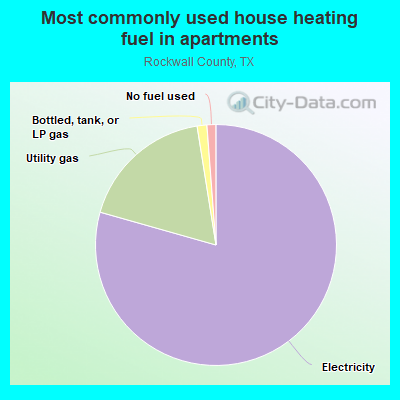
- 76.7%Electricity
- 20.9%Utility gas
- 1.3%No fuel used
- 1.1%Bottled, tank, or LP gas
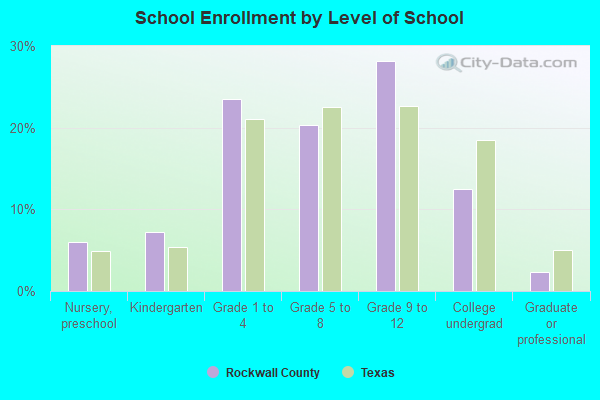
Private vs. public school enrollment:
| Here: | 13.6% |
| Texas: | 8.8% |
| Here: | 5.8% |
| Texas: | 8.0% |
| Here: | 24.4% |
| Texas: | 16.2% |
Rockwall County government finances - Expenditure in 2017:
- Bond Funds - Cash and Securities: $13,438,000
- Charges - Other: $2,591,000
Regular Highways: $1,344,000
- Construction - Regular Highways: $12,383,000
General - Other: $372,000
- Current Operations - Judicial and Legal Services: $6,670,000
Correctional Institutions: $6,065,000
Police Protection: $5,633,000
General - Other: $3,629,000
Financial Administration: $1,986,000
Regular Highways: $1,648,000
Central Staff Services: $1,642,000
Libraries: $1,204,000
Health - Other: $636,000
General Public Buildings: $573,000
Public Welfare - Other: $382,000
Public Welfare, Vendor Payments for Medical Care: $201,000
Natural Resources - Other: $101,000
Protective Inspection and Regulation - Other: $5,000
- Federal Intergovernmental - Other: $55,000
- General - Interest on Debt: $3,978,000
- Long Term Debt - Outstanding Unspecified Public Purpose: $110,610,000
Beginning Outstanding - Unspecified Public Purpose: $100,450,000
Issue, Unspecified Public Purpose: $21,380,000
Retired Unspecified Public Purpose: $11,220,000
- Miscellaneous - Fines and Forfeits: $1,135,000
Interest Earnings: $297,000
General Revenue - Other: $144,000
Sale of Property: $38,000
- Other Capital Outlay - General - Other: $3,561,000
Regular Highways: $162,000
Central Staff Services: $25,000
Libraries: $8,000
- Other Funds - Cash and Securities: $25,482,000
- Sinking Funds - Cash and Securities: $903,000
- State Intergovernmental - Highways: $1,144,000
Other: $977,000
General Local Government Support: $332,000
- Tax - Property: $33,323,000
General Sales and Gross Receipts: $1,511,000
Motor Vehicle License: $238,000
Rockwall County government finances - Revenue in 2017:
- Bond Funds - Cash and Securities: $13,438,000
- Charges - Other: $2,591,000
Regular Highways: $1,344,000
- Construction - Regular Highways: $12,383,000
General - Other: $372,000
- Current Operations - Judicial and Legal Services: $6,670,000
Correctional Institutions: $6,065,000
Police Protection: $5,633,000
General - Other: $3,629,000
Financial Administration: $1,986,000
Regular Highways: $1,648,000
Central Staff Services: $1,642,000
Libraries: $1,204,000
Health - Other: $636,000
General Public Buildings: $573,000
Public Welfare - Other: $382,000
Public Welfare, Vendor Payments for Medical Care: $201,000
Natural Resources - Other: $101,000
Protective Inspection and Regulation - Other: $5,000
- Federal Intergovernmental - Other: $55,000
- General - Interest on Debt: $3,978,000
- Long Term Debt - Outstanding Unspecified Public Purpose: $110,610,000
Beginning Outstanding - Unspecified Public Purpose: $100,450,000
Issue, Unspecified Public Purpose: $21,380,000
Retired Unspecified Public Purpose: $11,220,000
- Miscellaneous - Fines and Forfeits: $1,135,000
Interest Earnings: $297,000
General Revenue - Other: $144,000
Sale of Property: $38,000
- Other Capital Outlay - General - Other: $3,561,000
Regular Highways: $162,000
Central Staff Services: $25,000
Libraries: $8,000
- Other Funds - Cash and Securities: $25,482,000
- Sinking Funds - Cash and Securities: $903,000
- State Intergovernmental - Highways: $1,144,000
Other: $977,000
General Local Government Support: $332,000
- Tax - Property: $33,323,000
General Sales and Gross Receipts: $1,511,000
Motor Vehicle License: $238,000
Rockwall County government finances - Debt in 2017:
- Bond Funds - Cash and Securities: $13,438,000
- Charges - Other: $2,591,000
Regular Highways: $1,344,000
- Construction - Regular Highways: $12,383,000
General - Other: $372,000
- Current Operations - Judicial and Legal Services: $6,670,000
Correctional Institutions: $6,065,000
Police Protection: $5,633,000
General - Other: $3,629,000
Financial Administration: $1,986,000
Regular Highways: $1,648,000
Central Staff Services: $1,642,000
Libraries: $1,204,000
Health - Other: $636,000
General Public Buildings: $573,000
Public Welfare - Other: $382,000
Public Welfare, Vendor Payments for Medical Care: $201,000
Natural Resources - Other: $101,000
Protective Inspection and Regulation - Other: $5,000
- Federal Intergovernmental - Other: $55,000
- General - Interest on Debt: $3,978,000
- Long Term Debt - Outstanding Unspecified Public Purpose: $110,610,000
Beginning Outstanding - Unspecified Public Purpose: $100,450,000
Issue, Unspecified Public Purpose: $21,380,000
Retired Unspecified Public Purpose: $11,220,000
- Miscellaneous - Fines and Forfeits: $1,135,000
Interest Earnings: $297,000
General Revenue - Other: $144,000
Sale of Property: $38,000
- Other Capital Outlay - General - Other: $3,561,000
Regular Highways: $162,000
Central Staff Services: $25,000
Libraries: $8,000
- Other Funds - Cash and Securities: $25,482,000
- Sinking Funds - Cash and Securities: $903,000
- State Intergovernmental - Highways: $1,144,000
Other: $977,000
General Local Government Support: $332,000
- Tax - Property: $33,323,000
General Sales and Gross Receipts: $1,511,000
Motor Vehicle License: $238,000
Rockwall County government finances - Cash and Securities in 2017:
- Bond Funds - Cash and Securities: $13,438,000
- Charges - Other: $2,591,000
Regular Highways: $1,344,000
- Construction - Regular Highways: $12,383,000
General - Other: $372,000
- Current Operations - Judicial and Legal Services: $6,670,000
Correctional Institutions: $6,065,000
Police Protection: $5,633,000
General - Other: $3,629,000
Financial Administration: $1,986,000
Regular Highways: $1,648,000
Central Staff Services: $1,642,000
Libraries: $1,204,000
Health - Other: $636,000
General Public Buildings: $573,000
Public Welfare - Other: $382,000
Public Welfare, Vendor Payments for Medical Care: $201,000
Natural Resources - Other: $101,000
Protective Inspection and Regulation - Other: $5,000
- Federal Intergovernmental - Other: $55,000
- General - Interest on Debt: $3,978,000
- Long Term Debt - Outstanding Unspecified Public Purpose: $110,610,000
Beginning Outstanding - Unspecified Public Purpose: $100,450,000
Issue, Unspecified Public Purpose: $21,380,000
Retired Unspecified Public Purpose: $11,220,000
- Miscellaneous - Fines and Forfeits: $1,135,000
Interest Earnings: $297,000
General Revenue - Other: $144,000
Sale of Property: $38,000
- Other Capital Outlay - General - Other: $3,561,000
Regular Highways: $162,000
Central Staff Services: $25,000
Libraries: $8,000
- Other Funds - Cash and Securities: $25,482,000
- Sinking Funds - Cash and Securities: $903,000
- State Intergovernmental - Highways: $1,144,000
Other: $977,000
General Local Government Support: $332,000
- Tax - Property: $33,323,000
General Sales and Gross Receipts: $1,511,000
Motor Vehicle License: $238,000
Supplemental Security Income (SSI) in 2006:
- Total number of recipients: 515
- Number of aged recipients: 93
- Number of blind and disabled recipients: 422
- Number of recipients under 18: 117
- Number of recipients between 18 and 64: 264
- Number of recipients older than 64: 134
- Number of recipients also receiving OASDI: 167
- Amount of payments (thousands of dollars): 205
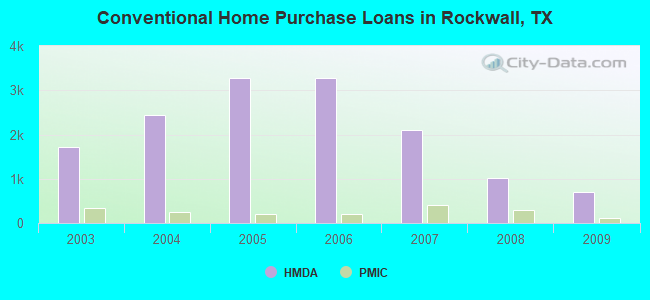
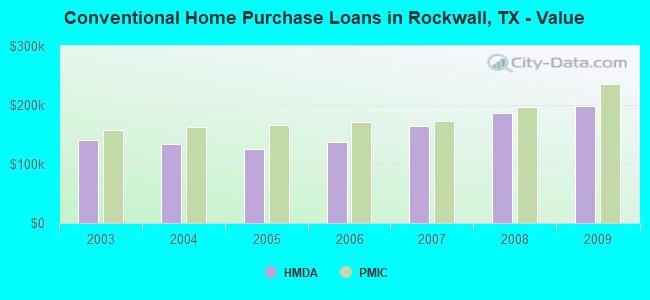
| Home Mortgage Disclosure Act Aggregated Statistics For Year 2009 (Based on 7 full tracts) | ||||||||||||
| A) FHA, FSA/RHS & VA Home Purchase Loans | B) Conventional Home Purchase Loans | C) Refinancings | D) Home Improvement Loans | F) Non-occupant Loans on < 5 Family Dwellings (A B C & D) | G) Loans On Manufactured Home Dwelling (A B C & D) | |||||||
|---|---|---|---|---|---|---|---|---|---|---|---|---|
| Number | Average Value | Number | Average Value | Number | Average Value | Number | Average Value | Number | Average Value | Number | Average Value | |
| LOANS ORIGINATED | 695 | $167,553 | 708 | $198,936 | 1,652 | $190,436 | 79 | $69,759 | 102 | $153,912 | 8 | $36,125 |
| APPLICATIONS APPROVED, NOT ACCEPTED | 30 | $172,967 | 65 | $187,108 | 164 | $190,213 | 19 | $38,263 | 12 | $119,500 | 8 | $55,375 |
| APPLICATIONS DENIED | 82 | $169,439 | 125 | $190,344 | 642 | $189,249 | 92 | $37,707 | 40 | $133,200 | 21 | $44,143 |
| APPLICATIONS WITHDRAWN | 80 | $181,050 | 115 | $214,852 | 405 | $193,736 | 15 | $73,000 | 19 | $144,421 | 0 | $0 |
| FILES CLOSED FOR INCOMPLETENESS | 14 | $151,571 | 21 | $218,762 | 120 | $193,167 | 11 | $89,000 | 5 | $135,000 | 0 | $0 |
| Private Mortgage Insurance Companies Aggregated Statistics For Year 2009 (Based on 7 full tracts) | ||||||
| A) Conventional Home Purchase Loans | B) Refinancings | C) Non-occupant Loans on < 5 Family Dwellings (A & B) | ||||
|---|---|---|---|---|---|---|
| Number | Average Value | Number | Average Value | Number | Average Value | |
| LOANS ORIGINATED | 104 | $236,250 | 95 | $207,611 | 1 | $97,000 |
| APPLICATIONS APPROVED, NOT ACCEPTED | 37 | $205,405 | 32 | $240,406 | 0 | $0 |
| APPLICATIONS DENIED | 17 | $270,412 | 13 | $223,077 | 1 | $123,000 |
| APPLICATIONS WITHDRAWN | 8 | $281,625 | 7 | $255,714 | 0 | $0 |
| FILES CLOSED FOR INCOMPLETENESS | 3 | $285,000 | 1 | $134,000 | 1 | $288,000 |
| Most common first names in Rockwall County, TX among deceased individuals | ||
| Name | Count | Lived (average) |
|---|---|---|
| Mary | 140 | 81.8 years |
| James | 123 | 73.6 years |
| John | 103 | 74.5 years |
| William | 101 | 77.2 years |
| Robert | 82 | 72.0 years |
| George | 48 | 78.2 years |
| Charles | 46 | 73.4 years |
| Helen | 39 | 79.7 years |
| Thomas | 38 | 73.8 years |
| Richard | 38 | 74.3 years |
| Most common last names in Rockwall County, TX among deceased individuals | ||
| Last name | Count | Lived (average) |
|---|---|---|
| Smith | 67 | 77.2 years |
| Williams | 51 | 77.6 years |
| Jones | 48 | 78.4 years |
| Brown | 47 | 80.4 years |
| Davis | 37 | 79.9 years |
| Johnson | 29 | 81.3 years |
| Taylor | 27 | 75.8 years |
| White | 26 | 74.3 years |
| Anderson | 24 | 80.1 years |
| Miller | 23 | 80.6 years |