Hunt County, Texas (TX)
County owner-occupied free and clear houses and condos in 2010: 9,456
County owner-occupied houses and condos in 2000: 20,532
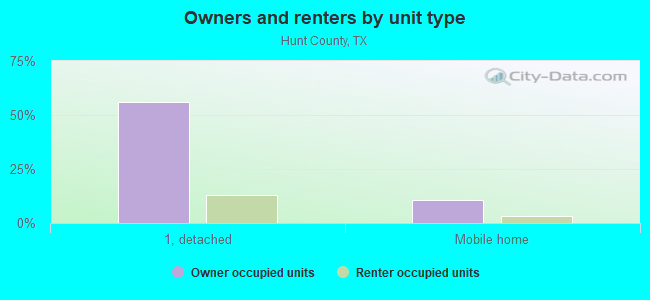
Renter-occupied apartments: 9,813 (it was 8,210 in 2000)
| % of renters here: | 29% |
| State: | 36% |
Land area: 841 sq. mi.
Water area: 40.9 sq. mi.
Population density: 129 people per square mile (average).
Industries providing employment: Educational, health and social services (20.6%), Manufacturing (13.2%), Retail trade (12.0%), Professional, scientific, management, administrative, and waste management services (11.7%).
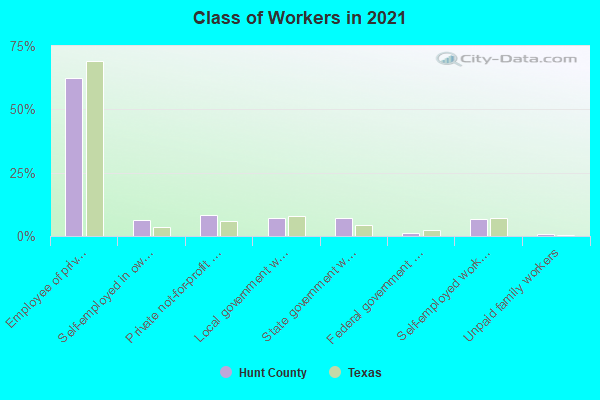
Type of workers:
- Private wage or salary: 78%
- Government: 15%
- Self-employed, not incorporated: 7%
- Unpaid family work: 0%
- OSM Map
- General Map
- Google Map
- MSN Map

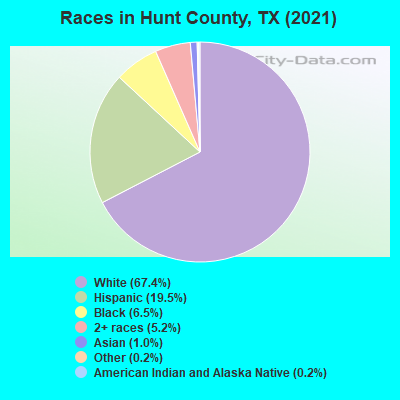
- 71,32465.9%White Non-Hispanic Alone
- 21,87020.2%Hispanic or Latino
- 8,5527.9%Black Non-Hispanic Alone
- 5,0294.6%Two or more races
- 1,1541.1%Asian alone
- 2180.2%American Indian and Alaska Native alone
- 920.08%Some other race alone
- 430.04%Native Hawaiian and Other
Pacific Islander alone
| Median resident age: | 37.2 years |
| Texas median age: | 35.6 years |
| Males: 53,346 | |
| Females: 54,936 |

 | Hunt County Appraisal Board question (1 reply) |
| When will Sherman/Denison Be In DFW Metro? (66 replies) |
| The DFW housing market is NOT sustainable (685 replies) |
| FACT: Texas is 30 years behind California (71 replies) |
| Power Grid (52 replies) |
| How much bigger will DFW population be? (57 replies) |
| Hunt County: | 2.0 people |
| Texas: | 3 people |
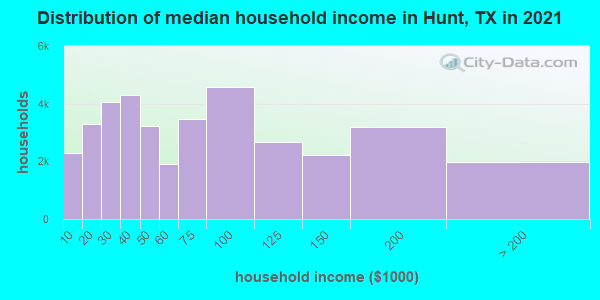
Estimated median household income in 2022: $69,253 ($36,752 in 1999)
| This county: | $69,253 |
| Texas: | $72,284 |
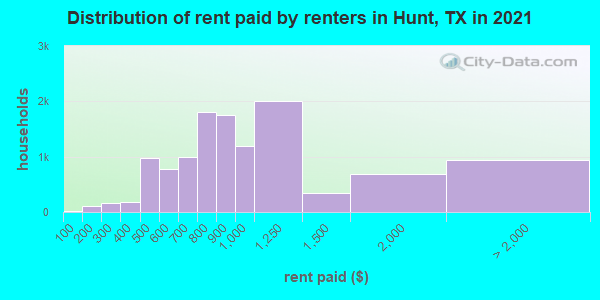
Median contract rent in 2022 for apartments: $1,023 (lower quartile is $727, upper quartile is $1,214)
| This county: | $1023 |
| State: | $1117 |
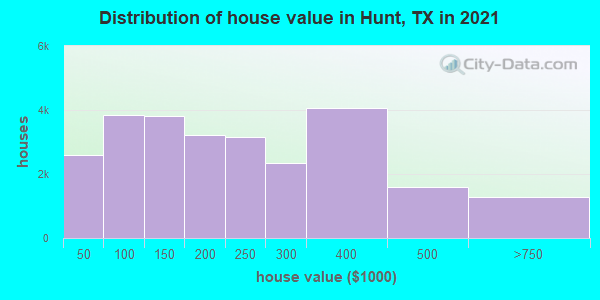
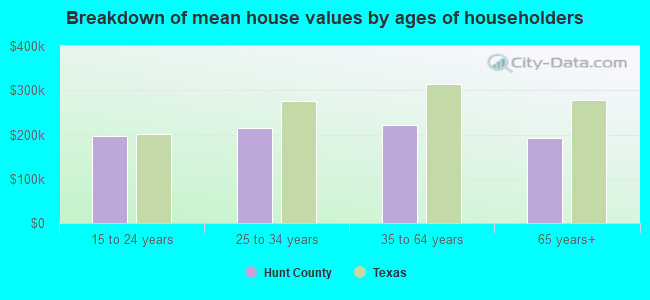
Estimated median house or condo value in 2022: $258,000 (it was $61,300 in 2000)
| Hunt: | $258,000 |
| Texas: | $275,400 |
Median monthly housing costs for homes and condos with a mortgage: $1,693
Median monthly housing costs for units without a mortgage: $537
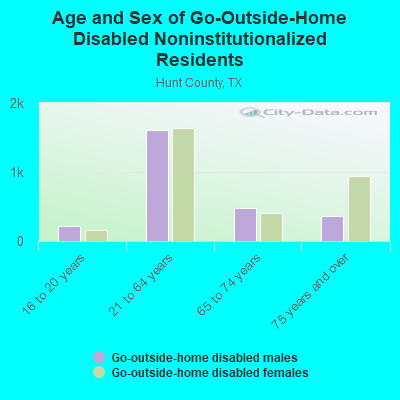
Institutionalized population: 700
Crime in 2021 (reported by the sheriff's office or county police, not the county total):
- Murders: 1
- Rapes: 24
- Robberies: 18
- Assaults: 367
- Burglaries: 134
- Thefts: 343
- Auto thefts: 131
Crime in 2020 (reported by the sheriff's office or county police, not the county total):
- Murders: 1
- Rapes: 26
- Robberies: 6
- Assaults: 303
- Burglaries: 104
- Thefts: 275
- Auto thefts: 115
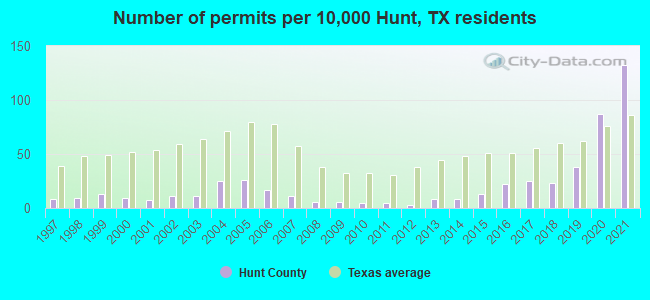
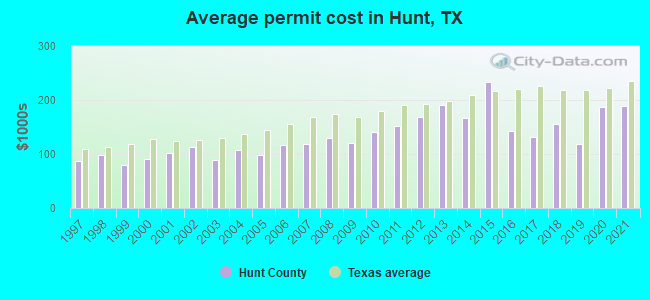
Single-family new house construction building permits:
- 2022: 696 buildings, average cost: $197,200
- 2021: 1011 buildings, average cost: $187,700
- 2020: 670 buildings, average cost: $186,600
- 2019: 290 buildings, average cost: $117,900
- 2018: 173 buildings, average cost: $154,700
- 2017: 190 buildings, average cost: $130,800
- 2016: 166 buildings, average cost: $142,300
- 2015: 102 buildings, average cost: $233,200
- 2014: 63 buildings, average cost: $166,600
- 2013: 61 buildings, average cost: $191,300
- 2012: 26 buildings, average cost: $169,300
- 2011: 35 buildings, average cost: $150,500
- 2010: 37 buildings, average cost: $141,000
- 2009: 46 buildings, average cost: $119,700
- 2008: 44 buildings, average cost: $130,100
- 2007: 83 buildings, average cost: $118,500
- 2006: 127 buildings, average cost: $116,400
- 2005: 197 buildings, average cost: $99,000
- 2004: 191 buildings, average cost: $106,600
- 2003: 84 buildings, average cost: $87,600
- 2002: 85 buildings, average cost: $113,400
- 2001: 57 buildings, average cost: $102,400
- 2000: 67 buildings, average cost: $89,900
- 1999: 97 buildings, average cost: $79,800
- 1998: 71 buildings, average cost: $98,400
- 1997: 59 buildings, average cost: $87,300
Median real estate property taxes paid for housing units with mortgages in 2022: $3,883 (1.3%)
Median real estate property taxes paid for housing units with no mortgage in 2022: $1,865 (1.0%)
| Hunt County: | 12.8% |
| Texas: | 14.0% |
Median age of residents in 2022: 37.2 years old
(Males: 37.7 years old, Females: 37.0 years old)
(Median age for: White residents: 42.9 years old, Black residents: 36.4 years old, American Indian residents: 44.0 years old, Asian residents: 27.0 years old, Hispanic or Latino residents: 24.9 years old, Other race residents: 29.3 years old)
Area name: Dallas, TX HUD Metro FMR Area
Fair market rent in 2006 for a 1-bedroom apartment in Hunt County is $607 a month.
Fair market rent for a 2-bedroom apartment is $733 a month.
Fair market rent for a 3-bedroom apartment is $954 a month.
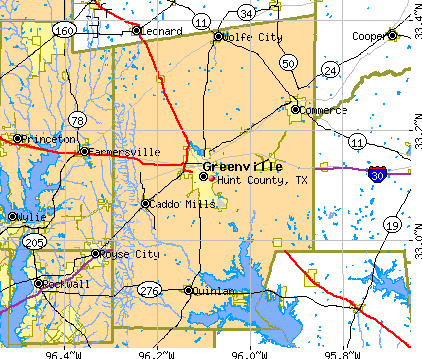
Cities in this county include: Greenville, Commerce, Wolfe City, West Tawakoni, Quinlan, Caddo Mills, Celeste, Campbell, Lone Oak, Hawk Cove.
2023 air pollution in Hunt County:
Nitrogen Dioxide: 0.00 ppm (standard limit: 0.053 ppm). Below U.S. average.
Ozone (1-hour): 0.029 ppm (standard limit: 0.12 ppm). Below U.S. average.
Notable locations in this county outside city limits:
Notable locations in Hunt County: City of Blue Ridge Wastewater Treatment Plant (A), City of Celina Wastewater Treatment Plant (B), Seis Lagos Wastewater Treatment Plant (C), Slayer Creek Wastewater Treatment Plant (D), Wilson Creek Regional Wastewater Treatment Plant (E), Lavon Lake Encampment (F), Branch (G), Branch Fire Department (H), Prosper Fire Department (I). Display/hide their locations on the map
Churches in Hunt County include: Verona Church (A), Walnut Grove Church (B), Cottage Hill Church (C), Stony Point Church (D), Rosamond Church (E), Snow Hill Church (F), Dunn Memorial Church (G), Henslee Chapel (H), White Rock Church (I). Display/hide their locations on the map
Cemeteries: Van Winkle Cemetery (1), Crossroads Cemetery (2), Ware Cemetery (3), Baker Cemetery (4), Backbone Cemetery (5), Richard Cemetery (6), Bear Creek Cemetery (7). Display/hide their locations on the map
Lakes and reservoirs: Wilson Lake (A), Bell Lake (B), Reed Lake (C), Boyd Lake (D), Lewis Lake (E), Pierce Pond (F), Sands Lake (G), Moores Lake (H). Display/hide their locations on the map
Streams, rivers, and creeks: Brinlee Branch (A), Arnold Creek (B), Tom Bean Creek (C), Ticky Creek (D), Price Creek (E), Hatler Branch (F), Walnut Fork (G), Wilson Creek (H), Stover Creek (I). Display/hide their locations on the map
Parks in Hunt County include: Highland Park (1), Ticky Creek Park (2), Mallard Park (3), Twin Groves Park (4), Pebble Beach Park (5), Little Ridge Park (6), Lakeland Park (7), J W Spain Athletic Complex (8), Elm Creek Park (9). Display/hide their locations on the map
Neighboring counties: Imperial County, California  , Williamsburg County, South Carolina
  , Nevada County, Arkansas
  , Dallas County
  , Heard County, Georgia , Tarrant County .
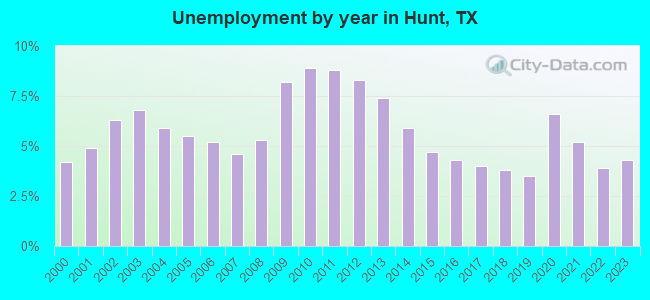
| Here: | 3.6% |
| Texas: | 3.5% |
Current college students: 4,348
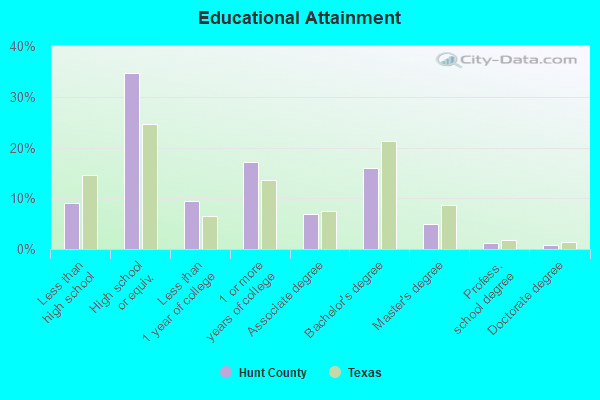
People 25 years of age or older with a high school degree or higher: 89.8%
People 25 years of age or older with a bachelor's degree or higher: 21.4%
Number of foreign born residents: 6,792 (33.2% naturalized citizens)
| Hunt County: | 6.3% |
| Whole state: | 17.2% |
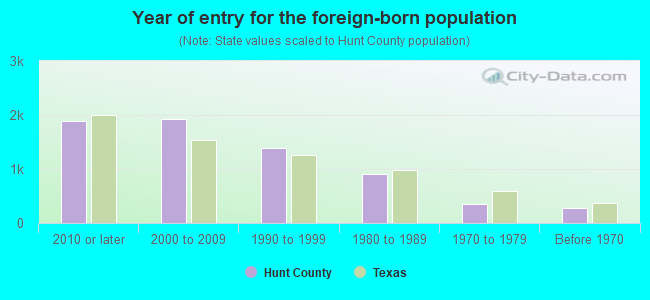
- Year of entry for the foreign-born population
- 1,9012010 or later
- 1,9332000 to 2009
- 1,5011990 to 1999
- 9121980 to 1989
- 3511970 to 1979
- 287Before 1970
Mean travel time to work (commute): minutes
Percentage of county residents living and working in this county: 99.2%
Housing units in structures:
- One, detached: 28,833
- One, attached: 780
- Two: 641
- 3 or 4: 882
- 5 to 9: 1,716
- 10 to 19: 879
- 20 to 49: 620
- 50 or more: 767
- Mobile homes: 7,691
- Boats, RVs, vans, etc.: 389
Housing units in Hunt County with a mortgage: 13,542 (390 second mortgage, 0 home equity loan, 340 both second mortgage and home equity loan)
Houses without a mortgage: 183
| Here: | 6.6% with mortgage |
| State: | 98.4% with mortgage |
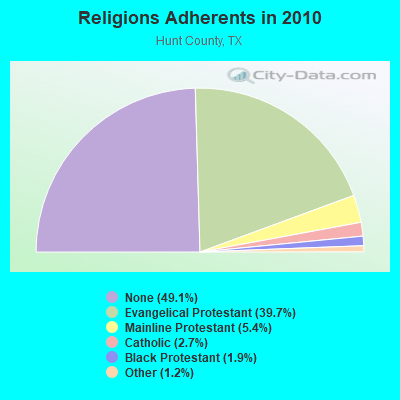
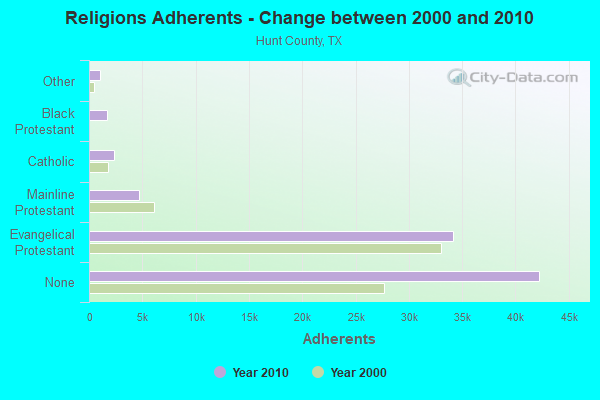
Religion statistics for Hunt County
| Religion | Adherents | Congregations |
|---|---|---|
| Evangelical Protestant | 34,158 | 140 |
| Mainline Protestant | 4,690 | 30 |
| Catholic | 2,361 | 3 |
| Black Protestant | 1,666 | 10 |
| Other | 1,002 | 5 |
| None | 42,252 | - |
Source: Clifford Grammich, Kirk Hadaway, Richard Houseal, Dale E.Jones, Alexei Krindatch, Richie Stanley and Richard H.Taylor. 2012. 2010 U.S.Religion Census: Religious Congregations & Membership Study. Association of Statisticians of American Religious Bodies. Jones, Dale E., et al. 2002. Congregations and Membership in the United States 2000. Nashville, TN: Glenmary Research Center.
Food Environment Statistics:
| Hunt County: | 1.69 / 10,000 pop. |
| State: | 1.47 / 10,000 pop. |
| Here: | 0.24 / 10,000 pop. |
| Texas: | 0.14 / 10,000 pop. |
| This county: | 1.57 / 10,000 pop. |
| Texas: | 1.11 / 10,000 pop. |
| Hunt County: | 4.11 / 10,000 pop. |
| Texas: | 3.95 / 10,000 pop. |
| This county: | 4.47 / 10,000 pop. |
| State: | 6.13 / 10,000 pop. |
| Hunt County: | 9.9% |
| Texas: | 8.9% |
| Hunt County: | 28.9% |
| State: | 26.6% |
| Here: | 17.1% |
| State: | 15.7% |
Agriculture in Hunt County:
Average size of farms: 144 acresAverage value of agricultural products sold per farm: $10,081
Average value of crops sold per acre for harvested cropland: $93.79
The value of livestock, poultry, and their products as a percentage of the total market value of agricultural products sold: 58.26%
Average total farm production expenses per farm: $14,313
Harvested cropland as a percentage of land in farms: 31.20%
Irrigated harvested cropland as a percentage of land in farms: 0.71%
Average market value of all machinery and equipment per farm: $23,768
The percentage of farms operated by a family or individual: 95.69%
Average age of principal farm operators: 56 years
Average number of cattle and calves per 100 acres of all land in farms: 15.10
Milk cows as a percentage of all cattle and calves: 2.57%
Corn for grain: 4774 harvested acres
All wheat for grain: 24503 harvested acres
Upland cotton: 5205 harvested acres
Soybeans for beans: 7266 harvested acres
Vegetables: 699 harvested acres
Land in orchards: 1,480 acres
Tornado activity:
Hunt County historical area-adjusted tornado activity is significantly below Texas state average. It is 1648170.9 times below overall U.S. average.Tornadoes in this county have caused 14 fatalities and 344 injuries recorded between 1950 and 2004.
On 4/2/1957, a category 3 (max. wind speeds 158-206 mph) tornado killed 10 people and injured 200 people and caused between $500,000 and $5,000,000 in damages.
Earthquake activity:
Hunt County-area historical earthquake activity is significantly above Texas state average. It is 491% greater than the overall U.S. average.On 11/6/2011 at 03:53:10, a magnitude 5.7 (5.7 MW, Depth: 3.2 mi, Class: Moderate, Intensity: VI - VII) earthquake occurred 171.9 miles away from Hunt County center
On 9/3/2016 at 12:02:44, a magnitude 5.8 (5.8 MW, Depth: 3.5 mi) earthquake occurred 234.2 miles away from the county center
On 5/17/2012 at 08:12:00, a magnitude 4.8 (4.8 MW, Depth: 3.1 mi, Class: Light, Intensity: IV - V) earthquake occurred 129.3 miles away from the county center
On 11/7/2016 at 01:44:24, a magnitude 5.0 (5.0 MW, Depth: 2.8 mi) earthquake occurred 203.4 miles away from the county center
On 9/6/1997 at 23:38:00, a magnitude 4.5 (4.5 LG, 4.2 LG, Depth: 3.1 mi) earthquake occurred 109.0 miles away from Hunt County center
On 11/8/2011 at 02:46:57, a magnitude 4.8 (4.8 MW, Depth: 3.1 mi) earthquake occurred 172.2 miles away from the county center
Magnitude types: regional Lg-wave magnitude (LG), moment magnitude (MW)
Most recent natural disasters:
- Texas Covid-19 Pandemic, Incident Period: January 20, 2020, FEMA Id: 4485, Natural disaster type: Other
- Texas Hurricane Ike, Incident Period: September 07, 2008 to September 26, 2008, Emergency Declared EM-3294: September 10, 2008, FEMA Id: 3294, Natural disaster type: Hurricane
- Texas Wildfires, Incident Period: March 14, 2008 to September 01, 2008, Emergency Declared EM-3284: March 14, 2008, FEMA Id: 3284, Natural disaster type: Fire
- Texas Severe Storms, Tornadoes, and Flooding, Incident Period: June 16, 2007 to August 03, 2007, Major Disaster (Presidential) Declared DR-1709: June 29, 2007, FEMA Id: 1709, Natural disaster type: Storm, Tornado, Flood
- Texas Hurricane Rita, Incident Period: September 23, 2005 to October 14, 2005, Major Disaster (Presidential) Declared DR-1606: September 24, 2005, FEMA Id: 1606, Natural disaster type: Hurricane
- Texas Hurricane Rita, Incident Period: September 20, 2005 to October 14, 2005, Emergency Declared EM-3261: September 21, 2005, FEMA Id: 3261, Natural disaster type: Hurricane
- Texas Hurricane Katrina, Incident Period: August 29, 2005 to October 01, 2005, Emergency Declared EM-3216: September 02, 2005, FEMA Id: 3216, Natural disaster type: Hurricane
- Texas Loss of the Space Shuttle Columbia, Incident Period: February 01, 2003, Emergency Declared EM-3171: February 01, 2003, FEMA Id: 3171, Natural disaster type: Other
- Texas Severe Winter Storm, Incident Period: December 12, 2000 to January 15, 2001, Major Disaster (Presidential) Declared DR-1356: January 08, 2001, FEMA Id: 1356, Natural disaster type: Winter Storm
- Texas Extreme Fire Hazards, Incident Period: August 01, 1999 to December 10, 1999, Emergency Declared EM-3142: September 01, 1999, FEMA Id: 3142, Natural disaster type: Fire
- 2 other natural disasters have been reported since 1953.
The number of natural disasters in Hunt County (12) is smaller than the US average (15).
Major Disasters (Presidential) Declared: 4
Emergencies Declared: 6
Causes of natural disasters: Hurricanes: 4, Fires: 3, Floods: 2, Storms: 2, Tornadoes: 2, Winter Storm: 1, Other: 2 (Note: some incidents may be assigned to more than one category).
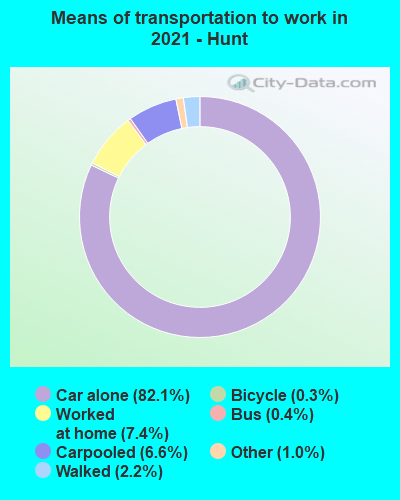
Means of transportation to work:
- Drove a car alone: 30,404 (76.1%)
- Carpooled: 2,701 (6.8%)
- Bus: 94 (0.2%)
- Long-distance train or commuter rail: 28 (0.1%)
- Taxicab, motorcycle, or other means: 527 (1.3%)
- Bicycle: 96 (0.2%)
- Walked: 947 (2.4%)
- Worked at home: 4,806 (12.0%)
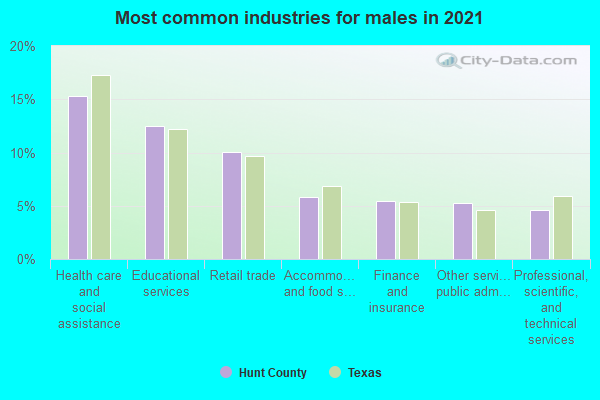
- Health care and social assistance (22%)
- Retail trade (10%)
- Educational services (10%)
- Professional, scientific, and technical services (6%)
- Transportation and warehousing (6%)
- Accommodation and food services (6%)
- Manufacturing (5%)
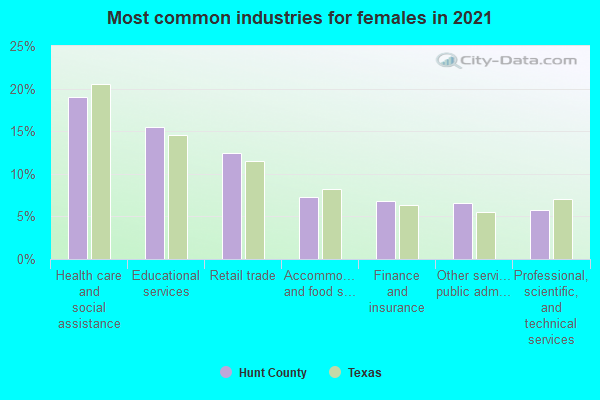
- Health care and social assistance (25%)
- Retail trade (11%)
- Educational services (11%)
- Professional, scientific, and technical services (7%)
- Transportation and warehousing (7%)
- Accommodation and food services (7%)
- Manufacturing (6%)
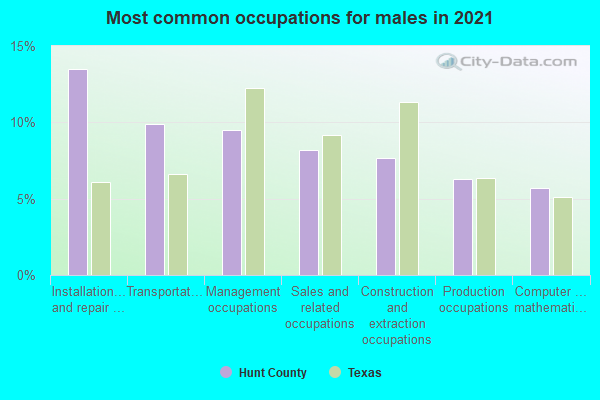
- Construction and extraction occupations (12%)
- Management occupations (11%)
- Installation, maintenance, and repair occupations (10%)
- Sales and related occupations (10%)
- Production occupations (10%)
- Transportation occupations (8%)
- Material moving occupations (6%)
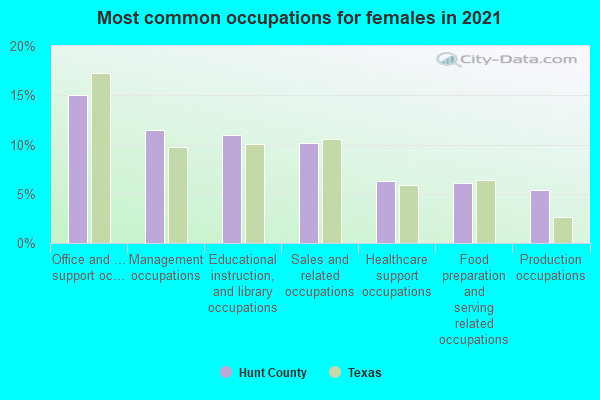
- Office and administrative support occupations (29%)
- Sales and related occupations (12%)
- Management occupations (11%)
- Healthcare support occupations (7%)
- Food preparation and serving related occupations (6%)
- Educational instruction, and library occupations (5%)
- Business and financial operations occupations (5%)
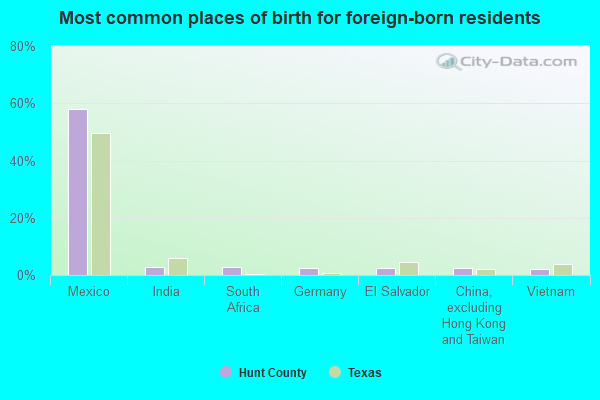
- Mexico (60%)
- South Africa (6%)
- China, excluding Hong Kong and Taiwan (3%)
- India (3%)
- El Salvador (3%)
- Vietnam (3%)
- Other Eastern Africa (2%)
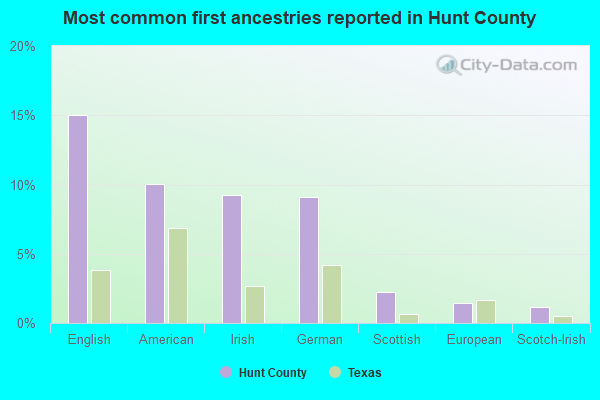
- English (16%)
- American (10%)
- Irish (9%)
- German (9%)
- Scottish (2%)
- Scotch-Irish (1%)
- Italian (1%)
People in group quarters in Hunt County, Texas in 2010:
- 1,059 people in college/university student housing
- 402 people in nursing facilities/skilled-nursing facilities
- 271 people in local jails and other municipal confinement facilities
- 57 people in group homes intended for adults
- 36 people in workers' group living quarters and job corps centers
- 17 people in correctional facilities intended for juveniles
- 11 people in emergency and transitional shelters (with sleeping facilities) for people experiencing homelessness
- 10 people in group homes for juveniles (non-correctional)
- 6 people in residential treatment centers for adults
People in group quarters in Hunt County, Texas in 2000:
- 1,044 people in college dormitories (includes college quarters off campus)
- 505 people in nursing homes
- 124 people in local jails and other confinement facilities (including police lockups)
- 76 people in other noninstitutional group quarters
- 41 people in homes or halfway houses for drug/alcohol abuse
- 34 people in hospitals/wards and hospices for chronically ill
- 34 people in hospices or homes for chronically ill
- 34 people in mental (psychiatric) hospitals or wards
- 23 people in homes for the mentally retarded
- 8 people in short-term care, detention or diagnostic centers for delinquent children
- 7 people in other group homes
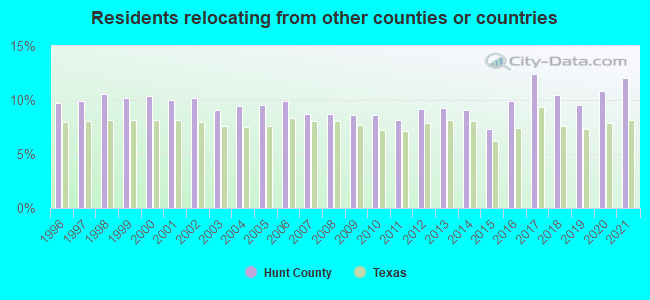
12.03% of this county's 2021 resident taxpayers lived in other counties in 2020 ($56,299 average adjusted gross income)
| Here: | 12.03% |
| Texas average: | 8.12% |
10 or fewer of this county's residents moved from foreign countries.
9.68% relocated from other counties in Texas ($44,706 average AGI)
2.35% relocated from other states ($11,593 average AGI)
Hunt County: 2.35% Texas average: 2.83%
Top counties from which taxpayers relocated into this county between 2020 and 2021:
| from Dallas County, TX | |
| from Collin County, TX | |
| from Rockwall County, TX | |
| from Kaufman County, TX | |
| from Tarrant County, TX | |
| from Denton County, TX | |
| from Hopkins County, TX |
8.98% of this county's 2020 resident taxpayers moved to other counties in 2021 ($50,631 average adjusted gross income)
| Here: | 8.98% |
| Texas average: | 7.40% |
10 or fewer of this county's residents moved to foreign countries.
7.27% relocated to other counties in Texas ($41,249 average AGI)
1.71% relocated to other states ($9,382 average AGI)
Hunt County: 1.71% Texas average: 2.08%

Top counties to which taxpayers relocated from this county between 2020 and 2021:
| to Dallas County, TX | |
| to Collin County, TX | |
| to Rockwall County, TX | |
| to Kaufman County, TX | |
| to Tarrant County, TX | |
| to Hopkins County, TX | |
| to Rains County, TX |
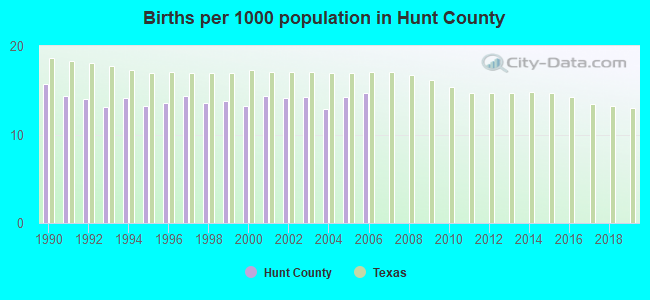
Births per 1000 population from 1990 to 1999: 14.0
Births per 1000 population from 2000 to 2006: 13.9
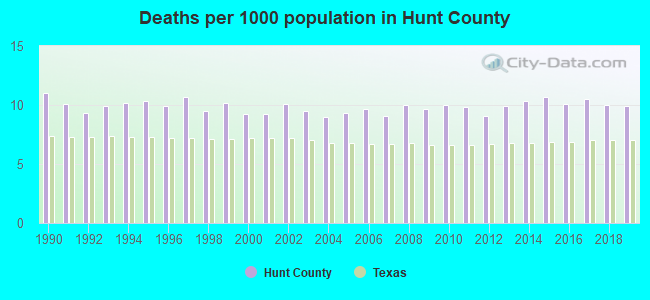
Deaths per 1000 population from 1990 to 1999: 10.1
Deaths per 1000 population from 2000 to 2009: 9.5
Deaths per 1000 population from 2010 to 2020: 10.2
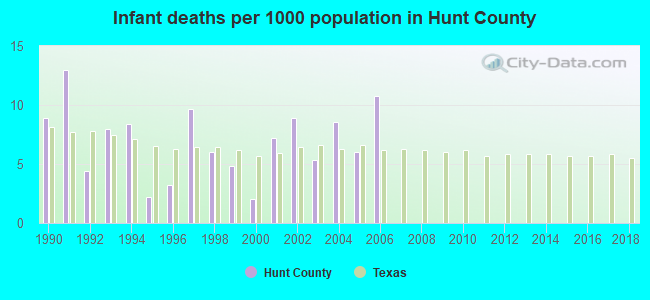
Infant deaths per 1000 live births from 1990 to 1999: 6.9
Infant deaths per 1000 live births from 2000 to 2006: 7.0
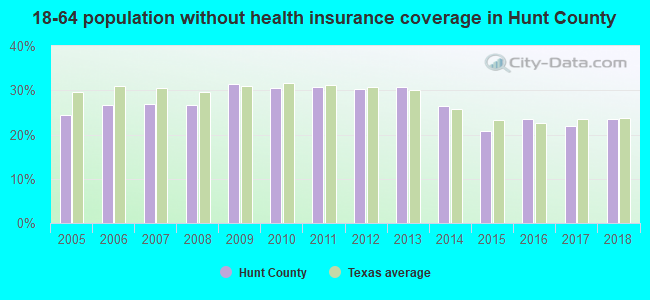
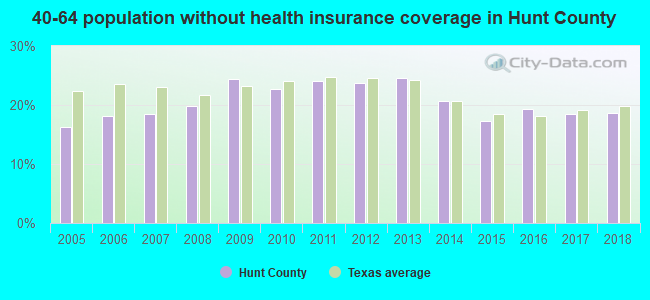
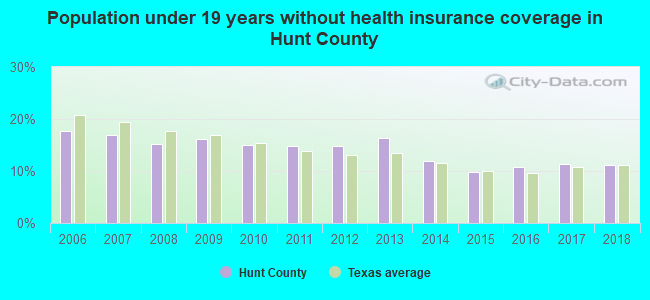
Persons under 19 years old without health insurance coverage in 2018: 11.1%
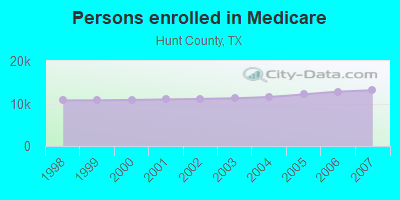
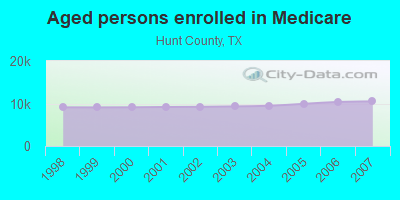
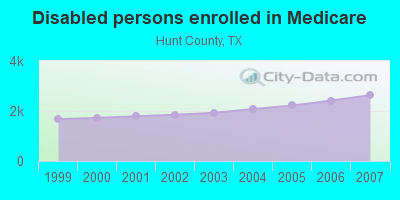
Persons enrolled in hospital insurance and/or supplemental medical insurance (Medicare) in July 1, 2007: 13,131 (10,498 aged, 2,633 disabled)
Children under 18 without health insurance coverage in 2007: 3,291 (16%)
Most common underlying causes of death in Hunt County, Texas in 1999 - 2019:
- Acute myocardial infarction, unspecified (1,825)
- Bronchus or lung, unspecified - Malignant neoplasms (1,200)
- Chronic obstructive pulmonary disease, unspecified (824)
- Atherosclerotic heart disease (793)
- Congestive heart failure (669)
- Alzheimer disease, unspecified (601)
- Stroke, not specified as haemorrhage or infarction (461)
- Unspecified dementia (392)
- Colon, unspecified - Malignant neoplasms (295)
- Pneumonia, unspecified (277)
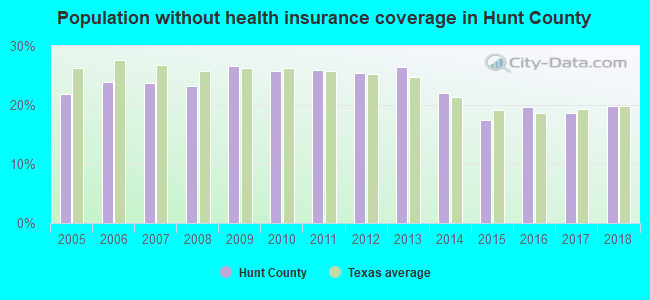
Population without health insurance coverage in 2000: 17%
Children under 18 without health insurance coverage in 2000: 16%
Short term general hospital admissions per 100,000 population in 2004: 10,093
Short term general hospital beds per 100,000 population in 2004: 227
Emergency room visits per 100,000 population in 2004: 58,194
General practice office based MDs per 100,000 population in 2005: 1,352
Medical specialist MDs per 100,000 population in 2005: 909
Dentists per 100,000 population in 1998: 6
Total births per 100,000 population, July 2005 - July 2006 : 28
Total deaths per 100,000 population, July 2005 - July 2006: 58
Limited-service eating places per 100,000 population in 2005 : 6
Homicides per 1,000,000 population from 2000 to 2006: 66.2. This is more than state average.
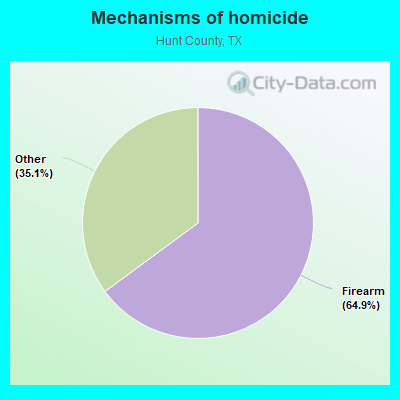
- Firearm - 42.9
- Other - 23.2
Suicides per 1,000,000 population from 2000 to 2006: 152.0. This is more than state average.
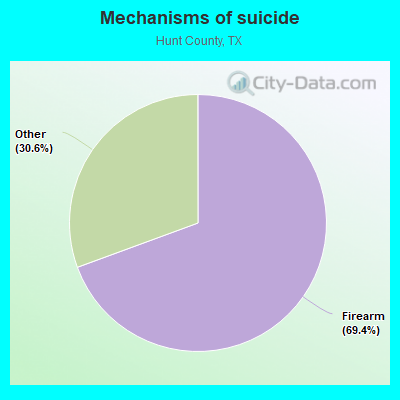
- Firearm - 105.5
- Other - 46.5
Household type by relationship:
Households: 108,282- Male householders: 19,430 (6,050 living alone), Female householders: 18,642 (3,730 living alone)
20,780 spouses (20,710 opposite-sex spouses), 2,005 unmarried partners, (1,863 opposite-sex unmarried partners), 32,160 children (28,802 natural, 953 adopted, 2,405 stepchildren), 4,335 grandchildren, 185 brothers or sisters, 1,457 parents, 53 foster children, 2,261 other relatives, 3,188 non-relatives
- In group quarters: 3,786
Size of family households: 11,226 2-persons, 6,303 3-persons, 4,000 4-persons, 2,996 5-persons, 1,139 6-persons, 234 7-or-more-persons.
Size of nonfamily households: 9,780 1-person, 2,140 2-persons, 71 3-persons, 183 4-persons.
17,048 married couples with children.
3,683 single-parent households (629 men, 3,054 women).
86.7% of residents of Hunt speak English at home.
11.3% of residents speak Spanish at home (64% speak English very well, 19% speak English well, 10% speak English not well, 7% don't speak English at all).
0.7% of residents speak other Indo-European language at home (90% speak English very well, 2% speak English well, 9% speak English not well).
0.8% of residents speak Asian or Pacific Island language at home (60% speak English very well, 19% speak English well, 14% speak English not well, 7% don't speak English at all).
0.4% of residents speak other language at home (39% speak English very well, 59% speak English well, 1% speak English not well).
In fiscal year 2004:
Federal Government expenditure: $884,554,000 ($10,816 per capita)
Department of Defense expenditure: $515,482,000
Federal direct payments to individuals for retirement and disability: $186,917,000
Federal other direct payments to individuals: $104,687,000
Federal direct payments not to individuals: $2,332,000
Federal grants: $73,315,000
Federal procurement contracts: $496,118,000 ($492,834,000 Department of Defense)
Federal salaries and wages: $21,186,000 ($7,926,000 Department of Defense)
Federal Government direct loans: $25,088,000
Federal guaranteed/insured loans: $45,469,000
Federal Government insurance: $23,817,000
Population change from April 1, 2000 to July 1, 2005:
Births: 5,856| Here: | 71 per 1000 residents |
| State: | 85 per 1000 residents |
Deaths: 3,973
| Here: | 48 per 1000 residents |
| State: | 35 per 1000 residents |
Net international migration: +1,191
| Here: | +14 per 1000 residents |
| State: | +29 per 1000 residents |
Net internal migration: +2,979
| Here: | +36 per 1000 residents |
| State: | +10 per 1000 residents |
Total withdrawal of fresh water for public supply: 146.84 millions of gallons per day (1% from ground, 99% from surface)
| Here: | 5.9 |
| State: | 6.3 |
| Here: | 4.1 |
| State: | 4.0 |
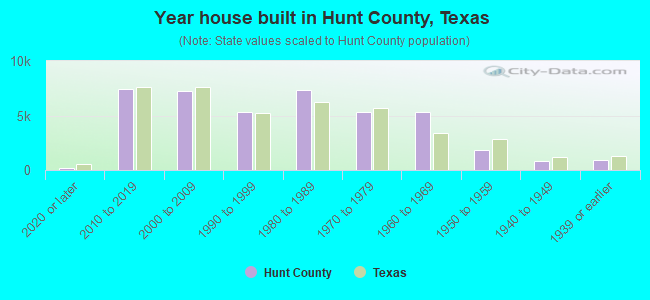
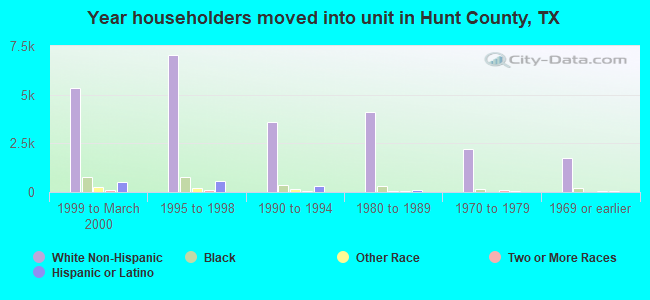
- Year house built in Hunt County, Texas
- 2,4222020 or later
- 7,3452010 to 2019
- 7,3442000 to 2009
- 4,8791990 to 1999
- 5,1731980 to 1989
- 6,6941970 to 1979
- 5,2811960 to 1969
- 2,1981950 to 1959
- 4821940 to 1949
- 1,3801939 or earlier
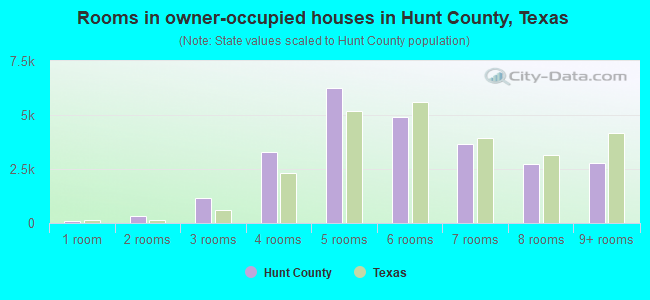
- Rooms in owner-occupied houses in Hunt County, Texas
- 901 room
- 8452 rooms
- 8423 rooms
- 3,4124 rooms
- 7,1515 rooms
- 4,5956 rooms
- 3,5807 rooms
- 3,9288 rooms
- 3,6009+ rooms
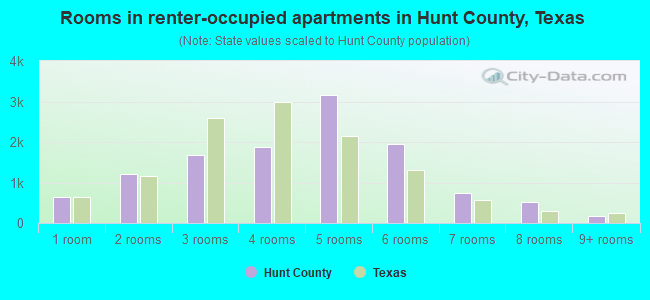
- Rooms in renter-occupied apartments in Hunt County, Texas
- 1,0981 room
- 6792 rooms
- 1,9353 rooms
- 2,0254 rooms
- 2,3565 rooms
- 7546 rooms
- 5537 rooms
- 2968 rooms
- 3339+ rooms
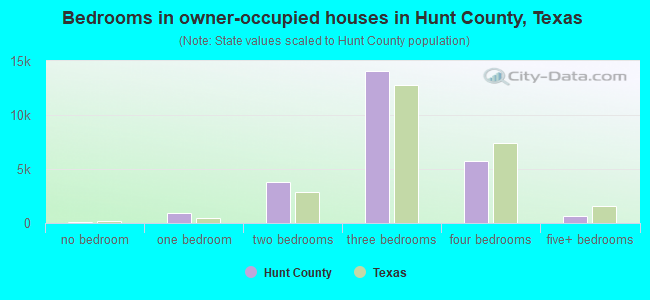
- Bedrooms in owner-occupied houses in Hunt County, Texas
- 90no bedroom
- 1,1051 bedroom
- 4,8252 bedrooms
- 14,3603 bedrooms
- 6,7334 bedrooms
- 9305+ bedrooms
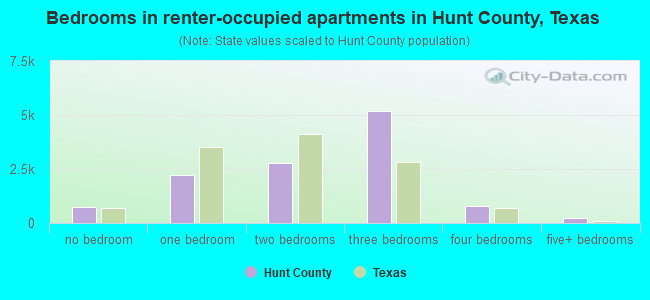
- Bedrooms in renter-occupied apartments in Hunt County, Texas
- 1,106no bedroom
- 2,9421 bedroom
- 2,2172 bedrooms
- 2,9913 bedrooms
- 6384 bedrooms
- 1355+ bedrooms
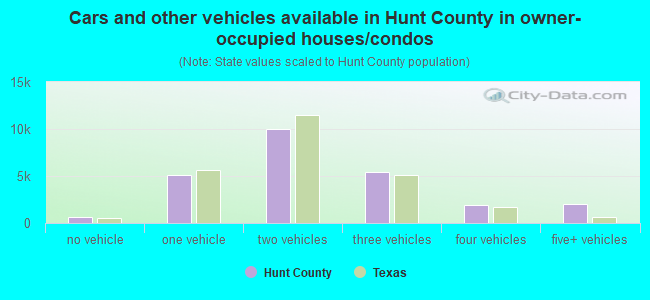
- Cars and other vehicles available in Hunt County in owner-occupied houses/condos
- 655no vehicle
- 4,7981 vehicle
- 10,9582 vehicles
- 7,9643 vehicles
- 2,1504 vehicles
- 1,5185+ vehicles
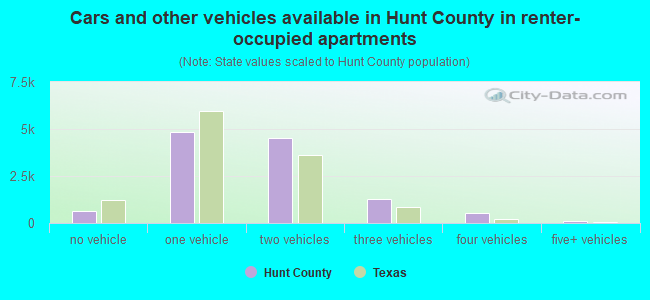
- Cars and other vehicles available in Hunt County in renter-occupied apartments
- 571no vehicle
- 4,8871 vehicle
- 3,2062 vehicles
- 1,3653 vehicles
- 04 vehicles
- 05+ vehicles
84.6% of Hunt County residents lived in the same house 1 years ago.
Out of people who lived in different houses, 30% lived in this county.
Out of people who lived in different counties, 82% lived in Texas.
| Hunt County: | 84.6% |
| State average: | 85.7% |
Place of birth for U.S.-born residents:
- This state: 74,364
- Other state: 25,382
- Northeast: 1,958
- Midwest: 8,215
- South: 8,765
- West: 6,444
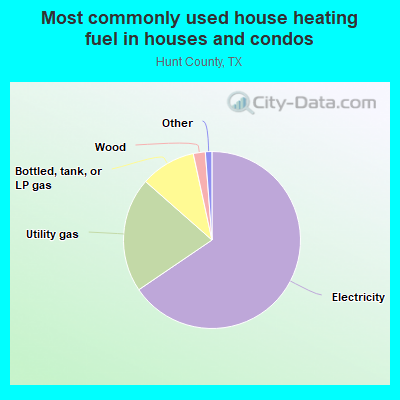
- 65.7%Electricity
- 20.6%Utility gas
- 10.0%Bottled, tank, or LP gas
- 2.3%Wood
- 0.8%Other fuel
- 0.5%No fuel used
- 0.1%Coal or coke
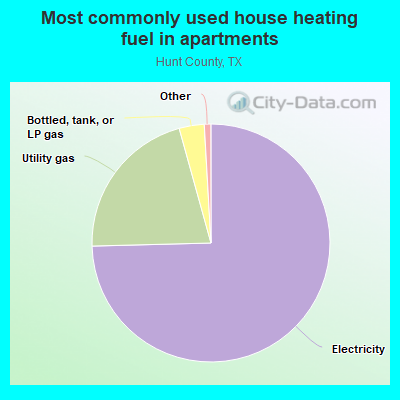
- 73.4%Electricity
- 22.2%Utility gas
- 3.3%Bottled, tank, or LP gas
- 0.7%No fuel used
- 0.3%Wood
- 0.1%Fuel oil, kerosene, etc.
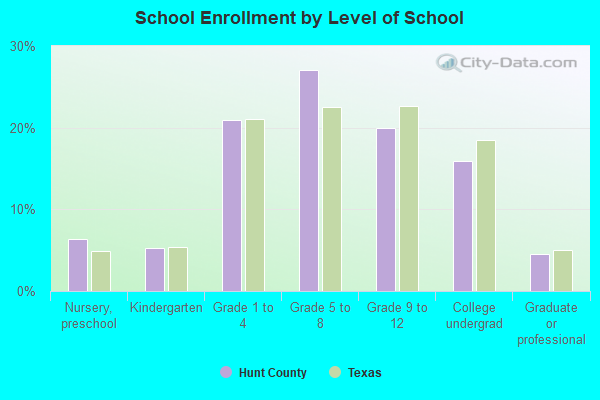
Private vs. public school enrollment:
| Here: | 5.8% |
| Texas: | 8.8% |
| Here: | 10.6% |
| Texas: | 8.0% |
| Here: | 12.2% |
| Texas: | 16.2% |

Hunt County government finances - Expenditure in 2017:
- Charges - Other: $1,894,000
- Construction - Regular Highways: $1,147,000
- Current Operations - Judicial and Legal Services: $12,643,000
Police Protection: $7,015,000
Regular Highways: $6,273,000
Correctional Institutions: $6,148,000
Financial Administration: $4,086,000
Central Staff Services: $1,923,000
General Public Buildings: $1,329,000
Health - Other: $949,000
General - Other: $681,000
Public Welfare - Other: $673,000
Natural Resources - Other: $159,000
Corrections - Other: $93,000
- General - Interest on Debt: $196,000
- Long Term Debt - Beginning Outstanding - Unspecified Public Purpose: $6,805,000
Outstanding Unspecified Public Purpose: $5,980,000
Retired Unspecified Public Purpose: $825,000
- Miscellaneous - Fines and Forfeits: $2,605,000
General Revenue - Other: $782,000
Sale of Property: $284,000
Interest Earnings: $27,000
- Other Capital Outlay - General - Other: $569,000
- Other Funds - Cash and Securities: $15,446,000
- State Intergovernmental - Other: $2,526,000
General Local Government Support: $941,000
- Tax - Property: $26,251,000
General Sales and Gross Receipts: $4,248,000
Motor Vehicle License: $2,015,000
- Total Salaries and Wages: $14,654,000
Hunt County government finances - Revenue in 2017:
- Charges - Other: $1,894,000
- Construction - Regular Highways: $1,147,000
- Current Operations - Judicial and Legal Services: $12,643,000
Police Protection: $7,015,000
Regular Highways: $6,273,000
Correctional Institutions: $6,148,000
Financial Administration: $4,086,000
Central Staff Services: $1,923,000
General Public Buildings: $1,329,000
Health - Other: $949,000
General - Other: $681,000
Public Welfare - Other: $673,000
Natural Resources - Other: $159,000
Corrections - Other: $93,000
- General - Interest on Debt: $196,000
- Long Term Debt - Beginning Outstanding - Unspecified Public Purpose: $6,805,000
Outstanding Unspecified Public Purpose: $5,980,000
Retired Unspecified Public Purpose: $825,000
- Miscellaneous - Fines and Forfeits: $2,605,000
General Revenue - Other: $782,000
Sale of Property: $284,000
Interest Earnings: $27,000
- Other Capital Outlay - General - Other: $569,000
- Other Funds - Cash and Securities: $15,446,000
- State Intergovernmental - Other: $2,526,000
General Local Government Support: $941,000
- Tax - Property: $26,251,000
General Sales and Gross Receipts: $4,248,000
Motor Vehicle License: $2,015,000
- Total Salaries and Wages: $14,654,000
Hunt County government finances - Debt in 2017:
- Charges - Other: $1,894,000
- Construction - Regular Highways: $1,147,000
- Current Operations - Judicial and Legal Services: $12,643,000
Police Protection: $7,015,000
Regular Highways: $6,273,000
Correctional Institutions: $6,148,000
Financial Administration: $4,086,000
Central Staff Services: $1,923,000
General Public Buildings: $1,329,000
Health - Other: $949,000
General - Other: $681,000
Public Welfare - Other: $673,000
Natural Resources - Other: $159,000
Corrections - Other: $93,000
- General - Interest on Debt: $196,000
- Long Term Debt - Beginning Outstanding - Unspecified Public Purpose: $6,805,000
Outstanding Unspecified Public Purpose: $5,980,000
Retired Unspecified Public Purpose: $825,000
- Miscellaneous - Fines and Forfeits: $2,605,000
General Revenue - Other: $782,000
Sale of Property: $284,000
Interest Earnings: $27,000
- Other Capital Outlay - General - Other: $569,000
- Other Funds - Cash and Securities: $15,446,000
- State Intergovernmental - Other: $2,526,000
General Local Government Support: $941,000
- Tax - Property: $26,251,000
General Sales and Gross Receipts: $4,248,000
Motor Vehicle License: $2,015,000
- Total Salaries and Wages: $14,654,000
Hunt County government finances - Cash and Securities in 2017:
- Charges - Other: $1,894,000
- Construction - Regular Highways: $1,147,000
- Current Operations - Judicial and Legal Services: $12,643,000
Police Protection: $7,015,000
Regular Highways: $6,273,000
Correctional Institutions: $6,148,000
Financial Administration: $4,086,000
Central Staff Services: $1,923,000
General Public Buildings: $1,329,000
Health - Other: $949,000
General - Other: $681,000
Public Welfare - Other: $673,000
Natural Resources - Other: $159,000
Corrections - Other: $93,000
- General - Interest on Debt: $196,000
- Long Term Debt - Beginning Outstanding - Unspecified Public Purpose: $6,805,000
Outstanding Unspecified Public Purpose: $5,980,000
Retired Unspecified Public Purpose: $825,000
- Miscellaneous - Fines and Forfeits: $2,605,000
General Revenue - Other: $782,000
Sale of Property: $284,000
Interest Earnings: $27,000
- Other Capital Outlay - General - Other: $569,000
- Other Funds - Cash and Securities: $15,446,000
- State Intergovernmental - Other: $2,526,000
General Local Government Support: $941,000
- Tax - Property: $26,251,000
General Sales and Gross Receipts: $4,248,000
Motor Vehicle License: $2,015,000
- Total Salaries and Wages: $14,654,000
Supplemental Security Income (SSI) in 2006:
- Total number of recipients: 2,024
- Number of aged recipients: 243
- Number of blind and disabled recipients: 1,781
- Number of recipients under 18: 335
- Number of recipients between 18 and 64: 1,268
- Number of recipients older than 64: 421
- Number of recipients also receiving OASDI: 843
- Amount of payments (thousands of dollars): 854
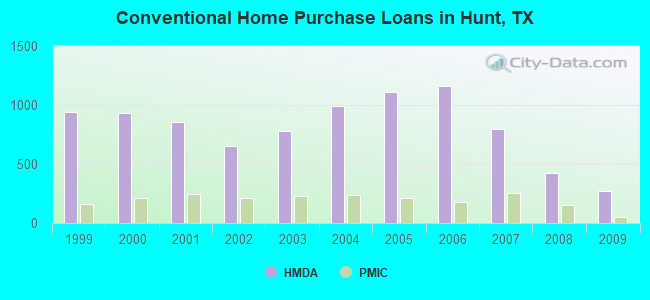
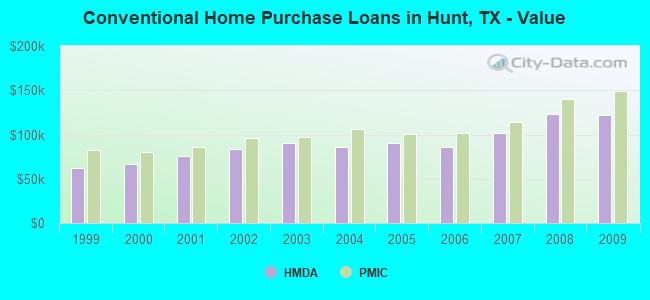
| Home Mortgage Disclosure Act Aggregated Statistics For Year 2009 (Based on 17 full tracts) | ||||||||||||||
| A) FHA, FSA/RHS & VA Home Purchase Loans | B) Conventional Home Purchase Loans | C) Refinancings | D) Home Improvement Loans | E) Loans on Dwellings For 5+ Families | F) Non-occupant Loans on < 5 Family Dwellings (A B C & D) | G) Loans On Manufactured Home Dwelling (A B C & D) | ||||||||
|---|---|---|---|---|---|---|---|---|---|---|---|---|---|---|
| Number | Average Value | Number | Average Value | Number | Average Value | Number | Average Value | Number | Average Value | Number | Average Value | Number | Average Value | |
| LOANS ORIGINATED | 283 | $120,336 | 267 | $121,517 | 494 | $134,476 | 60 | $40,133 | 1 | $1,388,000 | 90 | $82,267 | 63 | $78,460 |
| APPLICATIONS APPROVED, NOT ACCEPTED | 19 | $97,211 | 44 | $95,250 | 62 | $117,839 | 13 | $37,000 | 0 | $0 | 7 | $155,714 | 29 | $68,931 |
| APPLICATIONS DENIED | 74 | $115,743 | 112 | $85,607 | 312 | $127,192 | 83 | $42,277 | 0 | $0 | 32 | $117,469 | 72 | $60,403 |
| APPLICATIONS WITHDRAWN | 29 | $116,103 | 32 | $90,000 | 149 | $140,765 | 20 | $44,450 | 0 | $0 | 12 | $84,083 | 11 | $71,909 |
| FILES CLOSED FOR INCOMPLETENESS | 9 | $165,667 | 16 | $132,688 | 79 | $126,506 | 7 | $72,286 | 0 | $0 | 5 | $84,400 | 10 | $63,100 |
| Private Mortgage Insurance Companies Aggregated Statistics For Year 2009 (Based on 15 full tracts) | ||||||||
| A) Conventional Home Purchase Loans | B) Refinancings | C) Non-occupant Loans on < 5 Family Dwellings (A & B) | D) Loans On Manufactured Home Dwelling (A & B) | |||||
|---|---|---|---|---|---|---|---|---|
| Number | Average Value | Number | Average Value | Number | Average Value | Number | Average Value | |
| LOANS ORIGINATED | 49 | $149,000 | 17 | $155,176 | 2 | $94,000 | 0 | $0 |
| APPLICATIONS APPROVED, NOT ACCEPTED | 13 | $161,231 | 12 | $208,000 | 3 | $59,000 | 0 | $0 |
| APPLICATIONS DENIED | 0 | $0 | 5 | $170,000 | 0 | $0 | 1 | $120,000 |
| APPLICATIONS WITHDRAWN | 2 | $180,500 | 6 | $165,000 | 0 | $0 | 0 | $0 |
| FILES CLOSED FOR INCOMPLETENESS | 4 | $165,500 | 1 | $329,000 | 1 | $144,000 | 0 | $0 |
| Most common first names in Hunt County, TX among deceased individuals | ||
| Name | Count | Lived (average) |
|---|---|---|
| James | 541 | 71.7 years |
| William | 447 | 75.7 years |
| John | 416 | 74.6 years |
| Mary | 409 | 78.3 years |
| Robert | 278 | 72.3 years |
| Charles | 217 | 71.3 years |
| George | 199 | 75.3 years |
| Willie | 165 | 78.3 years |
| Billy | 148 | 66.6 years |
| Thomas | 131 | 71.6 years |
| Most common last names in Hunt County, TX among deceased individuals | ||
| Last name | Count | Lived (average) |
|---|---|---|
| Smith | 276 | 75.9 years |
| Johnson | 223 | 75.9 years |
| Williams | 221 | 74.6 years |
| Jones | 142 | 72.0 years |
| Brown | 135 | 74.4 years |
| Moore | 135 | 76.5 years |
| Davis | 133 | 72.3 years |
| White | 111 | 76.0 years |
| Taylor | 102 | 74.4 years |
| Green | 96 | 75.6 years |
| Businesses in Hunt County, TX | ||||
| Name | Count | Name | Count | |
|---|---|---|---|---|
| AT&T | 3 | La-Z-Boy | 1 | |
| Applebee's | 1 | Lane Furniture | 1 | |
| Arby's | 1 | Little Caesars Pizza | 1 | |
| AutoZone | 3 | Lowe's | 1 | |
| Bath & Body Works | 1 | MasterBrand Cabinets | 1 | |
| Best Western | 1 | McDonald's | 5 | |
| CVS | 1 | Motel 6 | 1 | |
| Chevrolet | 2 | Nike | 1 | |
| Chick-Fil-A | 1 | Nissan | 1 | |
| Church's Chicken | 2 | Payless | 1 | |
| Circle K | 1 | Pizza Hut | 3 | |
| Cracker Barrel | 1 | Popeyes | 1 | |
| Curves | 1 | Quality | 1 | |
| Dairy Queen | 2 | Quiznos | 1 | |
| Days Inn | 1 | Red Lobster | 1 | |
| Dennys | 1 | SONIC Drive-In | 4 | |
| Discount Tire | 1 | Sears | 1 | |
| Domino's Pizza | 2 | Sprint Nextel | 1 | |
| Econo Lodge | 1 | Staples | 1 | |
| FedEx | 8 | Starbucks | 1 | |
| GNC | 1 | Subway | 8 | |
| GameStop | 1 | Super 8 | 1 | |
| H&R Block | 5 | T-Mobile | 1 | |
| Hilton | 1 | Taco Bell | 2 | |
| Holiday Inn | 3 | U-Haul | 12 | |
| Home Depot | 1 | UPS | 4 | |
| IHOP | 1 | Walgreens | 1 | |
| JCPenney | 1 | Walmart | 3 | |
| Jack In The Box | 1 | Wendy's | 1 | |
| Jones New York | 1 | YMCA | 1 | |
| KFC | 2 | |||
Hunt County on our top lists:
- #38 on the list of "Top 101 counties with the highest surface withdrawal of fresh water for public supply (pop. 50,000+)"
- #39 on the list of "Top 101 counties with the highest surface withdrawal of fresh water for public supply"
- #42 on the list of "Top 101 counties with highest percentage of residents voting for Romney (Republican) in the 2012 Presidential Election (pop. 50,000+)"
- #49 on the list of "Top 101 counties with the lowest Nitrogen Dioxide air pollution readings in 2012 (ppm)"
- #56 on the list of "Top 101 counties with the highest total withdrawal of fresh water for public supply (pop. 50,000+)"
- #57 on the list of "Top 101 counties with the highest total withdrawal of fresh water for public supply"