Pope County, Illinois (IL)
County owner-occupied free and clear houses and condos in 2010: 826
County owner-occupied houses and condos in 2000: 1,453
Renter-occupied apartments: 354 (it was 316 in 2000)
| % of renters here: | 18% |
| State: | 33% |
Land area: 371 sq. mi.
Water area: 3.8 sq. mi.
Population density: 10 people per square mile (low).
Industries providing employment: Educational, health and social services (34.5%), Retail trade (16.0%).
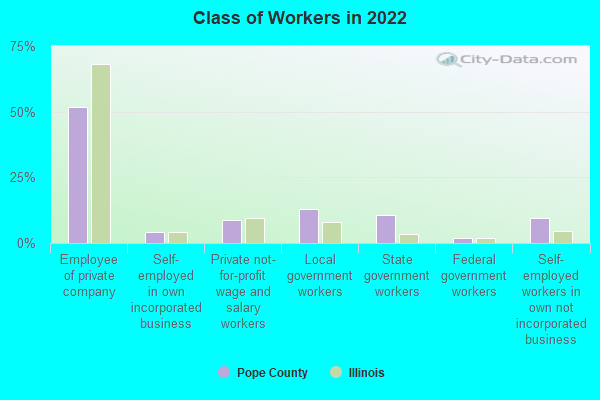
Type of workers:
- Private wage or salary: 64%
- Government: 26%
- Self-employed, not incorporated: 10%
- Unpaid family work: 0%
- OSM Map
- General Map
- Google Map
- MSN Map

- 3,28888.5%White Non-Hispanic Alone
- 1363.7%Two or more races
- 1193.2%Black Non-Hispanic Alone
- 1193.2%Hispanic or Latino
- 521.4%American Indian and Alaska Native alone
- 10.03%Asian alone
| Median resident age: | 50.2 years |
| Illinois median age: | 39.1 years |
| Males: 1,939 | |
| Females: 1,807 |

 | Moving to Carbondale (27 replies) |
| Strange Golconda directions.... (5 replies) |
| Where to buy cheap land in IL? Ideally want to build a shipping container home (24 replies) |
| You Know You're From Illinois When: (83 replies) |
| Some great things about southern Illinois (67 replies) |
| Pope County: | 2.0 people |
| Illinois: | 3 people |
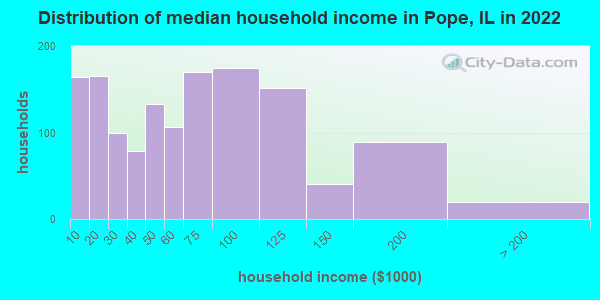
Estimated median household income in 2022: $56,315 ($30,048 in 1999)
| This county: | $56,315 |
| Illinois: | $76,708 |
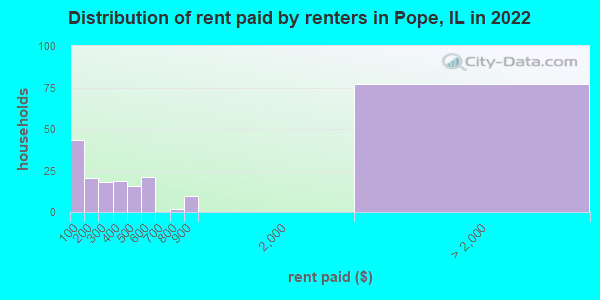
Median contract rent in 2022 for apartments: $219 (lower quartile is $98, upper quartile is $458)
| This county: | $219 |
| State: | $1008 |
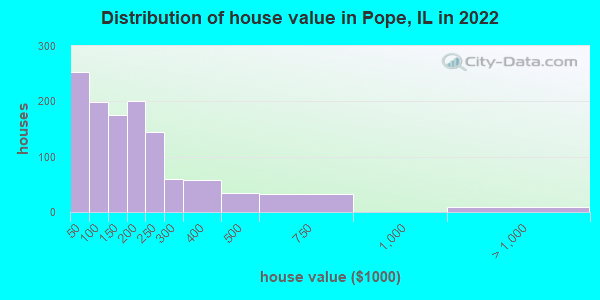
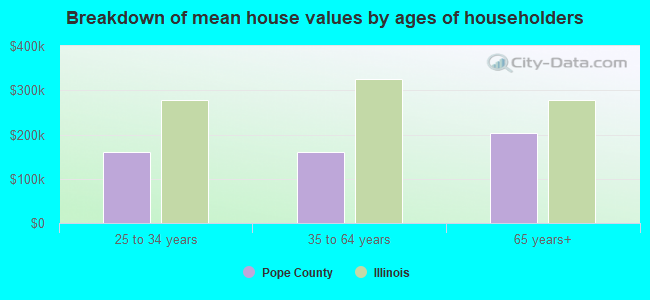
Estimated median house or condo value in 2022: $144,688 (it was $60,200 in 2000)
| Pope: | $144,688 |
| Illinois: | $251,600 |
Median monthly housing costs for homes and condos with a mortgage: $1,178
Median monthly housing costs for units without a mortgage: $514
Institutionalized population: 206
Crime in 2010 (reported by the sheriff's office or county police, not the county total):
- Murders: 0
- Rapes: 0
- Robberies: 0
- Assaults: 13
- Burglaries: 25
- Thefts: 19
- Auto thefts: 1
Crime in 1992 (reported by the sheriff's office or county police, not the county total):
- Murders: 0
- Rapes: 0
- Robberies: 0
- Assaults: 2
- Burglaries: 11
- Thefts: 26
- Auto thefts: 2
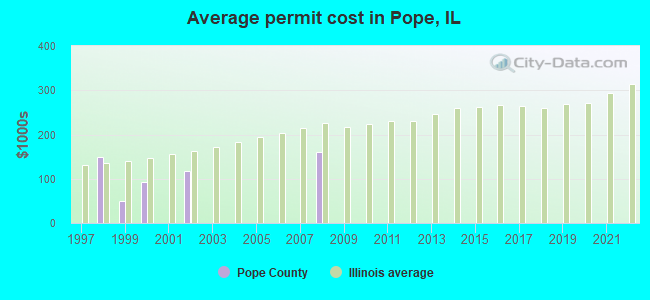
Single-family new house construction building permits:
- 2022: 0 buildings
- 2021: 0 buildings
- 2020: 0 buildings
- 2019: 0 buildings
- 2018: 0 buildings
- 2017: 0 buildings
- 2016: 0 buildings
- 2015: 0 buildings
- 2014: 0 buildings
- 2013: 0 buildings
- 2012: 0 buildings
- 2011: 0 buildings
- 2010: 0 buildings
- 2009: 0 buildings
- 2008: 1 building, cost: $161,100
- 2007: 0 buildings
- 2006: 0 buildings
- 2005: 0 buildings
- 2004: 0 buildings
- 2003: 0 buildings
- 2002: 1 building, cost: $118,000
- 2001: 0 buildings
- 2000: 2 buildings, average cost: $92,500
- 1999: 1 building, cost: $50,000
- 1998: 1 building, cost: $150,000
- 1997: 0 buildings
Median real estate property taxes paid for housing units with mortgages in 2022: $1,534 (0.9%)
Median real estate property taxes paid for housing units with no mortgage in 2022: $1,930 (1.6%)
| Pope County: | 19.0% |
| Illinois: | 11.9% |
Median age of residents in 2022: 50.2 years old
(Males: 49.5 years old, Females: 51.2 years old)
(Median age for: White residents: 52.7 years old, Black residents: 42.7 years old, American Indian residents: 14.7 years old, Hispanic or Latino residents: 19.5 years old)
Fair market rent in 2006 for a 1-bedroom apartment in Pope County is $408 a month.
Fair market rent for a 2-bedroom apartment is $492 a month.
Fair market rent for a 3-bedroom apartment is $648 a month.
Notable locations in this county outside city limits:
Notable locations in Pope County: Buzzards Roost (A), Gentry Landing (B), Sellers Landing (C), Spees Landing (D), Karbers Ridge Recreatrion Site (E), Illinois Furnace Picnic Area (F), Iron Furnace Point of Interest (G), Camp Cadiz (H), Tower Rock Camp and Picnic Area (I), Hobbs Fish Farm (J). Display/hide their locations on the map
Churches in Pope County include: Richland Church (A), Antioch Church (B), Bethany Church (C), Central Church (D), Good Hope Church (E), Honeycomb Church (F), Karbers Ridge Church (G), Levee Pond Church (H), Mount Zion Church (I). Display/hide their locations on the map
Cemeteries: Rutherford Cemetery (1), Brown Cemetery (2), Lavender Cemetery (3), Hobbs Cemetery (4), Waters Cemetery (5), Twitchell Cemetery (6), Troutman Cemetery (7). Display/hide their locations on the map
Lakes and reservoirs: Lake Tacumseh (A), Whoopie Cat Lake (B), Humm Lake (C), Whoople Cat Lake (D). Display/hide their locations on the map
Streams, rivers, and creeks: Hogthief Creek (A), Harris Creek (B), Haney Creek (C), Cane Creek (D), Big Creek (E), Anthony Creek (F), Hosick Creek (G), Wallace Branch (H), Sheridan Branch (I). Display/hide their locations on the map
Park in Pope County: Cave-In-Rock State Park (1). Display/hide its location on the map
Neighboring counties: Mariposa County, California  , McDowell County, West Virginia
  , Greene County, Missouri , King William County, Virginia , Union County , Washington County, Kentucky .
| Here: | 3.8% |
| Illinois: | 4.2% |
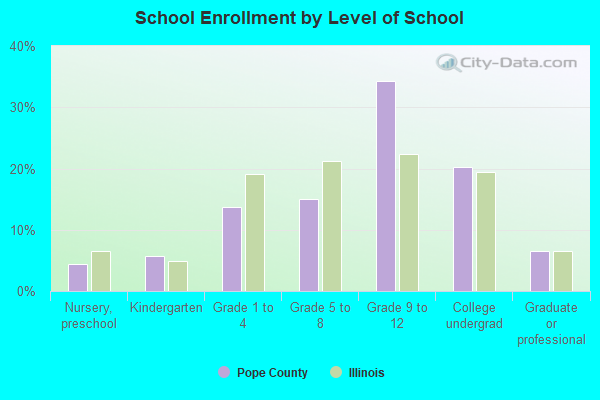
Current college students: 186
People 25 years of age or older with a high school degree or higher: 88.2%
People 25 years of age or older with a bachelor's degree or higher: 15.4%
Number of foreign born residents: 36 (30.7% naturalized citizens)
| Pope County: | 1.0% |
| Whole state: | 14.4% |
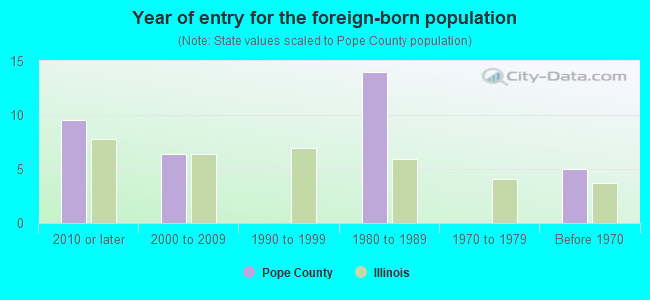
- Year of entry for the foreign-born population
- 102010 or later
- 62000 to 2009
- 01990 to 1999
- 141980 to 1989
- 01970 to 1979
- 5Before 1970
Mean travel time to work (commute): minutes
Percentage of county residents living and working in this county: 74.6%

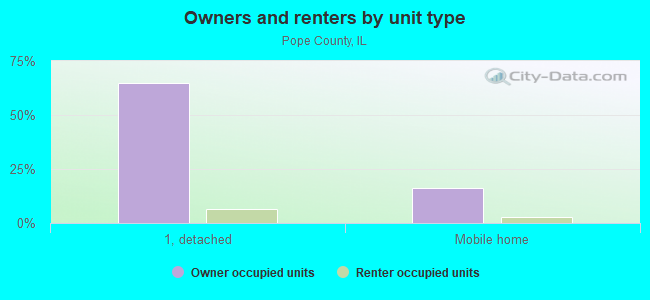
Housing units in structures:
- One, detached: 1,691
- One, attached: 11
- Two: 47
- 3 or 4: 41
- 5 to 9: 11
- 10 to 19: 7
- Mobile homes: 471
- Boats, RVs, vans, etc.: 6
Housing units in Pope County with a mortgage: 402 (29 second mortgage, 0 home equity loan, 29 both second mortgage and home equity loan)
Houses without a mortgage: 8
| Here: | 98.0% with mortgage |
| State: | 97.4% with mortgage |
Religion statistics for Pope County
| Religion | Adherents | Congregations |
|---|---|---|
| Evangelical Protestant | 1,105 | 9 |
| Mainline Protestant | 99 | 2 |
| Other | 2 | - |
| None | 3,264 | - |
Source: Clifford Grammich, Kirk Hadaway, Richard Houseal, Dale E.Jones, Alexei Krindatch, Richie Stanley and Richard H.Taylor. 2012. 2010 U.S.Religion Census: Religious Congregations & Membership Study. Association of Statisticians of American Religious Bodies. Jones, Dale E., et al. 2002. Congregations and Membership in the United States 2000. Nashville, TN: Glenmary Research Center.
Food Environment Statistics:
| Pope County: | 2.43 / 10,000 pop. |
| State: | 2.24 / 10,000 pop. |
| Pope County: | 7.30 / 10,000 pop. |
| Illinois: | 2.61 / 10,000 pop. |
| This county: | 12.17 / 10,000 pop. |
| State: | 6.86 / 10,000 pop. |
| Pope County: | 9.7% |
| Illinois: | 8.3% |
| Pope County: | 27.4% |
| State: | 25.2% |
Agriculture in Pope County:
Average size of farms: 226 acresAverage value of agricultural products sold per farm: $12,630
Average value of crops sold per acre for harvested cropland: $105.06
The value of nursery, greenhouse, floriculture, and sod as a percentage of the total market value of agricultural products sold: 0.00%
The value of livestock, poultry, and their products as a percentage of the total market value of agricultural products sold: 32.49%
Average total farm production expenses per farm: $11,438
Harvested cropland as a percentage of land in farms: 35.97%
Irrigated harvested cropland as a percentage of land in farms: 1.47%
Average market value of all machinery and equipment per farm: $27,515
The percentage of farms operated by a family or individual: 92.96%
Average age of principal farm operators: 60 years
Average number of cattle and calves per 100 acres of all land in farms: 9.08
Corn for grain: 4162 harvested acres
All wheat for grain: 678 harvested acres
Soybeans for beans: 15317 harvested acres
Tornado activity:
Pope County historical area-adjusted tornado activity is significantly below Illinois state average. It is 18551510.2 times below overall U.S. average.Earthquake activity:
Pope County-area historical earthquake activity is significantly above Illinois state average. It is 293% greater than the overall U.S. average.On 4/18/2008 at 09:36:59, a magnitude 5.4 (5.1 MB, 4.8 MS, 5.4 MW, 5.2 MW, Class: Moderate, Intensity: VI - VII) earthquake occurred 81.2 miles away from Pope County center
On 4/18/2008 at 09:36:59, a magnitude 5.2 (5.2 MW, Depth: 8.9 mi) earthquake occurred 81.1 miles away from the county center
On 9/26/1990 at 13:18:51, a magnitude 5.0 (4.7 MB, 4.8 LG, 5.0 LG, Depth: 7.7 mi) earthquake occurred 55.6 miles away from the county center
On 6/18/2002 at 17:37:15, a magnitude 5.0 (4.3 MB, 4.6 MW, 5.0 LG) earthquake occurred 58.9 miles away from the county center
On 6/10/1987 at 23:48:54, a magnitude 5.1 (4.9 MB, 4.4 MS, 4.6 MS, 5.1 LG) earthquake occurred 104.4 miles away from Pope County center
On 5/4/1991 at 01:18:54, a magnitude 5.0 (4.4 MB, 4.6 LG, 5.0 LG, Depth: 3.1 mi) earthquake occurred 90.6 miles away from the county center
Magnitude types: regional Lg-wave magnitude (LG), body-wave magnitude (MB), surface-wave magnitude (MS), moment magnitude (MW)
Most recent natural disasters:
- Illinois Covid-19 Pandemic, Incident Period: January 20, 2020, FEMA Id: 4489, Natural disaster type: Other
- Illinois Severe Storms, Straight-line Winds, and Tornadoes, Incident Period: November 17, 2013 to November 18, 2013, Major Disaster (Presidential) Declared DR-4157: November 26, 2013, FEMA Id: 4157, Natural disaster type: Storm, Tornado, Wind
- Illinois Severe Storms and Flooding, Incident Period: April 19, 2011 to June 14, 2011, Major Disaster (Presidential) Declared DR-1991: June 07, 2011, FEMA Id: 1991, Natural disaster type: Storm, Flood
- Illinois Severe Winter Storm, Incident Period: January 26, 2009 to January 28, 2009, Major Disaster (Presidential) Declared DR-1826: March 02, 2009, FEMA Id: 1826, Natural disaster type: Winter Storm
- Illinois Hurricane Katrina Evacuation, Incident Period: August 29, 2005 to October 01, 2005, Emergency Declared EM-3230: September 07, 2005, FEMA Id: 3230, Natural disaster type: Hurricane
- Illinois Snow, Incident Period: December 21, 2004 to December 23, 2004, Emergency Declared EM-3199: February 01, 2005, FEMA Id: 3199, Natural disaster type: Snow
- Illinois Severe Storms, Tornadoes, and Flooding, Incident Period: May 06, 2003 to May 11, 2003, Major Disaster (Presidential) Declared DR-1469: May 15, 2003, FEMA Id: 1469, Natural disaster type: Storm, Tornado, Flood
- Illinois Severe Storms, Tornadoes, and Flooding, Incident Period: April 21, 2002 to May 23, 2002, Major Disaster (Presidential) Declared DR-1416: May 21, 2002, FEMA Id: 1416, Natural disaster type: Storm, Tornado, Flood
- Illinois Severe Storms and Flooding, Incident Period: March 01, 1997 to April 01, 1997, Major Disaster (Presidential) Declared DR-1170: March 21, 1997, FEMA Id: 1170, Natural disaster type: Storm, Flood
- Illinois Flooding, Severe Storms, Incident Period: April 13, 1993 to October 22, 1993, Major Disaster (Presidential) Declared DR-997: July 09, 1993, FEMA Id: 997, Natural disaster type: Storm, Flood
- 1 other natural disasters have been reported since 1953.
The number of natural disasters in Pope County (11) is smaller than the US average (15).
Major Disasters (Presidential) Declared: 8
Emergencies Declared: 2
Causes of natural disasters: Storms: 7, Floods: 6, Tornadoes: 3, Hurricane: 1, Snow: 1, Wind: 1, Winter Storm: 1, Other: 1 (Note: some incidents may be assigned to more than one category).
Means of transportation to work:
- Drove a car alone: 459 (67.4%)
- Carpooled: 83 (12.2%)
- Taxicab, motorcycle, or other means: 24 (3.5%)
- Worked at home: 131 (19.2%)

- Health care and social assistance (45%)
- Retail trade (19%)
- Educational services (16%)
- Accommodation and food services (11%)
- Other services, except public administration (9%)
- Finance and insurance (4%)
- Public administration (4%)
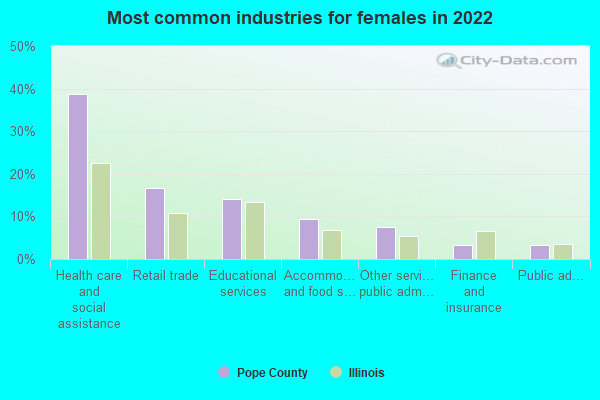
- Health care and social assistance (39%)
- Retail trade (17%)
- Educational services (14%)
- Accommodation and food services (9%)
- Other services, except public administration (8%)
- Finance and insurance (3%)
- Public administration (3%)
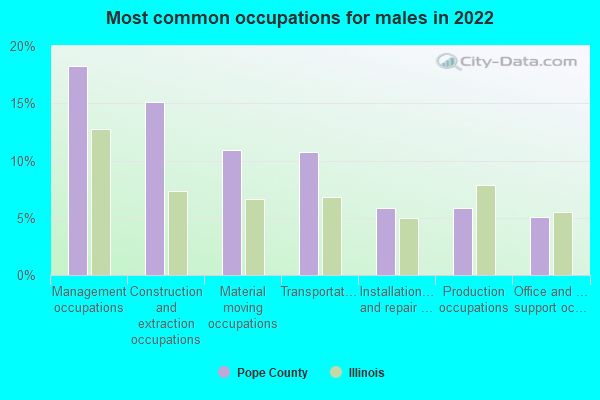
- Management occupations (18%)
- Construction and extraction occupations (15%)
- Material moving occupations (11%)
- Transportation occupations (11%)
- Installation, maintenance, and repair occupations (6%)
- Production occupations (6%)
- Office and administrative support occupations (5%)
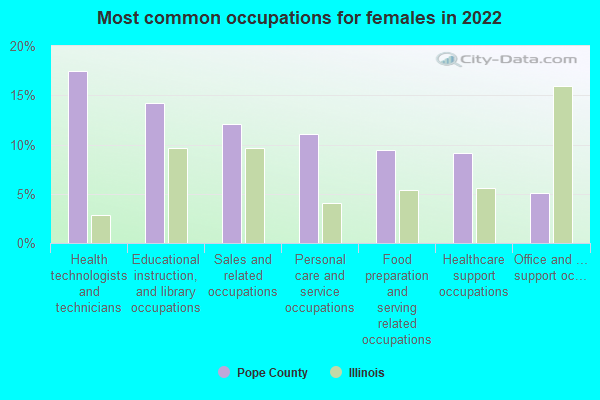
- Health technologists and technicians (17%)
- Educational instruction, and library occupations (14%)
- Sales and related occupations (12%)
- Personal care and service occupations (11%)
- Food preparation and serving related occupations (9%)
- Healthcare support occupations (9%)
- Office and administrative support occupations (5%)
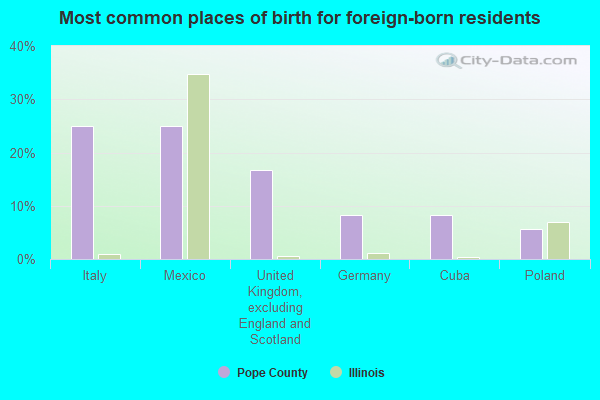
- Italy (25%)
- Mexico (25%)
- United Kingdom, excluding England and Scotland (17%)
- Germany (8%)
- Cuba (8%)
- Poland (6%)
- Norway (0%)
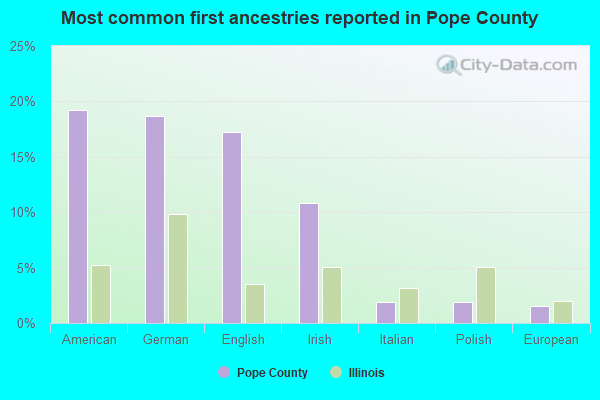
- American (19%)
- German (19%)
- English (17%)
- Irish (11%)
- Italian (2%)
- Polish (2%)
- European (2%)
People in group quarters in Pope County, Illinois in 2010:
- 175 people in workers' group living quarters and job corps centers
- 173 people in state prisons
- 33 people in nursing facilities/skilled-nursing facilities
- 8 people in group homes intended for adults
People in group quarters in Pope County, Illinois in 2000:
- 214 people in job corps and vocational training facilities
- 55 people in nursing homes
- 12 people in other group homes
- 6 people in homes for the mentally ill
6.67% of this county's 2021 resident taxpayers lived in other counties in 2020 ($47,256 average adjusted gross income)
| Here: | 6.67% |
| Illinois average: | 5.09% |
10 or fewer of this county's residents moved from foreign countries.
6.67% relocated from other counties in Illinois ($47,256 average AGI)
10 or fewer of this county's residents relocated from other states.
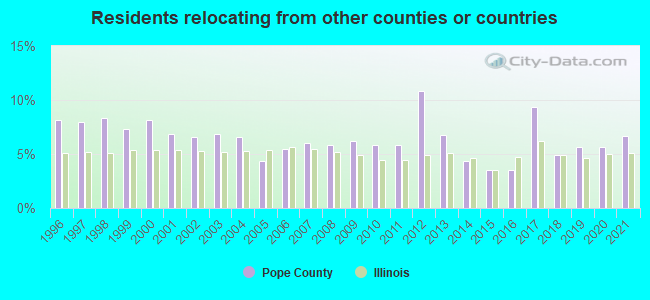
5.62% of this county's 2020 resident taxpayers moved to other counties in 2021 ($46,320 average adjusted gross income)
| Here: | 5.62% |
| Illinois average: | 6.10% |
10 or fewer of this county's residents moved to foreign countries.
4.04% relocated to other counties in Illinois ($33,173 average AGI)
1.57% relocated to other states ($13,147 average AGI)
Pope County: 1.57% Illinois average: 3.06%

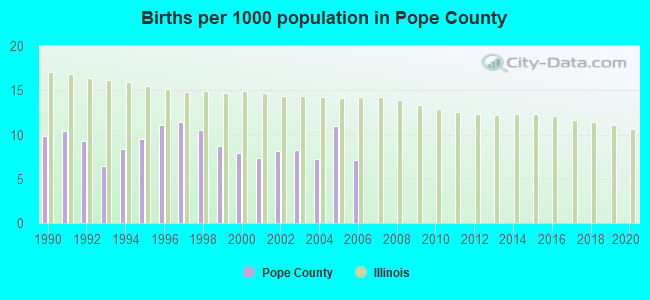
Births per 1000 population from 1990 to 1999: 9.6
Births per 1000 population from 2000 to 2006: 8.1
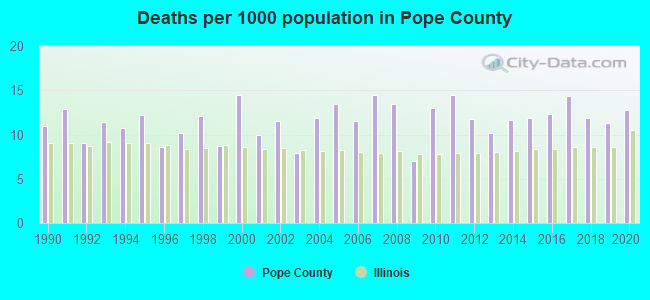
Deaths per 1000 population from 1990 to 1999: 10.7
Deaths per 1000 population from 2000 to 2009: 11.5
Deaths per 1000 population from 2010 to 2020: 12.3
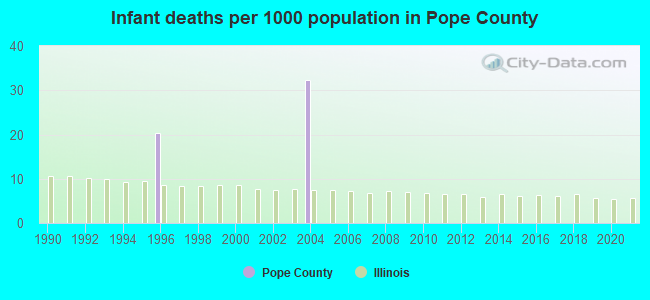
Infant deaths per 1000 live births from 1990 to 1999: 2.0
Infant deaths per 1000 live births from 2000 to 2006: 4.6
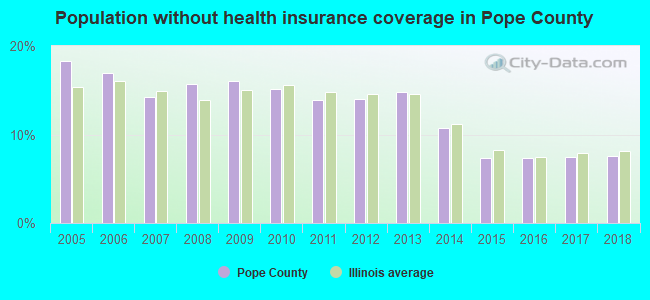
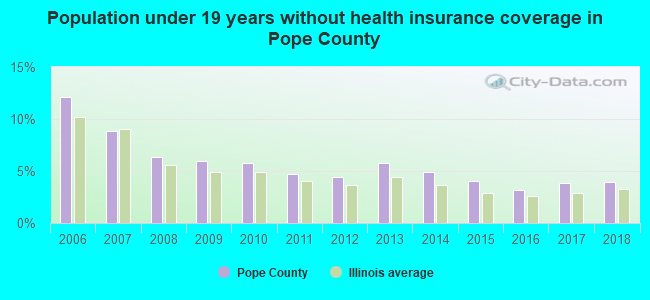
Persons under 19 years old without health insurance coverage in 2018: 3.9%
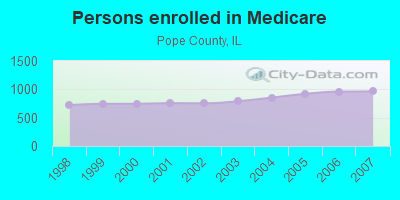
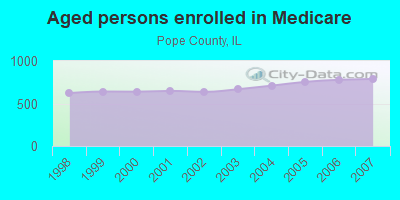
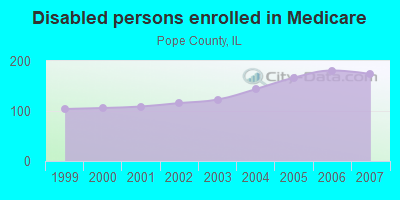
Persons enrolled in hospital insurance and/or supplemental medical insurance (Medicare) in July 1, 2007: 963 (789 aged, 174 disabled)
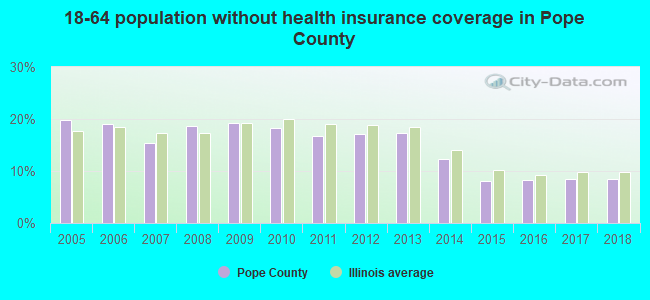
Children under 18 without health insurance coverage in 2007: 72 (10%)
Most common underlying causes of death in Pope County, Illinois in 1999 - 2019:
- Acute myocardial infarction, unspecified (10)
Population without health insurance coverage in 2000: 12%
Children under 18 without health insurance coverage in 2000: 9%
Medical specialist MDs per 100,000 population in 2005: 950
Total births per 100,000 population, July 2005 - July 2006 : 21
Total deaths per 100,000 population, July 2005 - July 2006: 24
Household type by relationship:
Households: 3,746- Male householders: 810 (273 living alone), Female householders: 557 (228 living alone)
720 spouses (720 opposite-sex spouses), 49 unmarried partners, (49 opposite-sex unmarried partners), 883 children (778 natural, 57 adopted, 48 stepchildren), 74 grandchildren, 158 brothers or sisters, 19 parents, 6 foster children, 135 other relatives, 125 non-relatives
- In group quarters: 181
Size of family households: 490 2-persons, 159 3-persons, 116 4-persons, 67 5-persons, 23 6-persons.
Size of nonfamily households: 502 1-person, 11 2-persons.
232 married couples with children.
183 single-parent households (25 men, 158 women).
95.8% of residents of Pope speak English at home.
3.5% of residents speak Spanish at home (78% speak English very well, 22% speak English well).
0.5% of residents speak other Indo-European language at home (89% speak English very well, 11% speak English not well).
In fiscal year 2004:
Federal Government expenditure: $33,121,000 ($7,683 per capita)
Department of Defense expenditure: $3,759,000
Federal direct payments to individuals for retirement and disability: $12,349,000
Federal other direct payments to individuals: $6,425,000
Federal direct payments not to individuals: $2,038,000
Federal grants: $4,665,000
Federal procurement contracts: $3,798,000 ($2,815,000 Department of Defense)
Federal salaries and wages: $3,845,000 ($469,000 Department of Defense)
Federal Government direct loans: $90,000
Federal guaranteed/insured loans: $252,000
Federal Government insurance: $1,191,000
Population change from April 1, 2000 to July 1, 2005:
Births: 170| Here: | 40 per 1000 residents |
| State: | 75 per 1000 residents |
Deaths: 214
| Here: | 51 per 1000 residents |
| State: | 43 per 1000 residents |
Net international migration: +1
| Here: | +0 per 1000 residents |
| State: | +26 per 1000 residents |
Net internal migration: -146
| Here: | |
| State: |
Total withdrawal of fresh water for public supply: 0.00 millions of gallons per day (all from surface)
| Here: | 5.8 |
| State: | 6.4 |
| Here: | 3.6 |
| State: | 4.1 |
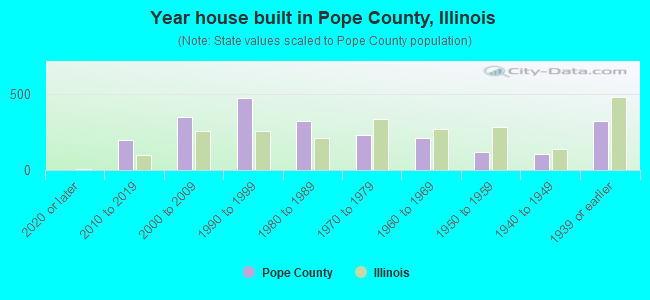
- Year house built in Pope County, Illinois
- 02020 or later
- 1992010 to 2019
- 3472000 to 2009
- 4701990 to 1999
- 3211980 to 1989
- 2301970 to 1979
- 2091960 to 1969
- 1191950 to 1959
- 1021940 to 1949
- 3221939 or earlier
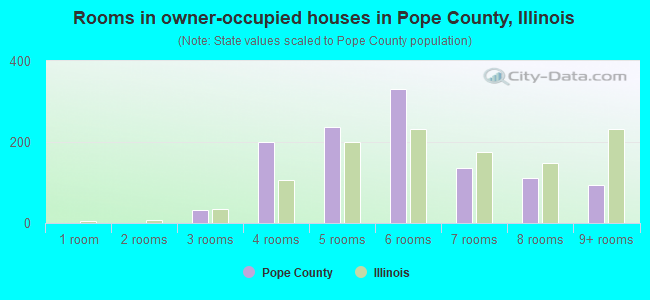
- Rooms in owner-occupied houses in Pope County, Illinois
- 01 room
- 02 rooms
- 313 rooms
- 1994 rooms
- 2375 rooms
- 3326 rooms
- 1357 rooms
- 1118 rooms
- 949+ rooms
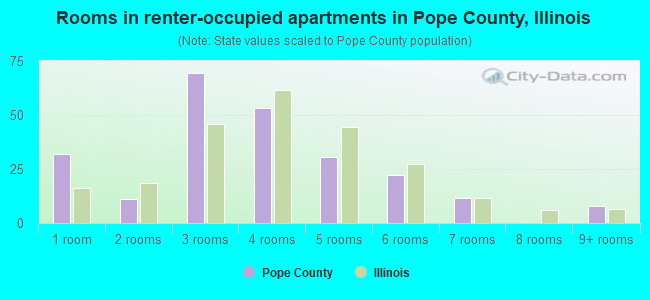
- Rooms in renter-occupied apartments in Pope County, Illinois
- 321 room
- 112 rooms
- 703 rooms
- 534 rooms
- 305 rooms
- 226 rooms
- 127 rooms
- 08 rooms
- 89+ rooms
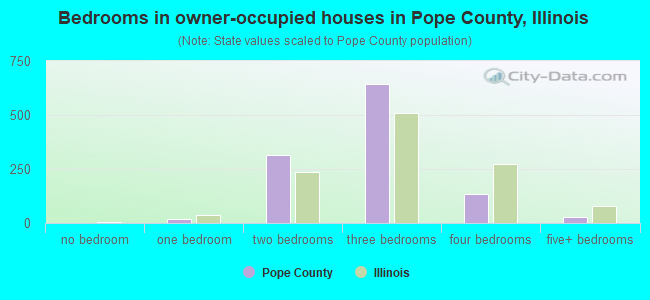
- Bedrooms in owner-occupied houses in Pope County, Illinois
- 0no bedroom
- 171 bedroom
- 3162 bedrooms
- 6433 bedrooms
- 1324 bedrooms
- 285+ bedrooms
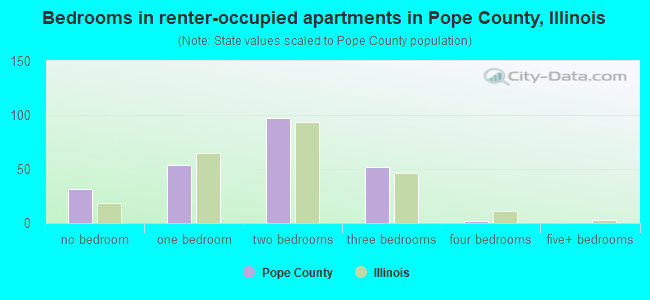
- Bedrooms in renter-occupied apartments in Pope County, Illinois
- 32no bedroom
- 531 bedroom
- 972 bedrooms
- 523 bedrooms
- 24 bedrooms
- 05+ bedrooms
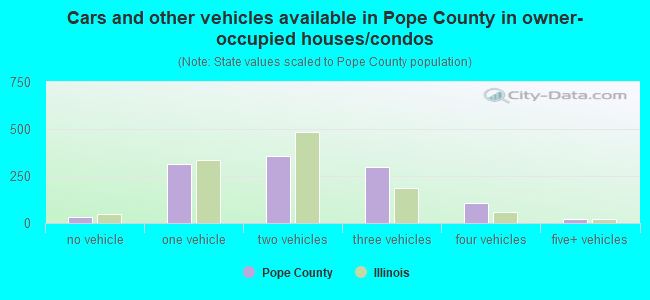
- Cars and other vehicles available in Pope County in owner-occupied houses/condos
- 31no vehicle
- 3131 vehicle
- 3592 vehicles
- 2983 vehicles
- 1094 vehicles
- 235+ vehicles
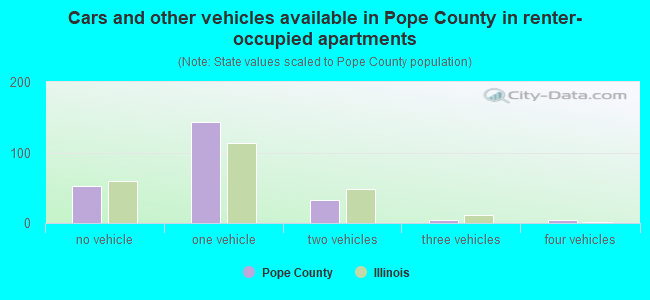
- Cars and other vehicles available in Pope County in renter-occupied apartments
- 53no vehicle
- 1431 vehicle
- 332 vehicles
- 43 vehicles
- 44 vehicles
- 05+ vehicles
86.7% of Pope County residents lived in the same house 1 years ago.
Out of people who lived in different houses, 22% lived in this county.
Out of people who lived in different counties, 34% lived in Illinois.
| Pope County: | 86.7% |
| State average: | 88.3% |
Place of birth for U.S.-born residents:
- This state: 2,310
- Other state: 1,395
- Northeast: 22
- Midwest: 448
- South: 878
- West: 18
- 41.1%Electricity
- 40.0%Bottled, tank, or LP gas
- 15.8%Utility gas
- 1.9%Wood
- 1.0%Other fuel
- 0.3%Fuel oil, kerosene, etc.
- 47.4%Utility gas
- 44.4%Electricity
- 7.7%Bottled, tank, or LP gas
- 0.4%No fuel used
Private vs. public school enrollment:
| Here: | 2.1% |
| Illinois: | 13.3% |
| Here: | 24.6% |
| Illinois: | 9.9% |
| Here: | 0.0% |
| Illinois: | 27.4% |
Pope County government finances - Expenditure in 2017:
- Charges - Other: $197,000
Regular Highways: $3,000
- Current Operations - Regular Highways: $1,029,000
General - Other: $625,000
Judicial and Legal Services: $430,000
Central Staff Services: $329,000
Police Protection: $252,000
- General - Interest on Debt: $16,000
- Local Intergovernmental - Highways: $47,000
- Long Term Debt - Beginning Outstanding - Unspecified Public Purpose: $363,000
Outstanding Unspecified Public Purpose: $324,000
Retired Unspecified Public Purpose: $39,000
Beginning Outstanding - Public Debt for Private Purpose: $25,000
Outstanding Nonguaranteed - Industrial Revenue: $25,000
- Miscellaneous - Fines and Forfeits: $64,000
General Revenue - Other: $27,000
Special Assessments: $9,000
Interest Earnings: $6,000
- Other Capital Outlay - Regular Highways: $60,000
Police Protection: $52,000
Central Staff Services: $12,000
General - Other: $4,000
- Other Funds - Cash and Securities: $4,067,000
- Sinking Funds - Cash and Securities: $25,000
- State Intergovernmental - Highways: $629,000
General Local Government Support: $492,000
Other: $286,000
- Tax - Property: $710,000
Other: $434,000
Other Selective Sales: $247,000
- Total Salaries and Wages: $1,001,000
Pope County government finances - Revenue in 2017:
- Charges - Other: $197,000
Regular Highways: $3,000
- Current Operations - Regular Highways: $1,029,000
General - Other: $625,000
Judicial and Legal Services: $430,000
Central Staff Services: $329,000
Police Protection: $252,000
- General - Interest on Debt: $16,000
- Local Intergovernmental - Highways: $47,000
- Long Term Debt - Beginning Outstanding - Unspecified Public Purpose: $363,000
Outstanding Unspecified Public Purpose: $324,000
Retired Unspecified Public Purpose: $39,000
Beginning Outstanding - Public Debt for Private Purpose: $25,000
Outstanding Nonguaranteed - Industrial Revenue: $25,000
- Miscellaneous - Fines and Forfeits: $64,000
General Revenue - Other: $27,000
Special Assessments: $9,000
Interest Earnings: $6,000
- Other Capital Outlay - Regular Highways: $60,000
Police Protection: $52,000
Central Staff Services: $12,000
General - Other: $4,000
- Other Funds - Cash and Securities: $4,067,000
- Sinking Funds - Cash and Securities: $25,000
- State Intergovernmental - Highways: $629,000
General Local Government Support: $492,000
Other: $286,000
- Tax - Property: $710,000
Other: $434,000
Other Selective Sales: $247,000
- Total Salaries and Wages: $1,001,000
Pope County government finances - Debt in 2017:
- Charges - Other: $197,000
Regular Highways: $3,000
- Current Operations - Regular Highways: $1,029,000
General - Other: $625,000
Judicial and Legal Services: $430,000
Central Staff Services: $329,000
Police Protection: $252,000
- General - Interest on Debt: $16,000
- Local Intergovernmental - Highways: $47,000
- Long Term Debt - Beginning Outstanding - Unspecified Public Purpose: $363,000
Outstanding Unspecified Public Purpose: $324,000
Retired Unspecified Public Purpose: $39,000
Beginning Outstanding - Public Debt for Private Purpose: $25,000
Outstanding Nonguaranteed - Industrial Revenue: $25,000
- Miscellaneous - Fines and Forfeits: $64,000
General Revenue - Other: $27,000
Special Assessments: $9,000
Interest Earnings: $6,000
- Other Capital Outlay - Regular Highways: $60,000
Police Protection: $52,000
Central Staff Services: $12,000
General - Other: $4,000
- Other Funds - Cash and Securities: $4,067,000
- Sinking Funds - Cash and Securities: $25,000
- State Intergovernmental - Highways: $629,000
General Local Government Support: $492,000
Other: $286,000
- Tax - Property: $710,000
Other: $434,000
Other Selective Sales: $247,000
- Total Salaries and Wages: $1,001,000
Pope County government finances - Cash and Securities in 2017:
- Charges - Other: $197,000
Regular Highways: $3,000
- Current Operations - Regular Highways: $1,029,000
General - Other: $625,000
Judicial and Legal Services: $430,000
Central Staff Services: $329,000
Police Protection: $252,000
- General - Interest on Debt: $16,000
- Local Intergovernmental - Highways: $47,000
- Long Term Debt - Beginning Outstanding - Unspecified Public Purpose: $363,000
Outstanding Unspecified Public Purpose: $324,000
Retired Unspecified Public Purpose: $39,000
Beginning Outstanding - Public Debt for Private Purpose: $25,000
Outstanding Nonguaranteed - Industrial Revenue: $25,000
- Miscellaneous - Fines and Forfeits: $64,000
General Revenue - Other: $27,000
Special Assessments: $9,000
Interest Earnings: $6,000
- Other Capital Outlay - Regular Highways: $60,000
Police Protection: $52,000
Central Staff Services: $12,000
General - Other: $4,000
- Other Funds - Cash and Securities: $4,067,000
- Sinking Funds - Cash and Securities: $25,000
- State Intergovernmental - Highways: $629,000
General Local Government Support: $492,000
Other: $286,000
- Tax - Property: $710,000
Other: $434,000
Other Selective Sales: $247,000
- Total Salaries and Wages: $1,001,000
Supplemental Security Income (SSI) in 2006:
- Total number of recipients: 123
- Number of aged recipients: 19
- Number of blind and disabled recipients: 104
- Number of recipients under 18: 7
- Number of recipients between 18 and 64: 89
- Number of recipients older than 64: 27
- Number of recipients also receiving OASDI: 52
- Amount of payments (thousands of dollars): 49
| Most common first names in Pope County, IL among deceased individuals | ||
| Name | Count | Lived (average) |
|---|---|---|
| James | 36 | 74.7 years |
| John | 28 | 79.0 years |
| William | 27 | 72.4 years |
| Mary | 24 | 77.7 years |
| Charles | 18 | 73.9 years |
| Robert | 16 | 75.7 years |
| George | 13 | 77.9 years |
| Helen | 12 | 81.4 years |
| Clarence | 11 | 80.1 years |
| Martha | 10 | 85.9 years |
| Most common last names in Pope County, IL among deceased individuals | ||
| Last name | Count | Lived (average) |
|---|---|---|
| Taylor | 22 | 75.5 years |
| Baker | 14 | 80.8 years |
| Smith | 13 | 74.9 years |
| Williams | 13 | 76.7 years |
| Jones | 13 | 77.6 years |
| Duncan | 12 | 81.2 years |
| Cox | 12 | 80.1 years |
| Davis | 12 | 85.6 years |
| Joiner | 11 | 74.8 years |
| Barger | 11 | 79.0 years |