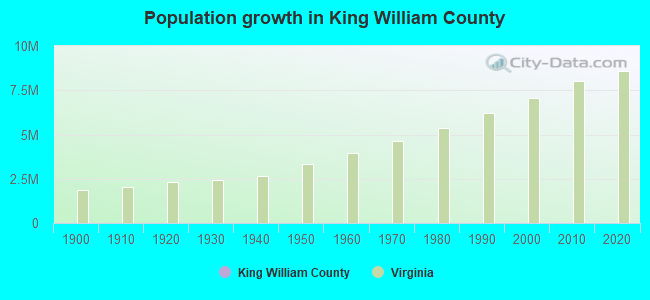
King William County, Virginia (VA)
County owner-occupied free and clear houses and condos in 2010: 1,255
County owner-occupied houses and condos in 2000: 4,122
Renter-occupied apartments: 1,033 (it was 724 in 2000)
| % of renters here: | 15% |
| State: | 33% |
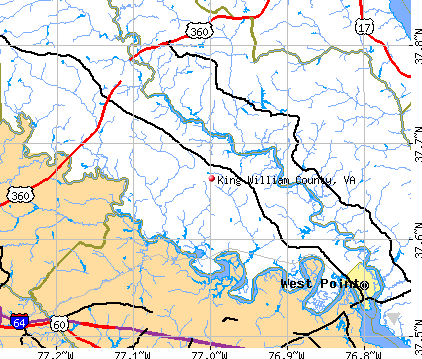
Land area: 275 sq. mi.
Water area: 10.2 sq. mi.
Population density: 65 people per square mile (average).
Industries providing employment: Educational, health and social services (21.4%), Retail trade (12.2%), Manufacturing (10.1%).
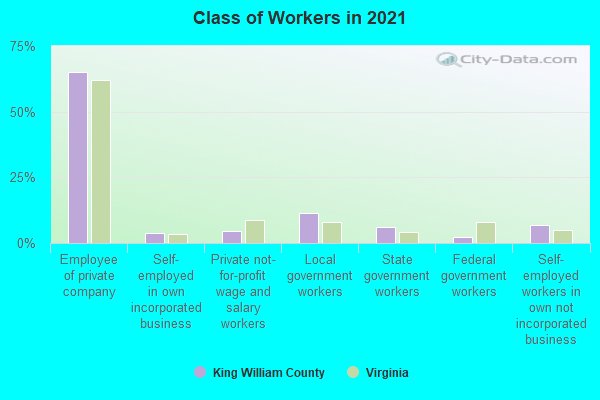
Type of workers:
- Private wage or salary: 75%
- Government: 18%
- Self-employed, not incorporated: 7%
- Unpaid family work: 0%
- OSM Map
- General Map
- Google Map
- MSN Map

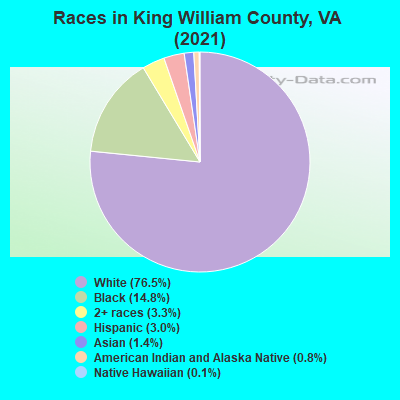
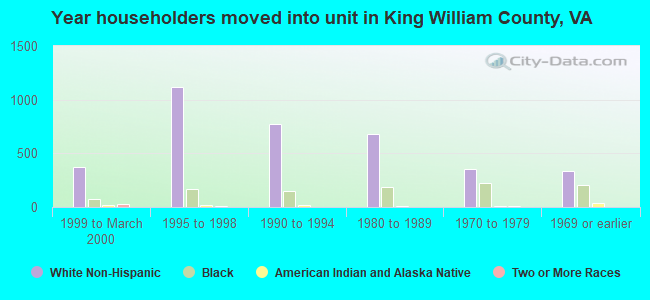
- 13,57976.4%White Non-Hispanic Alone
- 2,64314.9%Black Non-Hispanic Alone
- 6773.8%Two or more races
- 5453.1%Hispanic or Latino
- 1680.9%American Indian and Alaska Native alone
- 1380.8%Asian alone
- 140.08%Native Hawaiian and Other
Pacific Islander alone - 20.01%Some other race alone
| Median resident age: | 41.1 years |
| Virginia median age: | 39.0 years |
| Males: 8,905 | |
| Females: 9,062 |

 | New York Teacher Moving to Richmond Virginia (5 replies) |
| Looking into Richmond area (7 replies) |
| Over 55 - any local communities other than retirement homes? (8 replies) |
| Commute to/from Richmond on Rt 360? (4 replies) |
| Cool pix-abandoned Virginia (3 replies) |
| Moving to Virgina and need advice (15 replies) |
| King William County: | 2.0 people |
| Virginia: | 3 people |
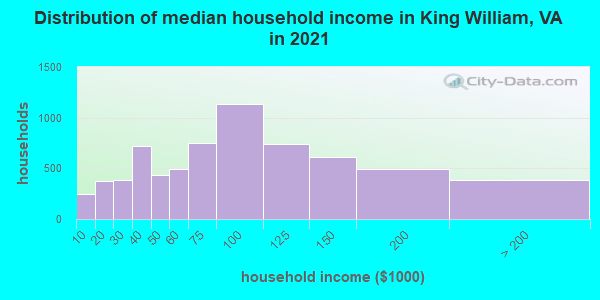
Estimated median household income in 2022: $78,145 ($49,876 in 1999)
| This county: | $78,145 |
| Virginia: | $85,873 |
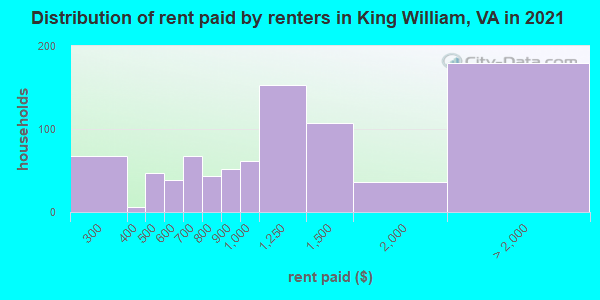
Median contract rent in 2022 for apartments: $1,066 (lower quartile is $727, upper quartile is $1,322)
| This county: | $1066 |
| State: | $1270 |
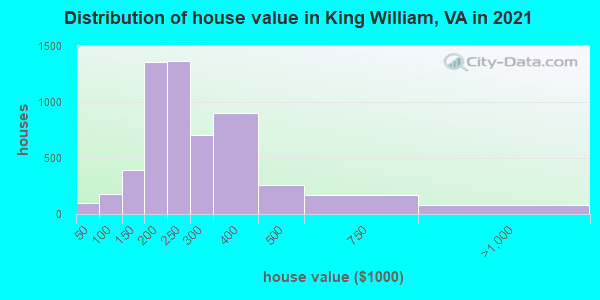
Estimated median house or condo value in 2022: $271,423 (it was $104,500 in 2000)
| King William: | $271,423 |
| Virginia: | $365,700 |
Mean price in 2022:
Median monthly housing costs for homes and condos with a mortgage: $1,474Detached houses: $295,931
Here: $295,931 State: $472,865 Townhouses or other attached units: $243,699
Here: $243,699 State: $457,437 Mobile homes: $143,571
Here: $143,571 State: $100,736
Median monthly housing costs for units without a mortgage: $463
Institutionalized population: 70
Crime in 2021 (reported by the sheriff's office or county police, not the county total):
- Murders: 0
- Rapes: 5
- Robberies: 0
- Assaults: 19
- Burglaries: 6
- Thefts: 76
- Auto thefts: 3
Crime in 2020 (reported by the sheriff's office or county police, not the county total):
- Murders: 0
- Rapes: 1
- Robberies: 1
- Assaults: 15
- Burglaries: 5
- Thefts: 62
- Auto thefts: 4
Health of residents in King William County based on CDC Behavioral Risk Factor Surveillance System Survey Questionnaires from 2013 to 2021:
General health status score of residents in this county from 1 (poor) to 5 (excellent) is 3.5. This is about average.73.5% of residents exercised in the past month. This is about average.
42.1% of residents smoked 100+ cigarettes in their lives. This is about average.
54.8% of adult residents drank alcohol in the past 30 days. This is less than average.
74.3% of residents visited a dentist within the past year. This is about average.
Average weight of males is 200 pounds. This is more than average.
Average weight of females is 167 pounds. This is more than average.
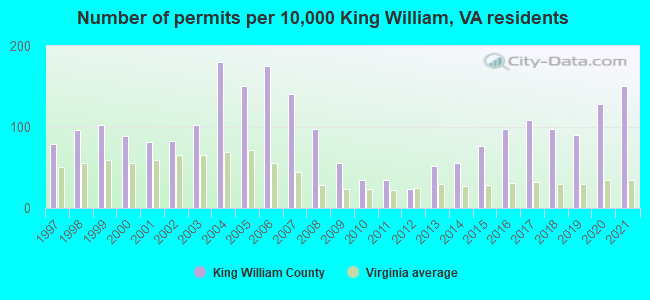
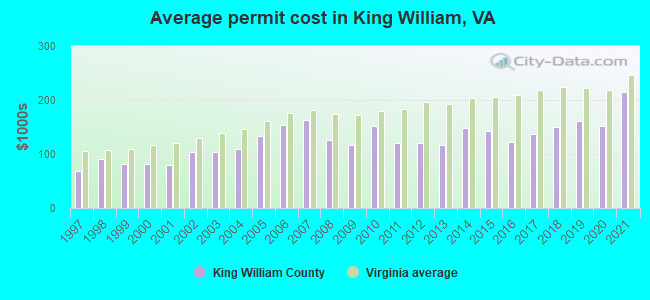
Single-family new house construction building permits:
- 2022: 125 buildings, average cost: $187,800
- 2021: 198 buildings, average cost: $213,800
- 2020: 169 buildings, average cost: $152,200
- 2019: 118 buildings, average cost: $160,800
- 2018: 129 buildings, average cost: $149,600
- 2017: 143 buildings, average cost: $137,400
- 2016: 129 buildings, average cost: $121,800
- 2015: 100 buildings, average cost: $143,100
- 2014: 74 buildings, average cost: $149,000
- 2013: 69 buildings, average cost: $116,400
- 2012: 32 buildings, average cost: $120,600
- 2011: 45 buildings, average cost: $120,000
- 2010: 45 buildings, average cost: $151,500
- 2009: 73 buildings, average cost: $115,900
- 2008: 127 buildings, average cost: $125,900
- 2007: 185 buildings, average cost: $162,600
- 2006: 230 buildings, average cost: $153,200
- 2005: 199 buildings, average cost: $133,300
- 2004: 236 buildings, average cost: $109,400
- 2003: 134 buildings, average cost: $104,200
- 2002: 109 buildings, average cost: $102,600
- 2001: 106 buildings, average cost: $80,100
- 2000: 117 buildings, average cost: $81,700
- 1999: 136 buildings, average cost: $81,900
- 1998: 126 buildings, average cost: $89,600
- 1997: 104 buildings, average cost: $68,100
Median real estate property taxes paid for housing units with mortgages in 2022: $1,712 (0.6%)
Median real estate property taxes paid for housing units with no mortgage in 2022: $1,757 (0.7%)
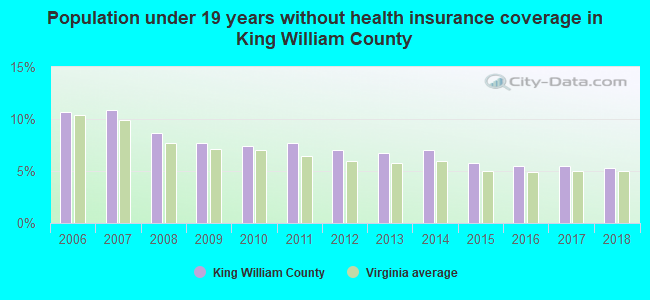
| King William County: | 8.5% |
| Virginia: | 10.6% |
Median age of residents in 2022: 41.1 years old
(Males: 38.6 years old, Females: 42.2 years old)
(Median age for: White residents: 41.4 years old, Black residents: 44.5 years old, American Indian residents: 59.4 years old, Asian residents: 62.6 years old, Hispanic or Latino residents: 20.9 years old, Other race residents: 47.2 years old)
Area name: Richmond, VA HUD Metro FMR Area
Fair market rent in 2006 for a 1-bedroom apartment in King William County is $678 a month.
Fair market rent for a 2-bedroom apartment is $757 a month.
Fair market rent for a 3-bedroom apartment is $1010 a month.
Cities in this county include: West Point, Central Garage, King William.
Neighboring counties: Summers County, West Virginia  , Pope County, Illinois , Union County, Illinois , Ste. Genevieve County, Missouri , White County, Illinois , Washington County, Kentucky , Richmond city
  .
.
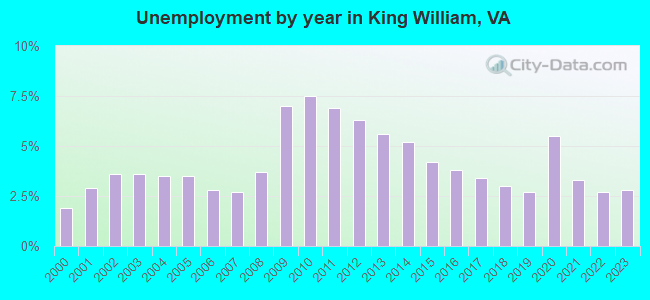
| Here: | 2.5% |
| Virginia: | 2.7% |
Current college students: 348
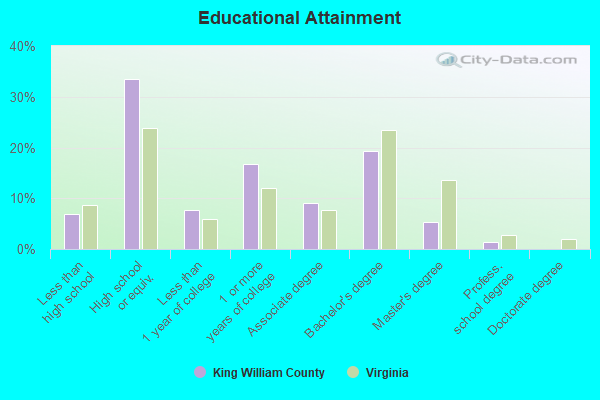
People 25 years of age or older with a high school degree or higher: 93.5%
People 25 years of age or older with a bachelor's degree or higher: 24.8%
Number of foreign born residents: 423 (78.2% naturalized citizens)
| King William County: | 2.4% |
| Whole state: | 12.7% |
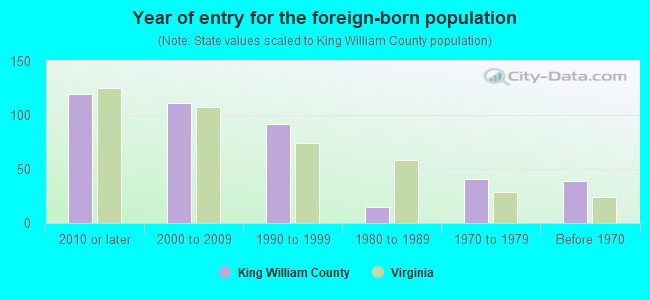
- Year of entry for the foreign-born population
- 852010 or later
- 432000 to 2009
- 1181990 to 1999
- 151980 to 1989
- 411970 to 1979
- 39Before 1970
Mean travel time to work (commute): ! minutes
Percentage of county residents living and working in this county: 100.7%
Housing units in structures:
- One, detached: 7,008
- One, attached: 158
- Two: 45
- 5 to 9: 75
- 20 or more: 54
- Mobile homes: 239
- Boats, RVs, vans, etc.: 11
Housing units in King William County with a mortgage: 4,212 (268 second mortgage, 50 home equity loan, 175 both second mortgage and home equity loan)
Houses without a mortgage: 296
| Here: | 1.3% with mortgage |
| State: | 97.2% with mortgage |
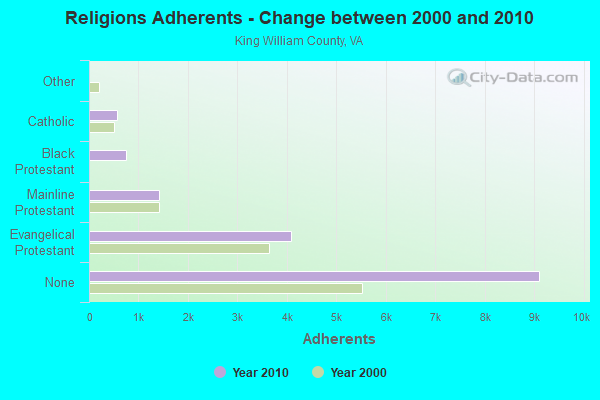
Religion statistics for King William County
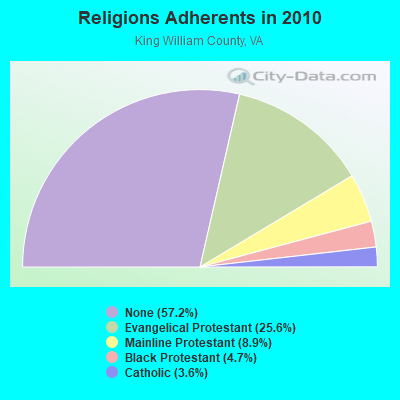
| Religion | Adherents | Congregations |
|---|---|---|
| Evangelical Protestant | 4,086 | 19 |
| Mainline Protestant | 1,424 | 9 |
| Black Protestant | 741 | 2 |
| Catholic | 569 | 1 |
| Other | 8 | - |
| None | 9,107 | - |
Source: Clifford Grammich, Kirk Hadaway, Richard Houseal, Dale E.Jones, Alexei Krindatch, Richie Stanley and Richard H.Taylor. 2012. 2010 U.S.Religion Census: Religious Congregations & Membership Study. Association of Statisticians of American Religious Bodies. Jones, Dale E., et al. 2002. Congregations and Membership in the United States 2000. Nashville, TN: Glenmary Research Center.
Food Environment Statistics:
| King William County: | 1.28 / 10,000 pop. |
| State: | 2.03 / 10,000 pop. |
| King William County: | 5.11 / 10,000 pop. |
| Virginia: | 4.03 / 10,000 pop. |
| This county: | 3.83 / 10,000 pop. |
| State: | 7.65 / 10,000 pop. |
| King William County: | 9.8% |
| Virginia: | 9.3% |
| King William County: | 29.1% |
| State: | 26.7% |
| Here: | 18.1% |
| State: | 18.6% |
Agriculture in King William County:
Average size of farms: 455 acresAverage value of agricultural products sold per farm: $106,628
Average value of crops sold per acre for harvested cropland: $378.17
The value of livestock, poultry, and their products as a percentage of the total market value of agricultural products sold: 11.83%
Average total farm production expenses per farm: $108,568
Harvested cropland as a percentage of land in farms: 54.69%
Average market value of all machinery and equipment per farm: $101,200
The percentage of farms operated by a family or individual: 81.48%
Average age of principal farm operators: 56 years
Average number of cattle and calves per 100 acres of all land in farms: 4.90
Milk cows as a percentage of all cattle and calves: 19.13%
Corn for grain: 12536 harvested acres
All wheat for grain: 5982 harvested acres
Soybeans for beans: 13693 harvested acres
Vegetables: 137 harvested acres
Earthquake activity:
King William County-area historical earthquake activity is significantly above Virginia state average. It is 57% smaller than the overall U.S. average.On 8/23/2011 at 17:51:04, a magnitude 5.8 (5.8 MW, Depth: 3.7 mi, Class: Moderate, Intensity: VI - VII) earthquake occurred 54.0 miles away from King William County center
On 12/9/2003 at 20:59:14, a magnitude 4.5 (4.5 MB, 4.5 LG, Class: Light, Intensity: IV - V) earthquake occurred 49.8 miles away from the county center
On 8/25/2011 at 05:07:52, a magnitude 4.5 (4.5 ML, Depth: 4.2 mi) earthquake occurred 56.4 miles away from the county center
On 12/9/2003 at 20:59:18, a magnitude 4.5 (4.5 ML, Depth: 6.2 mi) earthquake occurred 60.7 miles away from the county center
On 8/24/2011 at 00:04:36, a magnitude 4.2 (4.2 ML) earthquake occurred 55.1 miles away from King William County center
On 8/9/2020 at 12:07:37, a magnitude 5.1 (5.1 MW, Depth: 4.7 mi) earthquake occurred 240.4 miles away from the county center
Magnitude types: regional Lg-wave magnitude (LG), body-wave magnitude (MB), local magnitude (ML), moment magnitude (MW)
Most recent natural disasters:
- Virginia Covid-19 Pandemic, Incident Period: January 20, 2020, Major Disaster (Presidential) Declared DR-4512-VA: April 2, 2020, FEMA Id: 4512, Natural disaster type: Other
- Virginia Tropical Storm Michael, Incident Period: October 9, 2018 - October 16, 2018, FEMA Id: 4411, Natural disaster type: Tropical Storm
- Virginia Hurricane Florence, Incident Period: September 8, 2018 - September 21, 2018, FEMA Id: 4401, Natural disaster type: Hurricane
- Virginia Hurricane Sandy, Incident Period: October 26, 2012 to November 01, 2012, Emergency Declared EM-3359: October 29, 2012, FEMA Id: 3359, Natural disaster type: Hurricane
- Virginia Hurricane Irene, Incident Period: August 26, 2011 to August 28, 2011, Major Disaster (Presidential) Declared DR-4024: September 03, 2011, FEMA Id: 4024, Natural disaster type: Hurricane
- Virginia Severe Storms and Flooding, Including Severe Storms and Flooding Associated with Tropical Depression Ernesto, Incident Period: August 29, 2006 to September 07, 2006, Major Disaster (Presidential) Declared DR-1661: September 22, 2006, FEMA Id: 1661, Natural disaster type: Storm, Flood, Tropical Depression
- Virginia Hurricane Katrina Evacuation, Incident Period: August 29, 2005 to October 01, 2005, Emergency Declared EM-3240: September 12, 2005, FEMA Id: 3240, Natural disaster type: Hurricane
- Virginia Severe Storms, Flooding and Tornadoes Associated with Tropical Depression Gaston, Incident Period: August 30, 2004 to September 08, 2004, Major Disaster (Presidential) Declared DR-1544: September 03, 2004, FEMA Id: 1544, Natural disaster type: Storm, Tornado, Flood, Tropical Depression
- Virginia Hurricane Isabel, Incident Period: September 18, 2003 to October 01, 2003, Major Disaster (Presidential) Declared DR-1491: September 18, 2003, FEMA Id: 1491, Natural disaster type: Hurricane
- Virginia Winter Storm, Incident Period: January 25, 2000 to January 30, 2000, Major Disaster (Presidential) Declared DR-1318: February 28, 2000, FEMA Id: 1318, Natural disaster type: Winter Storm
- 8 other natural disasters have been reported since 1953.
The number of natural disasters in King William County (18) is near the US average (15).
Major Disasters (Presidential) Declared: 12
Emergencies Declared: 4
Causes of natural disasters: Hurricanes: 7, Floods: 4, Storms: 4, Tropical Depressions: 2, Tropical Storms: 2, Winter Storms: 2, Blizzard: 1, Drought: 1, Ice Storm: 1, Tornado: 1, Other: 1 (Note: some incidents may be assigned to more than one category).
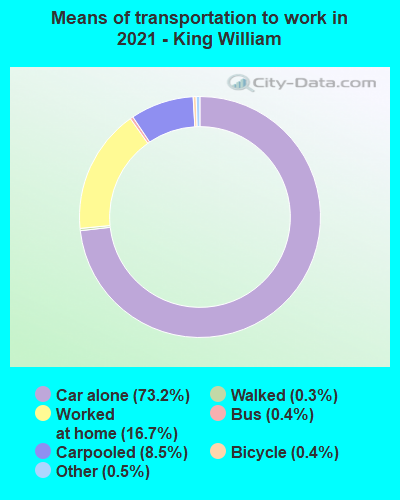
Means of transportation to work:
- Drove a car alone: 3,943 (69.4%)
- Carpooled: 448 (7.9%)
- Ferryboat: 14 (0.2%)
- Taxicab, motorcycle, or other means: 30 (0.5%)
- Bicycle: 19 (0.3%)
- Walked: 30 (0.5%)
- Worked at home: 1,278 (22.5%)

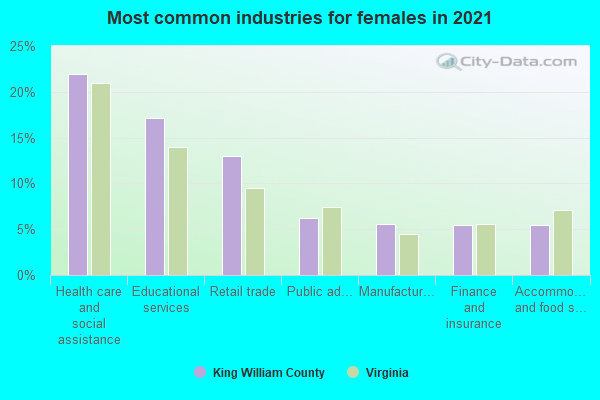
- Health care and social assistance (21%)
- Educational services (15%)
- Retail trade (11%)
- Public administration (7%)
- Accommodation and food services (7%)
- Other services, except public administration (6%)
- Finance and insurance (5%)
- Health care and social assistance (21%)
- Educational services (15%)
- Retail trade (11%)
- Public administration (7%)
- Accommodation and food services (7%)
- Other services, except public administration (6%)
- Finance and insurance (5%)
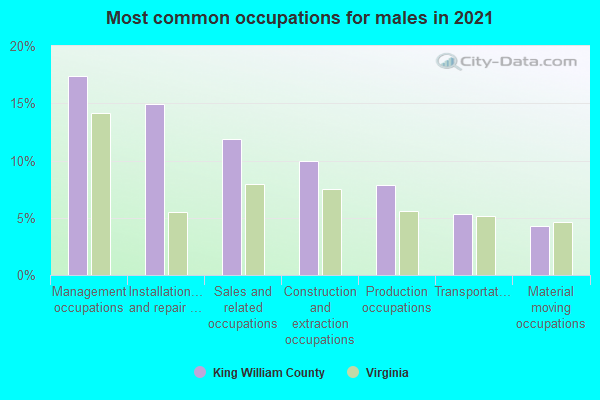
- Management occupations (17%)
- Sales and related occupations (13%)
- Installation, maintenance, and repair occupations (12%)
- Construction and extraction occupations (11%)
- Production occupations (9%)
- Building and grounds cleaning and maintenance occupations (5%)
- Transportation occupations (5%)
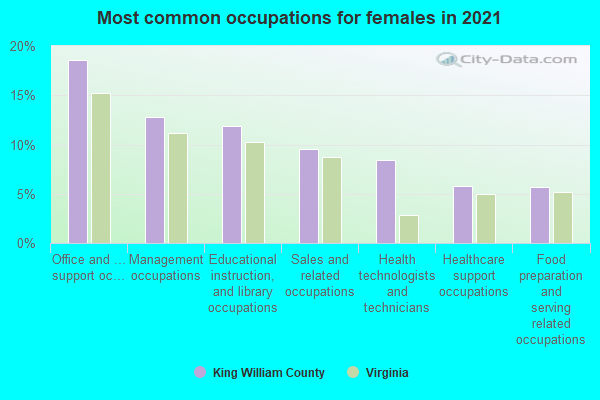
- Office and administrative support occupations (19%)
- Management occupations (12%)
- Health technologists and technicians (9%)
- Educational instruction, and library occupations (9%)
- Sales and related occupations (8%)
- Healthcare support occupations (7%)
- Food preparation and serving related occupations (7%)
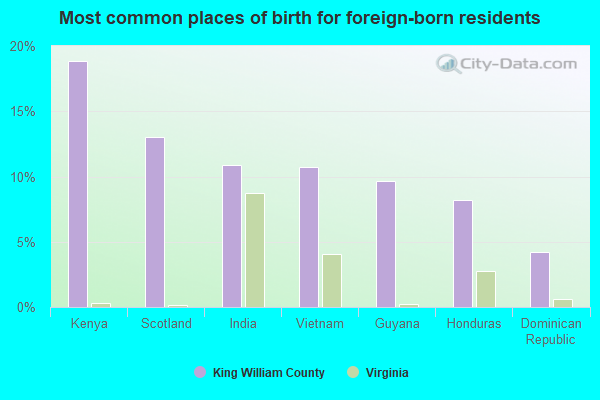
- Guyana (21%)
- India (14%)
- Zimbabwe (13%)
- Scotland (12%)
- Honduras (9%)
- Vietnam (9%)
- Brazil (5%)
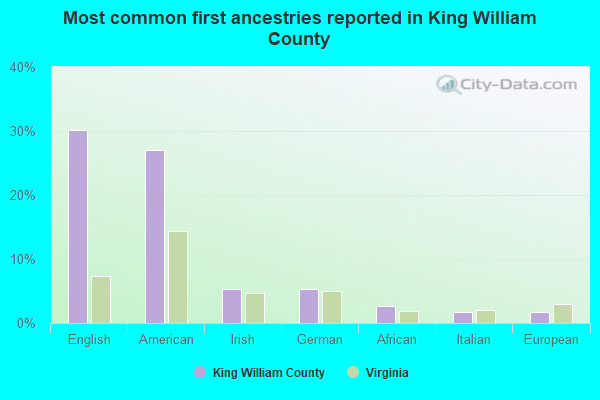
- American (33%)
- English (21%)
- German (5%)
- Irish (4%)
- Italian (1%)
- Ukrainian (1%)
- French (except Basque) (1%)
2 people in group homes intended for adults
People in group quarters in King William County, Virginia in 2000:
- 54 people in nursing homes
- 27 people in other noninstitutional group quarters
- 18 people in homes for the mentally ill
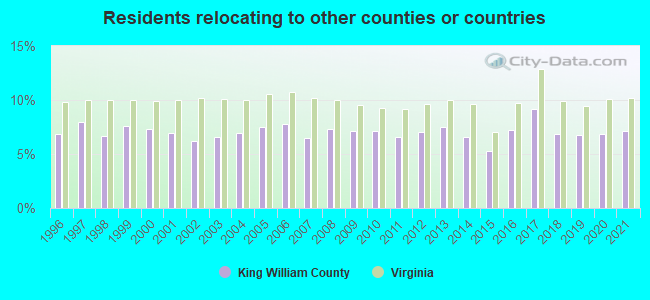
8.74% of this county's 2021 resident taxpayers lived in other counties in 2020 ($59,879 average adjusted gross income)
| Here: | 8.74% |
| Virginia average: | 10.16% |
10 or fewer of this county's residents moved from foreign countries.
7.58% relocated from other counties in Virginia ($52,857 average AGI)
1.16% relocated from other states ($7,022 average AGI)
King William County: 1.16% Virginia average: 3.91%

Top counties from which taxpayers relocated into this county between 2020 and 2021:
| from Hanover County, VA | |
| from Henrico County, VA | |
| from Chesterfield County, VA | |
| from Richmond city, VA | |
| from King and Queen County, VA |
7.14% of this county's 2020 resident taxpayers moved to other counties in 2021 ($56,120 average adjusted gross income)
| Here: | 7.14% |
| Virginia average: | 10.20% |
10 or fewer of this county's residents moved to foreign countries.
6.40% relocated to other counties in Virginia ($49,006 average AGI)
0.73% relocated to other states ($7,115 average AGI)
King William County: 0.73% Virginia average: 3.98%
Top counties to which taxpayers relocated from this county between 2020 and 2021:
| to Hanover County, VA | |
| to Henrico County, VA | |
| to King and Queen County, VA | |
| to New Kent County, VA | |
| to Chesterfield County, VA | |
| to Essex County, VA |
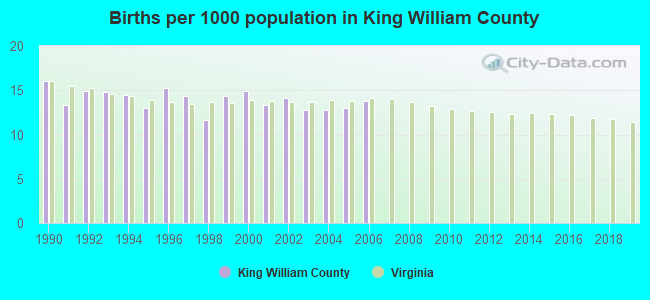
Births per 1000 population from 1990 to 1999: 14.2
Births per 1000 population from 2000 to 2006: 13.5
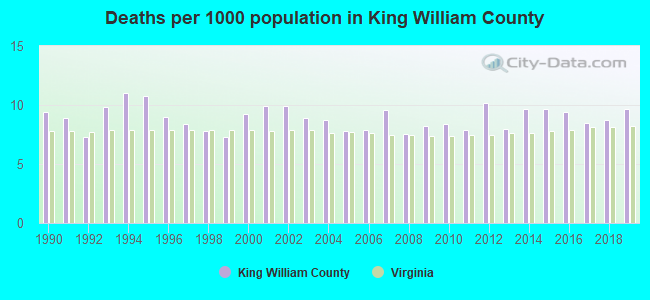
Deaths per 1000 population from 1990 to 1999: 9.0
Deaths per 1000 population from 2000 to 2009: 8.8
Deaths per 1000 population from 2010 to 2020: 9.1
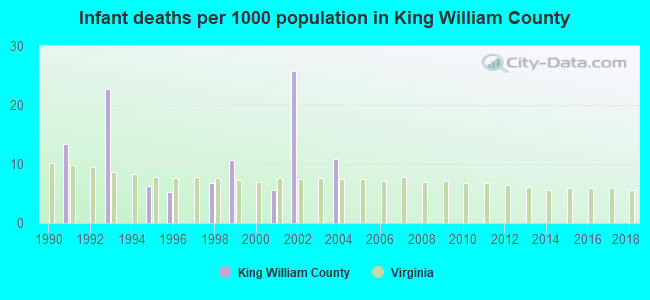
Infant deaths per 1000 live births from 1990 to 1999: 6.5
Infant deaths per 1000 live births from 2000 to 2006: 6.0
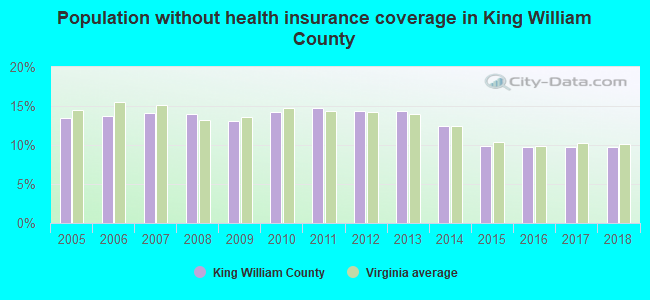
Persons under 19 years old without health insurance coverage in 2018: 5.3%
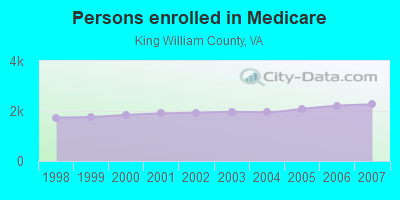
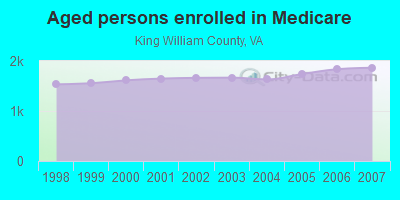
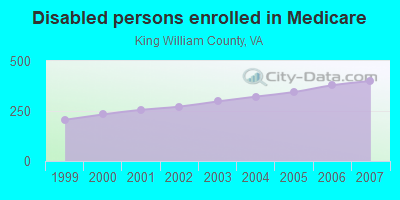
Persons enrolled in hospital insurance and/or supplemental medical insurance (Medicare) in July 1, 2007: 2,265 (1,865 aged, 400 disabled)
Children under 18 without health insurance coverage in 2007: 418 (10%)
Most common underlying causes of death in King William County, Virginia in 1999 - 2019:
- Bronchus or lung, unspecified - Malignant neoplasms (109)
- Acute myocardial infarction, unspecified (64)
- Atherosclerotic heart disease (56)
- Chronic obstructive pulmonary disease, unspecified (24)
- Unspecified dementia (11)
- Stroke, not specified as haemorrhage or infarction (10)
Population without health insurance coverage in 2000: 10%
Children under 18 without health insurance coverage in 2000: 7%
Medical specialist MDs per 100,000 population in 2005: 930
Dentists per 100,000 population in 1998: 14
Total births per 100,000 population, July 2005 - July 2006 : 24
Total deaths per 100,000 population, July 2005 - July 2006: 48
Limited-service eating places per 100,000 population in 2005 : 20
Household type by relationship:
Households: 17,967- Male householders: 3,338 (747 living alone), Female householders: 3,747 (966 living alone)
3,905 spouses (3,882 opposite-sex spouses), 404 unmarried partners, (404 opposite-sex unmarried partners), 5,501 children (5,302 natural, 73 adopted, 131 stepchildren), 269 grandchildren, 173 brothers or sisters, 187 parents, 0 foster children, 231 other relatives, 172 non-relatives
- In group quarters: 72
Size of family households: 2,609 2-persons, 1,247 3-persons, 1,043 4-persons, 143 5-persons, 106 6-persons, 65 7-or-more-persons.
Size of nonfamily households: 1,714 1-person, 98 2-persons, 27 3-persons, 9 4-persons.
2,697 married couples with children.
1,012 single-parent households (334 men, 678 women).
97.5% of residents of King William speak English at home.
1.1% of residents speak Spanish at home (61% speak English very well, 9% speak English well, 30% speak English not well).
0.5% of residents speak other Indo-European language at home (69% speak English very well, 31% speak English well).
0.3% of residents speak Asian or Pacific Island language at home (56% speak English very well, 24% speak English well, 20% speak English not well).
0.1% of residents speak other language at home (100% speak English very well).
In fiscal year 2004:
Federal Government expenditure: $64,625,000 ($4,509 per capita)
Department of Defense expenditure: $6,366,000
Federal direct payments to individuals for retirement and disability: $32,559,000
Federal other direct payments to individuals: $13,083,000
Federal direct payments not to individuals: $3,347,000
Federal grants: $8,779,000
Federal procurement contracts: $1,491,000 ($606,000 Department of Defense)
Federal salaries and wages: $5,366,000 ($3,858,000 Department of Defense)
Federal Government direct loans: $911,000
Federal guaranteed/insured loans: $14,784,000
Federal Government insurance: $18,142,000
Population change from April 1, 2000 to July 1, 2005:
Births: 983| Here: | 67 per 1000 residents |
| State: | 70 per 1000 residents |
Deaths: 675
| Here: | 46 per 1000 residents |
| State: | 40 per 1000 residents |
Net international migration: +34
| Here: | +2 per 1000 residents |
| State: | +18 per 1000 residents |
Net internal migration: +1,273
| Here: | +86 per 1000 residents |
| State: | +14 per 1000 residents |
Total withdrawal of fresh water for public supply: 0.53 millions of gallons per day (all from ground)
| Here: | 6.5 |
| State: | 7.0 |
| Here: | 5.1 |
| State: | 4.3 |
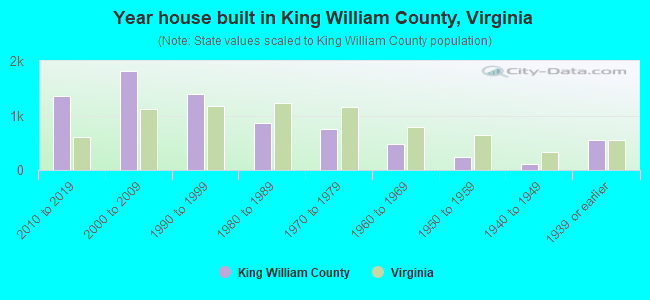
- Year house built in King William County, Virginia
- 12020 or later
- 1,2272010 to 2019
- 1,8552000 to 2009
- 1,3071990 to 1999
- 9991980 to 1989
- 6891970 to 1979
- 4301960 to 1969
- 2931950 to 1959
- 1411940 to 1949
- 7031939 or earlier
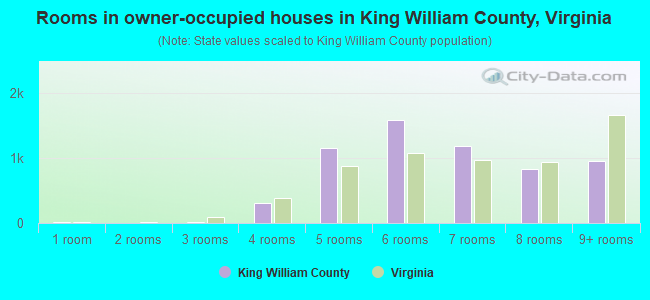
- Rooms in owner-occupied houses in King William County, Virginia
- 121 room
- 32 rooms
- 93 rooms
- 3364 rooms
- 1,0945 rooms
- 1,6046 rooms
- 1,3167 rooms
- 7988 rooms
- 9519+ rooms
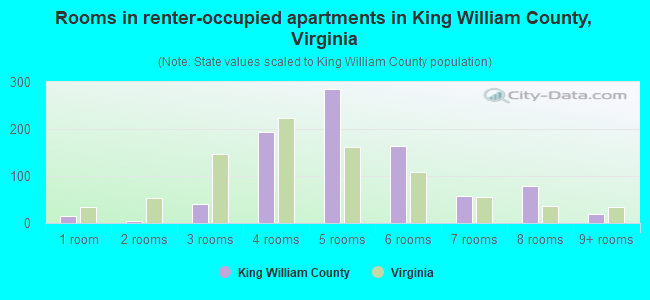
- Rooms in renter-occupied apartments in King William County, Virginia
- 111 room
- 32 rooms
- 1053 rooms
- 1904 rooms
- 2425 rooms
- 1486 rooms
- 967 rooms
- 668 rooms
- 959+ rooms
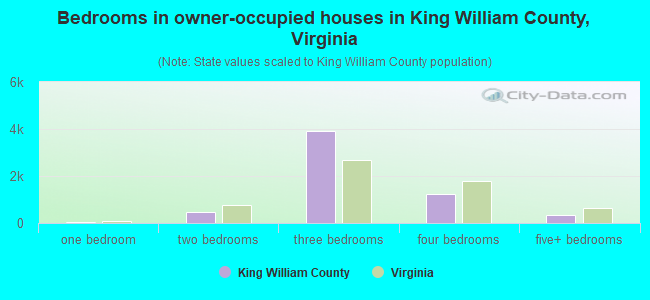
- Bedrooms in owner-occupied houses in King William County, Virginia
- 14no bedroom
- 201 bedroom
- 4142 bedrooms
- 4,0553 bedrooms
- 1,3144 bedrooms
- 3355+ bedrooms
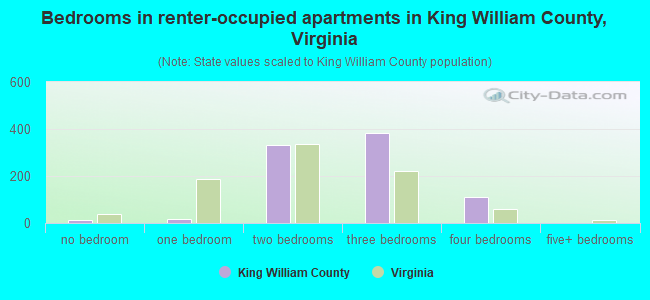
- Bedrooms in renter-occupied apartments in King William County, Virginia
- 11no bedroom
- 31 bedroom
- 3892 bedrooms
- 3583 bedrooms
- 1814 bedrooms
- 115+ bedrooms
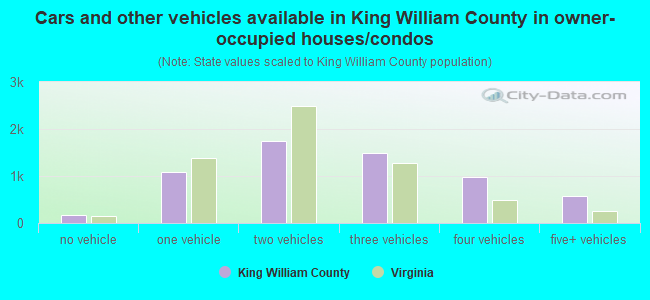
- Cars and other vehicles available in King William County in owner-occupied houses/condos
- 174no vehicle
- 1,2821 vehicle
- 1,7912 vehicles
- 1,4773 vehicles
- 8074 vehicles
- 5945+ vehicles
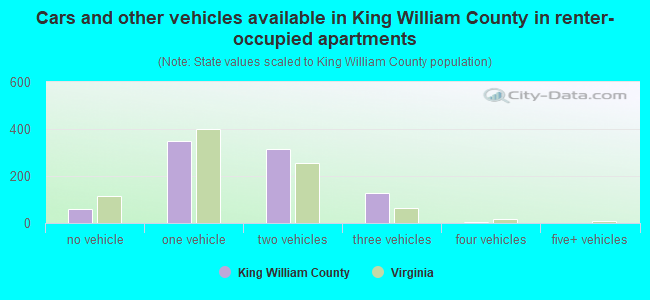
- Cars and other vehicles available in King William County in renter-occupied apartments
- 62no vehicle
- 3231 vehicle
- 3902 vehicles
- 1353 vehicles
- 404 vehicles
- 25+ vehicles
95.6% of King William County residents lived in the same house 1 years ago.
Out of people who lived in different houses, 23% lived in this county.
Out of people who lived in different counties, 89% lived in Virginia.
| King William County: | 95.6% |
| State average: | 86.6% |
Place of birth for U.S.-born residents:
- This state: 13,076
- Other state: 4,255
- Northeast: 1,244
- Midwest: 617
- South: 1,990
- West: 397
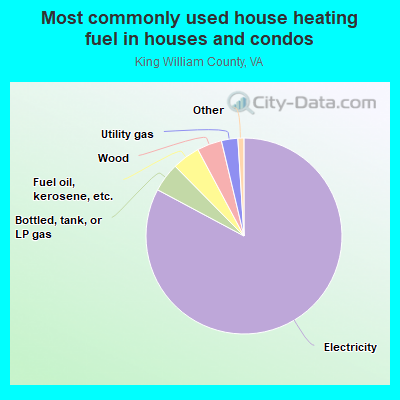
- 84.6%Electricity
- 5.0%Bottled, tank, or LP gas
- 3.4%Wood
- 3.4%Fuel oil, kerosene, etc.
- 1.9%Utility gas
- 1.1%Solar energy
- 0.6%No fuel used
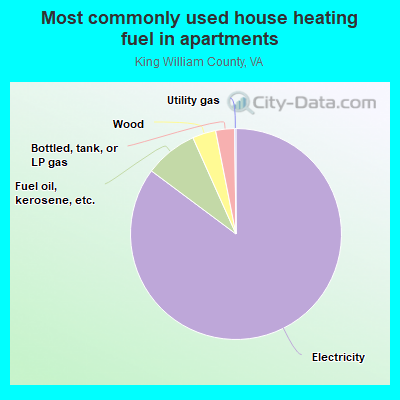
- 82.4%Electricity
- 12.5%Fuel oil, kerosene, etc.
- 3.1%Wood
- 1.7%Bottled, tank, or LP gas
- 0.3%Utility gas
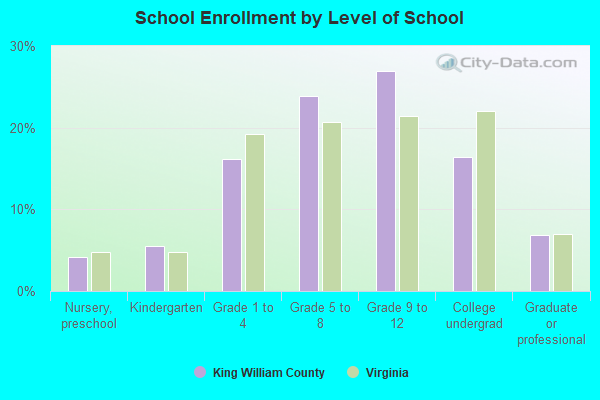
Private vs. public school enrollment:
| Here: | 14.1% |
| Virginia: | 13.2% |
| Here: | 2.3% |
| Virginia: | 10.2% |
| Here: | 0.0% |
| Virginia: | 18.7% |
King William County government finances - Expenditure in 2020:
- Bond Funds - Cash and Securities: $9,660,000
- Charges - Hospital Public: $88,083,000
Hospital Public: $87,109,000
Natural Resources - Other: $1,762,000
Other: $1,225,000
Other: $792,000
Natural Resources - Other: $309,000
- Construction - General Public Buildings: $9,154,000
Regular Highways: $5,069,000
Hospitals: $1,905,000
Regular Highways: $1,336,000
Natural Resources - Other: $1,084,000
Libraries: $10,000
- Current Operations - Hospitals: $84,340,000
Hospitals: $79,061,000
Natural Resources - Other: $5,898,000
Police Protection: $5,581,000
Police Protection: $5,431,000
Correctional Institutions: $5,425,000
Correctional Institutions: $5,339,000
Regular Highways: $4,948,000
General - Other: $4,079,000
Regular Highways: $4,077,000
Central Staff Services: $4,052,000
Central Staff Services: $3,734,000
Judicial and Legal Services: $3,630,000
Financial Administration: $3,620,000
Judicial and Legal Services: $3,475,000
Financial Administration: $3,471,000
Libraries: $3,062,000
Health - Other: $3,044,000
General - Other: $2,490,000
General Public Buildings: $1,951,000
Natural Resources - Other: $1,929,000
General Public Buildings: $1,885,000
Parks and Recreation: $941,000
Air Transportation: $901,000
Local Fire Protection: $851,000
Transit Utilities: $781,000
Health - Other: $695,000
Air Transportation: $634,000
Corrections - Other: $556,000
Local Fire Protection: $554,000
Corrections - Other: $522,000
Public Welfare - Other: $281,000
Public Welfare - Other: $240,000
Parks and Recreation: $54,000
- Federal Intergovernmental - Health and Hospitals: $6,132,000
General Local Government Support: $3,627,000
General Local Government Support: $3,443,000
Other: $903,000
Transit Utilities: $526,000
Other: $498,000
- General - Interest on Debt: $1,344,000
Interest on Debt: $1,313,000
- Local Intergovernmental - Health and Hospitals: $2,364,000
Other: $845,000
Other: $173,000
Transit Utilities: $147,000
- Long Term Debt - Beginning Outstanding - Unspecified Public Purpose: $56,337,000
Beginning Outstanding - Unspecified Public Purpose: $32,838,000
Outstanding Unspecified Public Purpose: $29,538,000
Outstanding Unspecified Public Purpose: $28,203,000
Issue, Unspecified Public Purpose: $8,716,000
Retired Unspecified Public Purpose: $3,300,000
Retired Unspecified Public Purpose: $1,105,000
- Miscellaneous - General Revenue - Other: $12,108,000
General Revenue - Other: $9,348,000
Interest Earnings: $1,361,000
Interest Earnings: $752,000
Rents: $484,000
Rents: $330,000
Sale of Property: $84,000
Sale of Property: $20,000
- Other Capital Outlay - General - Other: $993,000
Hospitals: $906,000
Regular Highways: $735,000
Health - Other: $699,000
Air Transportation: $587,000
Natural Resources - Other: $228,000
Police Protection: $179,000
Local Fire Protection: $101,000
Natural Resources - Other: $78,000
Transit Utilities: $68,000
Financial Administration: $21,000
Correctional Institutions: $9,000
General Public Building: $7,000
- Other Funds - Cash and Securities: $121,484,000
Cash and Securities: $85,996,000
- Revenue - Transit Utilities: $13,000
- State Intergovernmental - General Local Government Support: $6,090,000
General Local Government Support: $5,333,000
Highways: $2,859,000
Other: $2,543,000
Highways: $1,904,000
Other: $1,852,000
Health and Hospitals: $697,000
Transit Utilities: $14,000
- Tax - Property: $36,207,000
Property: $27,805,000
General Sales and Gross Receipts: $15,210,000
General Sales and Gross Receipts: $12,612,000
Motor Vehicle License: $2,133,000
Motor Vehicle License: $2,036,000
Occupation and Business License - Other: $97,000
Other License: $57,000
Public Utilities Sales: $31,000
Public Utilities Sales: $27,000
- Total Salaries and Wages: $23,330,000
King William County government finances - Revenue in 2020:
- Bond Funds - Cash and Securities: $9,660,000
- Charges - Hospital Public: $88,083,000
Hospital Public: $87,109,000
Natural Resources - Other: $1,762,000
Other: $1,225,000
Other: $792,000
Natural Resources - Other: $309,000
- Construction - General Public Buildings: $9,154,000
Regular Highways: $5,069,000
Hospitals: $1,905,000
Regular Highways: $1,336,000
Natural Resources - Other: $1,084,000
Libraries: $10,000
- Current Operations - Hospitals: $84,340,000
Hospitals: $79,061,000
Natural Resources - Other: $5,898,000
Police Protection: $5,581,000
Police Protection: $5,431,000
Correctional Institutions: $5,425,000
Correctional Institutions: $5,339,000
Regular Highways: $4,948,000
General - Other: $4,079,000
Regular Highways: $4,077,000
Central Staff Services: $4,052,000
Central Staff Services: $3,734,000
Judicial and Legal Services: $3,630,000
Financial Administration: $3,620,000
Judicial and Legal Services: $3,475,000
Financial Administration: $3,471,000
Libraries: $3,062,000
Health - Other: $3,044,000
General - Other: $2,490,000
General Public Buildings: $1,951,000
Natural Resources - Other: $1,929,000
General Public Buildings: $1,885,000
Parks and Recreation: $941,000
Air Transportation: $901,000
Local Fire Protection: $851,000
Transit Utilities: $781,000
Health - Other: $695,000
Air Transportation: $634,000
Corrections - Other: $556,000
Local Fire Protection: $554,000
Corrections - Other: $522,000
Public Welfare - Other: $281,000
Public Welfare - Other: $240,000
Parks and Recreation: $54,000
- Federal Intergovernmental - Health and Hospitals: $6,132,000
General Local Government Support: $3,627,000
General Local Government Support: $3,443,000
Other: $903,000
Transit Utilities: $526,000
Other: $498,000
- General - Interest on Debt: $1,344,000
Interest on Debt: $1,313,000
- Local Intergovernmental - Health and Hospitals: $2,364,000
Other: $845,000
Other: $173,000
Transit Utilities: $147,000
- Long Term Debt - Beginning Outstanding - Unspecified Public Purpose: $56,337,000
Beginning Outstanding - Unspecified Public Purpose: $32,838,000
Outstanding Unspecified Public Purpose: $29,538,000
Outstanding Unspecified Public Purpose: $28,203,000
Issue, Unspecified Public Purpose: $8,716,000
Retired Unspecified Public Purpose: $3,300,000
Retired Unspecified Public Purpose: $1,105,000
- Miscellaneous - General Revenue - Other: $12,108,000
General Revenue - Other: $9,348,000
Interest Earnings: $1,361,000
Interest Earnings: $752,000
Rents: $484,000
Rents: $330,000
Sale of Property: $84,000
Sale of Property: $20,000
- Other Capital Outlay - General - Other: $993,000
Hospitals: $906,000
Regular Highways: $735,000
Health - Other: $699,000
Air Transportation: $587,000
Natural Resources - Other: $228,000
Police Protection: $179,000
Local Fire Protection: $101,000
Natural Resources - Other: $78,000
Transit Utilities: $68,000
Financial Administration: $21,000
Correctional Institutions: $9,000
General Public Building: $7,000
- Other Funds - Cash and Securities: $121,484,000
Cash and Securities: $85,996,000
- Revenue - Transit Utilities: $13,000
- State Intergovernmental - General Local Government Support: $6,090,000
General Local Government Support: $5,333,000
Highways: $2,859,000
Other: $2,543,000
Highways: $1,904,000
Other: $1,852,000
Health and Hospitals: $697,000
Transit Utilities: $14,000
- Tax - Property: $36,207,000
Property: $27,805,000
General Sales and Gross Receipts: $15,210,000
General Sales and Gross Receipts: $12,612,000
Motor Vehicle License: $2,133,000
Motor Vehicle License: $2,036,000
Occupation and Business License - Other: $97,000
Other License: $57,000
Public Utilities Sales: $31,000
Public Utilities Sales: $27,000
- Total Salaries and Wages: $23,330,000
King William County government finances - Debt in 2020:
- Bond Funds - Cash and Securities: $9,660,000
- Charges - Hospital Public: $88,083,000
Hospital Public: $87,109,000
Natural Resources - Other: $1,762,000
Other: $1,225,000
Other: $792,000
Natural Resources - Other: $309,000
- Construction - General Public Buildings: $9,154,000
Regular Highways: $5,069,000
Hospitals: $1,905,000
Regular Highways: $1,336,000
Natural Resources - Other: $1,084,000
Libraries: $10,000
- Current Operations - Hospitals: $84,340,000
Hospitals: $79,061,000
Natural Resources - Other: $5,898,000
Police Protection: $5,581,000
Police Protection: $5,431,000
Correctional Institutions: $5,425,000
Correctional Institutions: $5,339,000
Regular Highways: $4,948,000
General - Other: $4,079,000
Regular Highways: $4,077,000
Central Staff Services: $4,052,000
Central Staff Services: $3,734,000
Judicial and Legal Services: $3,630,000
Financial Administration: $3,620,000
Judicial and Legal Services: $3,475,000
Financial Administration: $3,471,000
Libraries: $3,062,000
Health - Other: $3,044,000
General - Other: $2,490,000
General Public Buildings: $1,951,000
Natural Resources - Other: $1,929,000
General Public Buildings: $1,885,000
Parks and Recreation: $941,000
Air Transportation: $901,000
Local Fire Protection: $851,000
Transit Utilities: $781,000
Health - Other: $695,000
Air Transportation: $634,000
Corrections - Other: $556,000
Local Fire Protection: $554,000
Corrections - Other: $522,000
Public Welfare - Other: $281,000
Public Welfare - Other: $240,000
Parks and Recreation: $54,000
- Federal Intergovernmental - Health and Hospitals: $6,132,000
General Local Government Support: $3,627,000
General Local Government Support: $3,443,000
Other: $903,000
Transit Utilities: $526,000
Other: $498,000
- General - Interest on Debt: $1,344,000
Interest on Debt: $1,313,000
- Local Intergovernmental - Health and Hospitals: $2,364,000
Other: $845,000
Other: $173,000
Transit Utilities: $147,000
- Long Term Debt - Beginning Outstanding - Unspecified Public Purpose: $56,337,000
Beginning Outstanding - Unspecified Public Purpose: $32,838,000
Outstanding Unspecified Public Purpose: $29,538,000
Outstanding Unspecified Public Purpose: $28,203,000
Issue, Unspecified Public Purpose: $8,716,000
Retired Unspecified Public Purpose: $3,300,000
Retired Unspecified Public Purpose: $1,105,000
- Miscellaneous - General Revenue - Other: $12,108,000
General Revenue - Other: $9,348,000
Interest Earnings: $1,361,000
Interest Earnings: $752,000
Rents: $484,000
Rents: $330,000
Sale of Property: $84,000
Sale of Property: $20,000
- Other Capital Outlay - General - Other: $993,000
Hospitals: $906,000
Regular Highways: $735,000
Health - Other: $699,000
Air Transportation: $587,000
Natural Resources - Other: $228,000
Police Protection: $179,000
Local Fire Protection: $101,000
Natural Resources - Other: $78,000
Transit Utilities: $68,000
Financial Administration: $21,000
Correctional Institutions: $9,000
General Public Building: $7,000
- Other Funds - Cash and Securities: $121,484,000
Cash and Securities: $85,996,000
- Revenue - Transit Utilities: $13,000
- State Intergovernmental - General Local Government Support: $6,090,000
General Local Government Support: $5,333,000
Highways: $2,859,000
Other: $2,543,000
Highways: $1,904,000
Other: $1,852,000
Health and Hospitals: $697,000
Transit Utilities: $14,000
- Tax - Property: $36,207,000
Property: $27,805,000
General Sales and Gross Receipts: $15,210,000
General Sales and Gross Receipts: $12,612,000
Motor Vehicle License: $2,133,000
Motor Vehicle License: $2,036,000
Occupation and Business License - Other: $97,000
Other License: $57,000
Public Utilities Sales: $31,000
Public Utilities Sales: $27,000
- Total Salaries and Wages: $23,330,000
King William County government finances - Cash and Securities in 2020:
- Bond Funds - Cash and Securities: $9,660,000
- Charges - Hospital Public: $88,083,000
Hospital Public: $87,109,000
Natural Resources - Other: $1,762,000
Other: $1,225,000
Other: $792,000
Natural Resources - Other: $309,000
- Construction - General Public Buildings: $9,154,000
Regular Highways: $5,069,000
Hospitals: $1,905,000
Regular Highways: $1,336,000
Natural Resources - Other: $1,084,000
Libraries: $10,000
- Current Operations - Hospitals: $84,340,000
Hospitals: $79,061,000
Natural Resources - Other: $5,898,000
Police Protection: $5,581,000
Police Protection: $5,431,000
Correctional Institutions: $5,425,000
Correctional Institutions: $5,339,000
Regular Highways: $4,948,000
General - Other: $4,079,000
Regular Highways: $4,077,000
Central Staff Services: $4,052,000
Central Staff Services: $3,734,000
Judicial and Legal Services: $3,630,000
Financial Administration: $3,620,000
Judicial and Legal Services: $3,475,000
Financial Administration: $3,471,000
Libraries: $3,062,000
Health - Other: $3,044,000
General - Other: $2,490,000
General Public Buildings: $1,951,000
Natural Resources - Other: $1,929,000
General Public Buildings: $1,885,000
Parks and Recreation: $941,000
Air Transportation: $901,000
Local Fire Protection: $851,000
Transit Utilities: $781,000
Health - Other: $695,000
Air Transportation: $634,000
Corrections - Other: $556,000
Local Fire Protection: $554,000
Corrections - Other: $522,000
Public Welfare - Other: $281,000
Public Welfare - Other: $240,000
Parks and Recreation: $54,000
- Federal Intergovernmental - Health and Hospitals: $6,132,000
General Local Government Support: $3,627,000
General Local Government Support: $3,443,000
Other: $903,000
Transit Utilities: $526,000
Other: $498,000
- General - Interest on Debt: $1,344,000
Interest on Debt: $1,313,000
- Local Intergovernmental - Health and Hospitals: $2,364,000
Other: $845,000
Other: $173,000
Transit Utilities: $147,000
- Long Term Debt - Beginning Outstanding - Unspecified Public Purpose: $56,337,000
Beginning Outstanding - Unspecified Public Purpose: $32,838,000
Outstanding Unspecified Public Purpose: $29,538,000
Outstanding Unspecified Public Purpose: $28,203,000
Issue, Unspecified Public Purpose: $8,716,000
Retired Unspecified Public Purpose: $3,300,000
Retired Unspecified Public Purpose: $1,105,000
- Miscellaneous - General Revenue - Other: $12,108,000
General Revenue - Other: $9,348,000
Interest Earnings: $1,361,000
Interest Earnings: $752,000
Rents: $484,000
Rents: $330,000
Sale of Property: $84,000
Sale of Property: $20,000
- Other Capital Outlay - General - Other: $993,000
Hospitals: $906,000
Regular Highways: $735,000
Health - Other: $699,000
Air Transportation: $587,000
Natural Resources - Other: $228,000
Police Protection: $179,000
Local Fire Protection: $101,000
Natural Resources - Other: $78,000
Transit Utilities: $68,000
Financial Administration: $21,000
Correctional Institutions: $9,000
General Public Building: $7,000
- Other Funds - Cash and Securities: $121,484,000
Cash and Securities: $85,996,000
- Revenue - Transit Utilities: $13,000
- State Intergovernmental - General Local Government Support: $6,090,000
General Local Government Support: $5,333,000
Highways: $2,859,000
Other: $2,543,000
Highways: $1,904,000
Other: $1,852,000
Health and Hospitals: $697,000
Transit Utilities: $14,000
- Tax - Property: $36,207,000
Property: $27,805,000
General Sales and Gross Receipts: $15,210,000
General Sales and Gross Receipts: $12,612,000
Motor Vehicle License: $2,133,000
Motor Vehicle License: $2,036,000
Occupation and Business License - Other: $97,000
Other License: $57,000
Public Utilities Sales: $31,000
Public Utilities Sales: $27,000
- Total Salaries and Wages: $23,330,000
Supplemental Security Income (SSI) in 2006:
- Total number of recipients: 223
- Number of aged recipients: 39
- Number of blind and disabled recipients: 184
- Number of recipients under 18: 40
- Number of recipients between 18 and 64: 113
- Number of recipients older than 64: 70
- Number of recipients also receiving OASDI: 105
- Amount of payments (thousands of dollars): 80
| Most common first names in King William County, VA among deceased individuals | ||
| Name | Count | Lived (average) |
|---|---|---|
| Mary | 66 | 78.6 years |
| William | 66 | 74.0 years |
| James | 53 | 70.4 years |
| John | 51 | 72.1 years |
| Robert | 42 | 73.0 years |
| Thomas | 27 | 71.4 years |
| Charles | 26 | 74.9 years |
| Joseph | 24 | 77.2 years |
| George | 23 | 69.7 years |
| Richard | 22 | 72.7 years |
| Most common last names in King William County, VA among deceased individuals | ||
| Last name | Count | Lived (average) |
|---|---|---|
| Johnson | 29 | 73.7 years |
| Smith | 28 | 71.9 years |
| Carter | 22 | 72.7 years |
| Wilson | 20 | 73.2 years |
| Harris | 20 | 71.2 years |
| Jones | 19 | 75.4 years |
| Brown | 19 | 76.3 years |
| Custalow | 17 | 74.6 years |
| Washington | 16 | 69.8 years |
| Wyatt | 15 | 78.3 years |
| Businesses in King William County, VA | ||||
| Name | Count | Name | Count | |
|---|---|---|---|---|
| 7-Eleven | 2 | MasterBrand Cabinets | 1 | |
| Advance Auto Parts | 1 | McDonald's | 1 | |
| Chevrolet | 1 | Pizza Hut | 1 | |
| Curves | 1 | RadioShack | 2 | |
| FedEx | 1 | Rite Aid | 1 | |
| Ford | 1 | U-Haul | 2 | |
| H&R Block | 2 | UPS | 1 | |
| Hardee's | 1 | YMCA | 1 | |
| Lane Furniture | 2 | |||
King William County on our top lists:
- #51 on the list of "Top 101 counties with the lowest Particulate Matter (PM10) Annual air pollution readings in 2012 (µg/m3)"