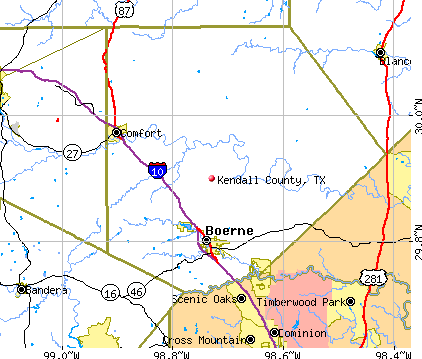
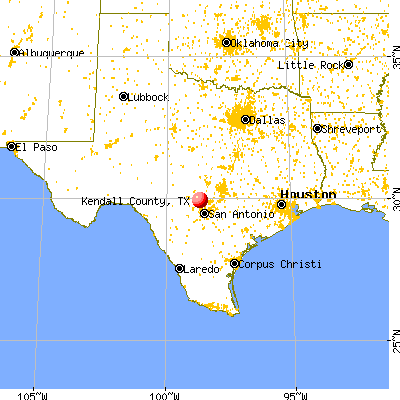
Kendall County, Texas (TX)
County owner-occupied free and clear houses and condos in 2010: 3,384
County owner-occupied houses and condos in 2000: 6,858
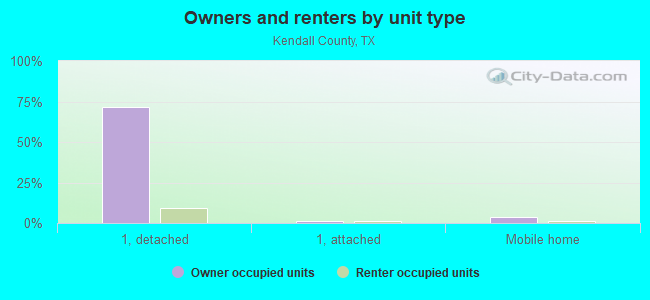
Renter-occupied apartments: 3,088 (it was 1,755 in 2000)
| % of renters here: | 20% |
| State: | 36% |
Land area: 662 sq. mi.
Water area: 0.6 sq. mi.
Population density: 70 people per square mile (average).
Industries providing employment: Educational, health and social services (19.2%), Professional, scientific, management, administrative, and waste management services (15.8%), Finance, insurance, real estate, and rental and leasing (11.7%), Construction (11.6%).
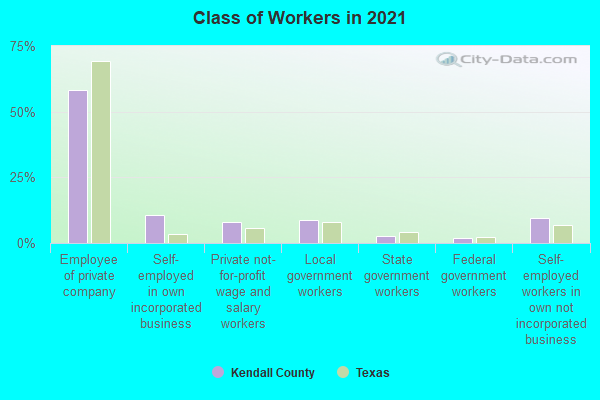
Type of workers:
- Private wage or salary: 77%
- Government: 14%
- Self-employed, not incorporated: 9%
- Unpaid family work: 0%
- OSM Map
- General Map
- Google Map
- MSN Map

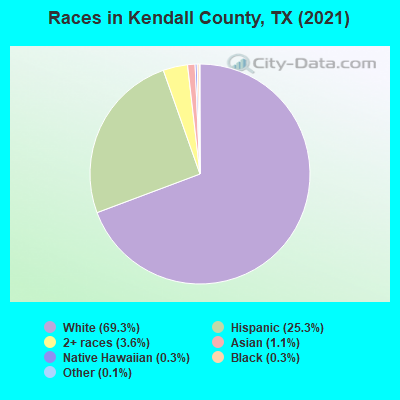
- 31,71868.9%White Non-Hispanic Alone
- 11,75925.6%Hispanic or Latino
- 1,4183.1%Two or more races
- 5571.2%Asian alone
- 3210.7%Black Non-Hispanic Alone
- 900.2%American Indian and Alaska Native alone
- 840.2%Native Hawaiian and Other
Pacific Islander alone - 760.2%Some other race alone
| Median resident age: | 43.1 years |
| Texas median age: | 35.6 years |
| Males: 22,956 | |
| Females: 23,639 |

 | Kendall County Historical Data Search? (1 reply) |
| New 400 foot tower for San Antonio (85 replies) |
| San Antonio population growth slowing? (45 replies) |
| What's up with property taxes in TX? (81 replies) |
| Latest storm and hail destruction. (15 replies) |
| What makes San Antonio a desirable place to live? (122 replies) |
| Kendall County: | 2.0 people |
| Texas: | 3 people |
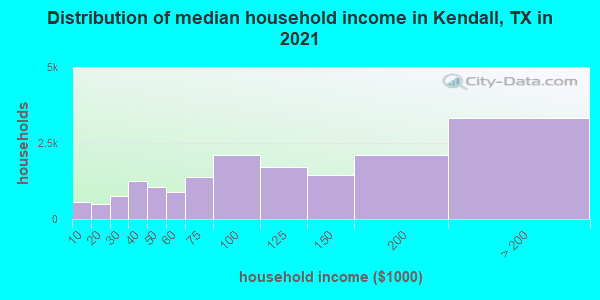
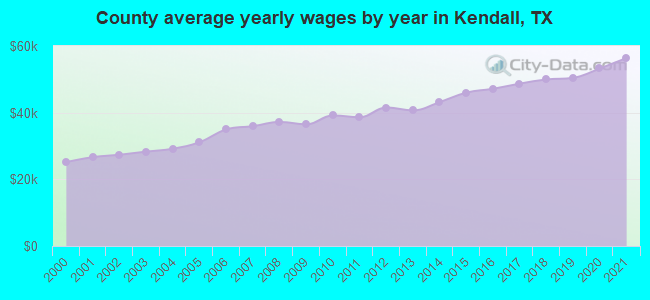
Estimated median household income in 2022: $103,124 ($49,521 in 1999)
| This county: | $103,124 |
| Texas: | $72,284 |
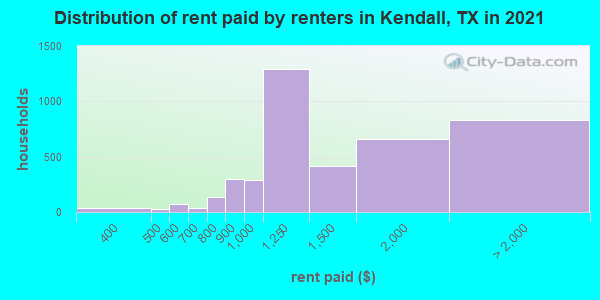
Median contract rent in 2022 for apartments: $1,346 (lower quartile is $1,078, upper quartile is $1,794)
| This county: | $1346 |
| State: | $1117 |
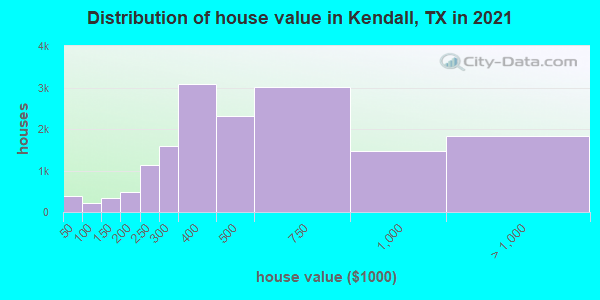
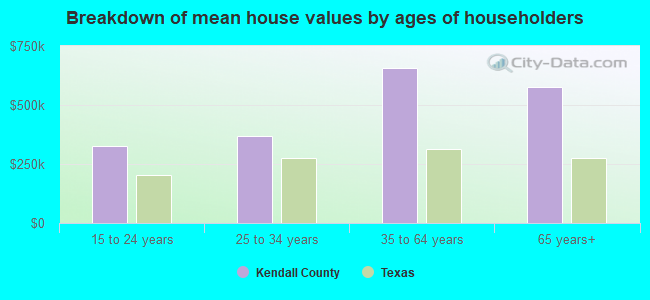
Estimated median house or condo value in 2022: $537,030 (it was $132,900 in 2000)
| Kendall: | $537,030 |
| Texas: | $275,400 |
Mean price in 2022:
Median monthly housing costs for homes and condos with a mortgage: $2,399Detached houses: $758,530
Here: $758,530 State: $369,058 Townhouses or other attached units: $609,222
Here: $609,222 State: $327,631 In 5-or-more-unit structures: $235,349
Here: $235,349 State: $413,944 Mobile homes: $114,074
Here: $114,074 State: $124,413 Occupied boats, RVs, vans, etc.: $146,488
Here: $146,488 State: $73,921
Median monthly housing costs for units without a mortgage: $825
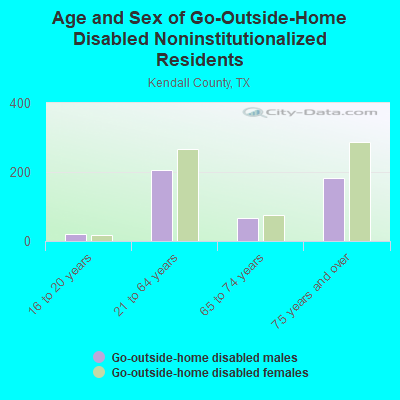
Institutionalized population: 440
Crime in 2021 (reported by the sheriff's office or county police, not the county total):
- Murders: 1
- Rapes: 7
- Robberies: 1
- Assaults: 14
- Burglaries: 20
- Thefts: 103
- Auto thefts: 18
Crime in 2020 (reported by the sheriff's office or county police, not the county total):
- Murders: 0
- Rapes: 5
- Robberies: 1
- Assaults: 19
- Burglaries: 26
- Thefts: 65
- Auto thefts: 25
Health of residents in Kendall County based on CDC Behavioral Risk Factor Surveillance System Survey Questionnaires from 2013 to 2021:
General health status score of residents in this county from 1 (poor) to 5 (excellent) is 3.4. This is worse than average.71.2% of residents exercised in the past month. This is about average.
37.5% of residents smoked 100+ cigarettes in their lives. This is less than average.
53.6% of adult residents drank alcohol in the past 30 days. This is less than average.
65.3% of residents visited a dentist within the past year. This is less than average.
Average weight of males is 199 pounds. This is more than average.
Average weight of females is 163 pounds. This is about average.
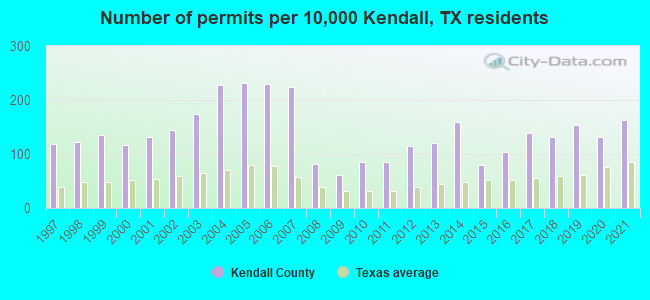
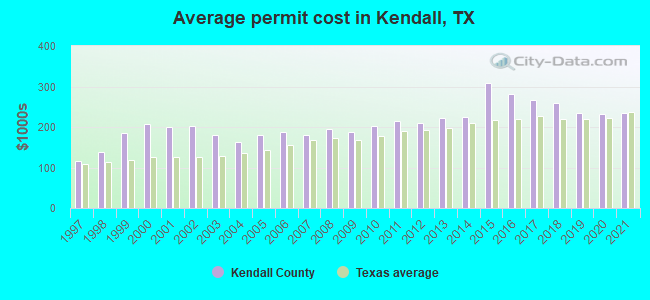
Single-family new house construction building permits:
- 2022: 325 buildings, average cost: $233,500
- 2021: 387 buildings, average cost: $233,700
- 2020: 314 buildings, average cost: $233,100
- 2019: 365 buildings, average cost: $234,800
- 2018: 313 buildings, average cost: $260,100
- 2017: 327 buildings, average cost: $267,100
- 2016: 245 buildings, average cost: $281,900
- 2015: 190 buildings, average cost: $307,500
- 2014: 380 buildings, average cost: $225,400
- 2013: 284 buildings, average cost: $221,600
- 2012: 271 buildings, average cost: $209,200
- 2011: 204 buildings, average cost: $216,400
- 2010: 202 buildings, average cost: $201,600
- 2009: 148 buildings, average cost: $186,800
- 2008: 193 buildings, average cost: $195,700
- 2007: 533 buildings, average cost: $180,100
- 2006: 547 buildings, average cost: $187,800
- 2005: 552 buildings, average cost: $180,000
- 2004: 539 buildings, average cost: $163,100
- 2003: 414 buildings, average cost: $180,000
- 2002: 344 buildings, average cost: $201,900
- 2001: 313 buildings, average cost: $200,700
- 2000: 278 buildings, average cost: $207,900
- 1999: 323 buildings, average cost: $186,200
- 1998: 290 buildings, average cost: $138,000
- 1997: 279 buildings, average cost: $116,900
Median real estate property taxes paid for housing units with mortgages in 2022: $6,547 (1.2%)
Median real estate property taxes paid for housing units with no mortgage in 2022: $4,840 (0.9%)
| Kendall County: | 5.1% |
| Texas: | 14.0% |
Median age of residents in 2022: 43.1 years old
(Males: 42.1 years old, Females: 44.0 years old)
(Median age for: White residents: 47.5 years old, Black residents: 51.8 years old, American Indian residents: 38.6 years old, Asian residents: 45.4 years old, Hispanic or Latino residents: 33.9 years old, Other race residents: 32.1 years old)
Fair market rent in 2006 for a 1-bedroom apartment in Kendall County is $657 a month.
Fair market rent for a 2-bedroom apartment is $791 a month.
Fair market rent for a 3-bedroom apartment is $1152 a month.
Neighboring counties: Franklin County, Florida  , Colorado County , St. Martin Parish, Louisiana , Fayette County , Gillespie County
  , Real County
  , Washington County .
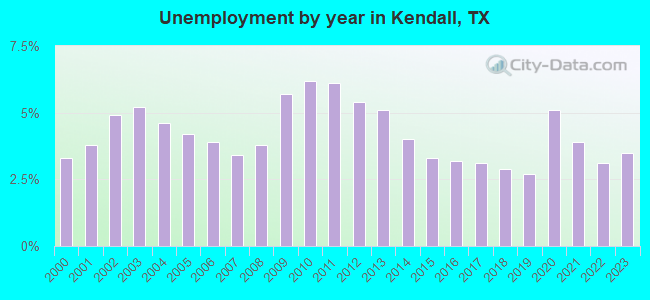
| Here: | 2.8% |
| Texas: | 3.5% |
Current college students: 820
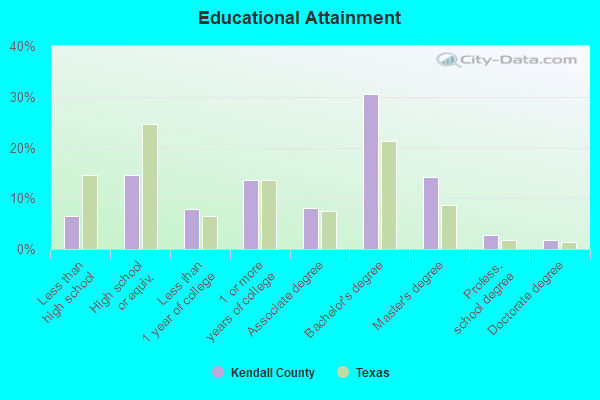
People 25 years of age or older with a high school degree or higher: 92.5%
People 25 years of age or older with a bachelor's degree or higher: 48.5%
Number of foreign born residents: 3,476 (38.6% naturalized citizens)
| Kendall County: | 7.5% |
| Whole state: | 17.2% |
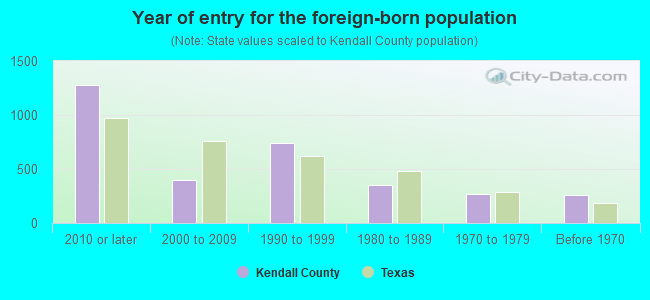
- Year of entry for the foreign-born population
- 1,4032010 or later
- 6482000 to 2009
- 6421990 to 1999
- 3511980 to 1989
- 2721970 to 1979
- 260Before 1970
Mean travel time to work (commute): minutes
Percentage of county residents living and working in this county: 99.6%
Housing units in structures:
- One, detached: 15,038
- One, attached: 523
- Two: 195
- 3 or 4: 448
- 5 to 9: 260
- 10 to 19: 362
- 20 to 49: 283
- 50 or more: 834
- Mobile homes: 1,055
- Boats, RVs, vans, etc.: 102
Housing units in Kendall County with a mortgage: 7,434 (494 second mortgage, 0 home equity loan, 390 both second mortgage and home equity loan)
Houses without a mortgage: 211
| Here: | 3.2% with mortgage |
| State: | 98.4% with mortgage |
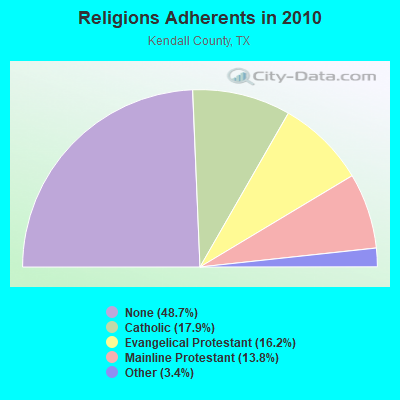
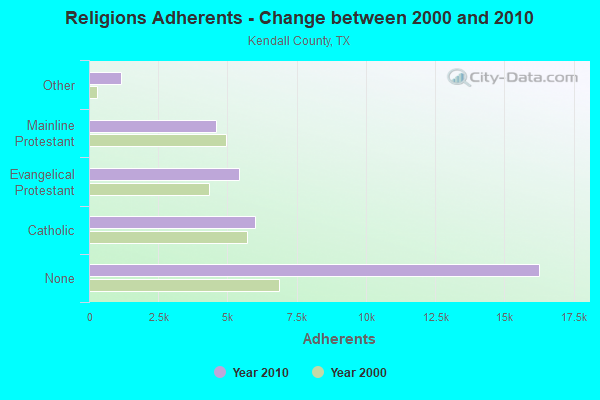
Religion statistics for Kendall County
| Religion | Adherents | Congregations |
|---|---|---|
| Catholic | 5,980 | 3 |
| Evangelical Protestant | 5,424 | 25 |
| Mainline Protestant | 4,598 | 7 |
| Other | 1,146 | 4 |
| None | 16,262 | - |
Source: Clifford Grammich, Kirk Hadaway, Richard Houseal, Dale E.Jones, Alexei Krindatch, Richie Stanley and Richard H.Taylor. 2012. 2010 U.S.Religion Census: Religious Congregations & Membership Study. Association of Statisticians of American Religious Bodies. Jones, Dale E., et al. 2002. Congregations and Membership in the United States 2000. Nashville, TN: Glenmary Research Center.
Food Environment Statistics:
| Kendall County: | 0.64 / 10,000 pop. |
| State: | 1.47 / 10,000 pop. |
| Here: | 0.32 / 10,000 pop. |
| Texas: | 0.14 / 10,000 pop. |
| This county: | 0.96 / 10,000 pop. |
| Texas: | 1.11 / 10,000 pop. |
| Kendall County: | 4.17 / 10,000 pop. |
| Texas: | 3.95 / 10,000 pop. |
| This county: | 9.95 / 10,000 pop. |
| State: | 6.13 / 10,000 pop. |
| Kendall County: | 8.2% |
| Texas: | 8.9% |
| Kendall County: | 24.9% |
| State: | 26.6% |
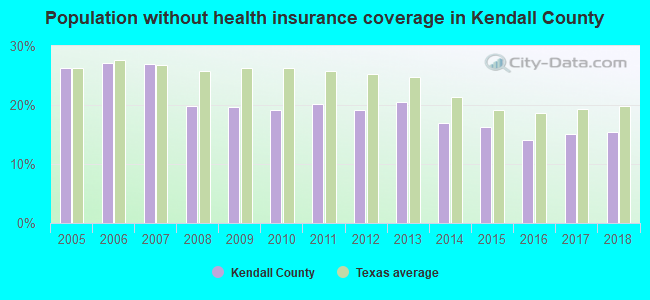
| Here: | 14.6% |
| State: | 15.7% |
Agriculture in Kendall County:
Average size of farms: 338 acresAverage value of agricultural products sold per farm: $7,262
Average value of crops sold per acre for harvested cropland: $93.45
The value of nursery, greenhouse, floriculture, and sod as a percentage of the total market value of agricultural products sold: 5.67%
The value of livestock, poultry, and their products as a percentage of the total market value of agricultural products sold: 86.19%
Average total farm production expenses per farm: $11,331
Harvested cropland as a percentage of land in farms: 3.18%
Irrigated harvested cropland as a percentage of land in farms: 5.21%
Average market value of all machinery and equipment per farm: $19,411
The percentage of farms operated by a family or individual: 88.21%
Average age of principal farm operators: 60 years
Average number of cattle and calves per 100 acres of all land in farms: 4.27
Milk cows as a percentage of all cattle and calves: 0.07%
All wheat for grain: 210 harvested acres
Land in orchards: 233 acres
Earthquake activity:
Kendall County-area historical earthquake activity is significantly above Texas state average. It is 21% smaller than the overall U.S. average.On 10/20/2011 at 12:24:41, a magnitude 4.8 (4.8 MW, Depth: 3.1 mi, Class: Light, Intensity: IV - V) earthquake occurred 81.5 miles away from Kendall County center
On 4/14/1995 at 00:32:56, a magnitude 5.7 (5.6 MB, 5.7 MS, 5.7 MW, Depth: 11.1 mi, Class: Moderate, Intensity: VI - VII) earthquake occurred 278.7 miles away from the county center
On 6/16/1978 at 11:46:54, a magnitude 5.3 (4.4 MB, 4.6 UK, 5.3 ML) earthquake occurred 247.7 miles away from the county center
On 4/9/1993 at 12:29:19, a magnitude 4.3 (4.1 MB, 4.3 LG, Depth: 3.1 mi) earthquake occurred 83.6 miles away from the county center
On 5/1/2018 at 16:28:56, a magnitude 4.0 (4.0 MW, Depth: 3.1 mi) earthquake occurred 79.1 miles away from Kendall County center
On 4/7/2008 at 09:51:12, a magnitude 3.9 (3.9 MW, Depth: 3.1 mi, Class: Light, Intensity: II - III) earthquake occurred 79.6 miles away from the county center
Magnitude types: regional Lg-wave magnitude (LG), body-wave magnitude (MB), local magnitude (ML), surface-wave magnitude (MS), moment magnitude (MW)
Most recent natural disasters:
- Texas Covid-19 Pandemic, Incident Period: January 20, 2020, FEMA Id: 4485, Natural disaster type: Other
- Texas Severe Storms, Tornadoes, Straight-line Winds, and Flooding, Incident Period: May 04, 2015 to June 23, 2015, Major Disaster (Presidential) Declared DR-4223: May 29, 2015, FEMA Id: 4223, Natural disaster type: Storm, Tornado, Flood, Wind
- Texas Wildfires, Incident Period: March 14, 2008 to September 01, 2008, Emergency Declared EM-3284: March 14, 2008, FEMA Id: 3284, Natural disaster type: Fire
- Texas Tropical Storm Erin, Incident Period: August 14, 2007 to August 20, 2007, Major Disaster (Presidential) Declared DR-1730: October 02, 2007, FEMA Id: 1730, Natural disaster type: Tropical Storm
- Texas Hurricane Rita, Incident Period: September 23, 2005 to October 14, 2005, Major Disaster (Presidential) Declared DR-1606: September 24, 2005, FEMA Id: 1606, Natural disaster type: Hurricane
- Texas Hurricane Rita, Incident Period: September 20, 2005 to October 14, 2005, Emergency Declared EM-3261: September 21, 2005, FEMA Id: 3261, Natural disaster type: Hurricane
- Texas Hurricane Katrina, Incident Period: August 29, 2005 to October 01, 2005, Emergency Declared EM-3216: September 02, 2005, FEMA Id: 3216, Natural disaster type: Hurricane
- Texas Severe Storms and Flooding, Incident Period: June 29, 2002 to July 31, 2002, Major Disaster (Presidential) Declared DR-1425: July 04, 2002, FEMA Id: 1425, Natural disaster type: Storm, Flood
- Texas Frost Fire, Incident Period: September 06, 2000 to September 07, 2000, Fire Management Assistance Declared: September 07, 2000, FEMA Id: 2334, Natural disaster type: Fire
- Texas Extreme Fire Hazards, Incident Period: August 01, 1999 to December 10, 1999, Emergency Declared EM-3142: September 01, 1999, FEMA Id: 3142, Natural disaster type: Fire
- 4 other natural disasters have been reported since 1953.
The number of natural disasters in Kendall County (14) is near the US average (15).
Major Disasters (Presidential) Declared: 7
Emergencies Declared: 5
Causes of natural disasters: Floods: 5, Storms: 5, Fires: 4, Hurricanes: 3, Tornadoes: 2, Tropical Storm: 1, Wind: 1, Other: 1 (Note: some incidents may be assigned to more than one category).
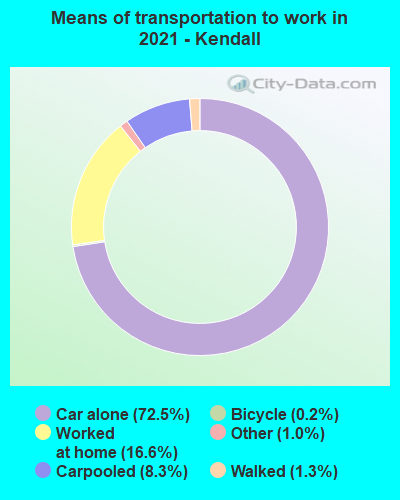
Means of transportation to work:
- Drove a car alone: 15,720 (66.8%)
- Carpooled: 2,221 (9.4%)
- Taxicab, motorcycle, or other means: 431 (1.8%)
- Bicycle: 50 (0.2%)
- Walked: 257 (1.1%)
- Worked at home: 5,457 (23.2%)
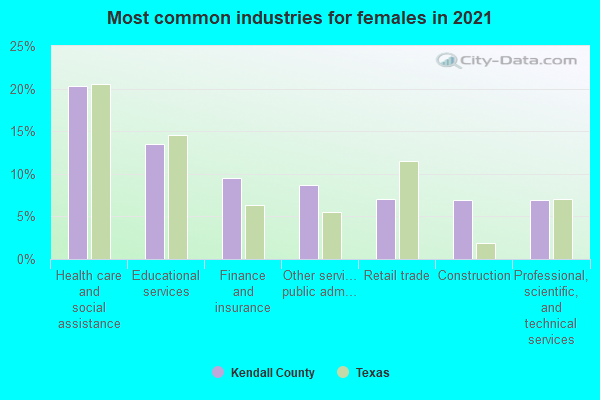
- Health care and social assistance (16%)
- Educational services (10%)
- Finance and insurance (8%)
- Retail trade (8%)
- Professional, scientific, and technical services (7%)
- Other services, except public administration (6%)
- Construction (6%)
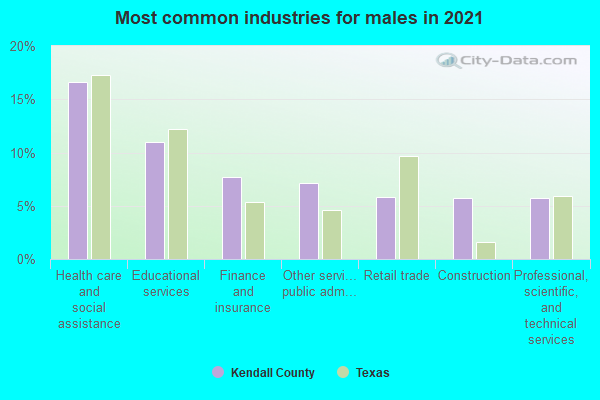
- Health care and social assistance (19%)
- Educational services (12%)
- Finance and insurance (10%)
- Retail trade (9%)
- Professional, scientific, and technical services (9%)
- Other services, except public administration (7%)
- Construction (7%)
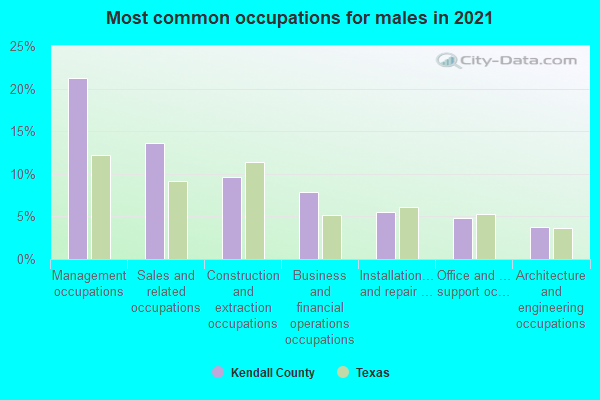
- Management occupations (23%)
- Sales and related occupations (13%)
- Construction and extraction occupations (10%)
- Business and financial operations occupations (8%)
- Installation, maintenance, and repair occupations (6%)
- Office and administrative support occupations (5%)
- Food preparation and serving related occupations (3%)
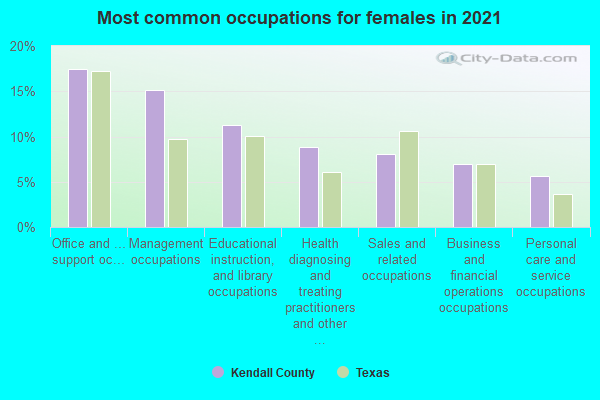
- Office and administrative support occupations (16%)
- Management occupations (15%)
- Sales and related occupations (10%)
- Educational instruction, and library occupations (10%)
- Health diagnosing and treating practitioners and other technical occupations (9%)
- Business and financial operations occupations (8%)
- Building and grounds cleaning and maintenance occupations (5%)
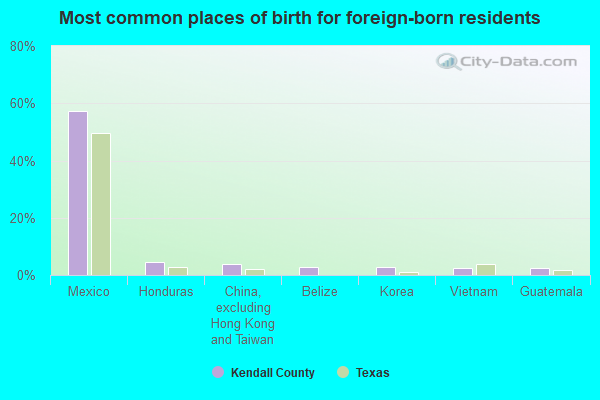
- Mexico (59%)
- Honduras (5%)
- Korea (4%)
- Philippines (4%)
- China, excluding Hong Kong and Taiwan (3%)
- Vietnam (2%)
- Canada (2%)
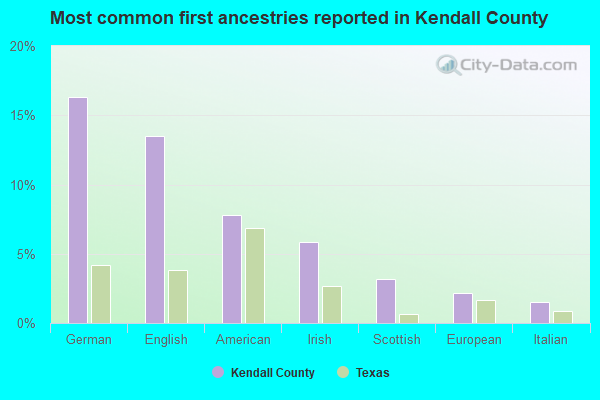
- German (16%)
- English (14%)
- American (8%)
- Irish (5%)
- Scottish (2%)
- European (2%)
- Italian (1%)
People in group quarters in Kendall County, Texas in 2010:
- 340 people in nursing facilities/skilled-nursing facilities
- 57 people in other noninstitutional facilities
- 40 people in residential treatment centers for juveniles (non-correctional)
- 31 people in local jails and other municipal confinement facilities
- 29 people in group homes for juveniles (non-correctional)
- 22 people in workers' group living quarters and job corps centers
People in group quarters in Kendall County, Texas in 2000:
- 311 people in nursing homes
- 66 people in other noninstitutional group quarters
- 52 people in college dormitories (includes college quarters off campus)
- 27 people in other types of correctional institutions
- 23 people in religious group quarters
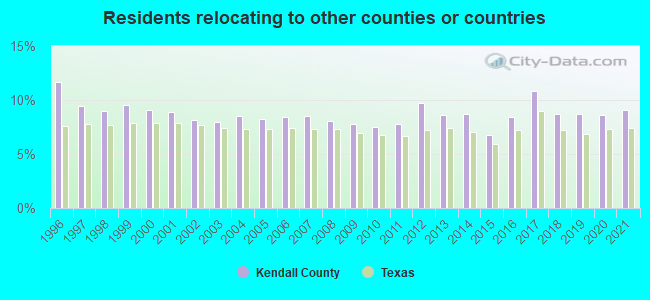
13.41% of this county's 2021 resident taxpayers lived in other counties in 2020 ($135,930 average adjusted gross income)
| Here: | 13.41% |
| Texas average: | 8.12% |
10 or fewer of this county's residents moved from foreign countries.
9.81% relocated from other counties in Texas ($97,999 average AGI)
3.60% relocated from other states ($37,931 average AGI)
Kendall County: 3.60% Texas average: 2.83%

Top counties from which taxpayers relocated into this county between 2020 and 2021:
| from Bexar County, TX | |
| from Comal County, TX | |
| from Kerr County, TX | |
| from Travis County, TX | |
| from Harris County, TX | |
| from Bandera County, TX | |
| from Los Angeles County, CA |
9.09% of this county's 2020 resident taxpayers moved to other counties in 2021 ($92,547 average adjusted gross income)
| Here: | 9.09% |
| Texas average: | 7.40% |
10 or fewer of this county's residents moved to foreign countries.
7.36% relocated to other counties in Texas ($72,436 average AGI)
1.73% relocated to other states ($20,112 average AGI)
Kendall County: 1.73% Texas average: 2.08%
Top counties to which taxpayers relocated from this county between 2020 and 2021:
| to Bexar County, TX | |
| to Kerr County, TX | |
| to Comal County, TX | |
| to Bandera County, TX | |
| to Travis County, TX | |
| to Gillespie County, TX | |
| to Harris County, TX |
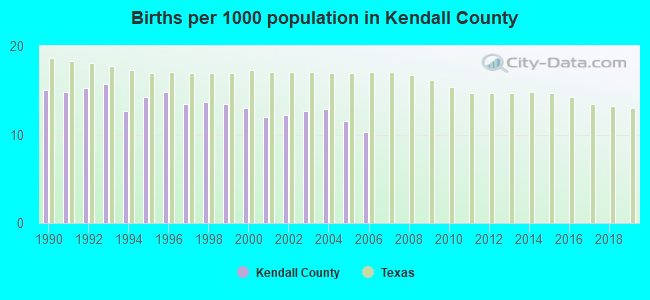
Births per 1000 population from 1990 to 1999: 14.3
Births per 1000 population from 2000 to 2006: 12.1
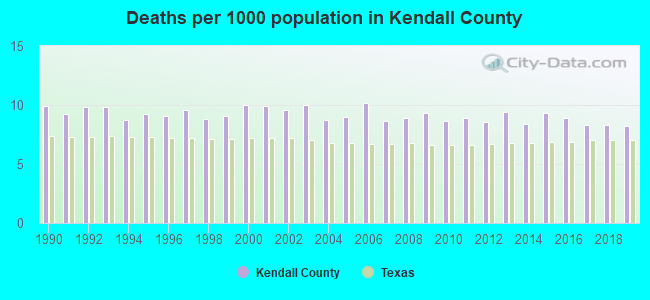
Deaths per 1000 population from 1990 to 1999: 9.3
Deaths per 1000 population from 2000 to 2009: 9.4
Deaths per 1000 population from 2010 to 2020: 8.8
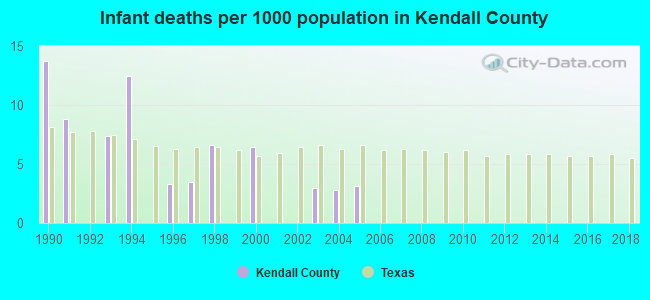
Infant deaths per 1000 live births from 1990 to 1999: 5.6
Infant deaths per 1000 live births from 2000 to 2006: 2.2
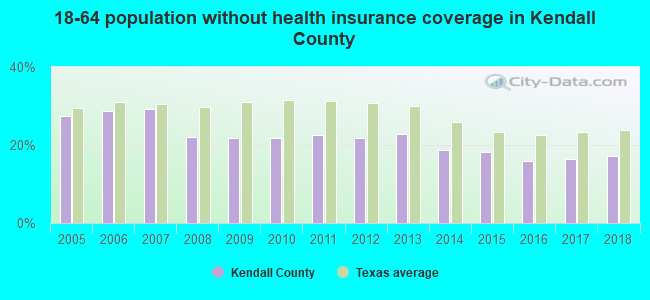
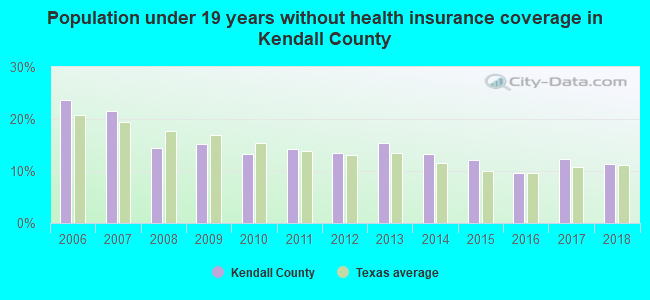
Persons under 19 years old without health insurance coverage in 2018: 11.4%


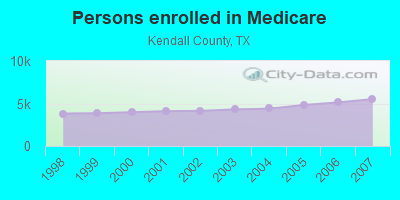
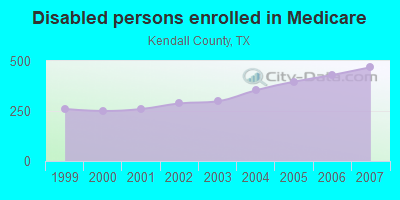
Persons enrolled in hospital insurance and/or supplemental medical insurance (Medicare) in July 1, 2007: 5,518 (5,049 aged, 469 disabled)
Children under 18 without health insurance coverage in 2007: 1,681 (21%)

Most common underlying causes of death in Kendall County, Texas in 1999 - 2019:
- Acute myocardial infarction, unspecified (549)
- Atherosclerotic heart disease (369)
- Bronchus or lung, unspecified - Malignant neoplasms (328)
- Unspecified dementia (266)
- Chronic obstructive pulmonary disease, unspecified (228)
- Alzheimer disease, unspecified (208)
- Stroke, not specified as haemorrhage or infarction (78)
- Senile degeneration of brain, not elsewhere classified (60)
- Congestive heart failure (42)
- Essential (primary) hypertension (24)
Population without health insurance coverage in 2000: 15%
Children under 18 without health insurance coverage in 2000: 17%
Medical specialist MDs per 100,000 population in 2005: 923
Dentists per 100,000 population in 1998: 4
Total births per 100,000 population, July 2005 - July 2006 : 71
Total deaths per 100,000 population, July 2005 - July 2006: 66
Limited-service eating places per 100,000 population in 2005 : 10
Suicides per 1,000,000 population from 2000 to 2006: 135.1. This is more than state average.
Household type by relationship:
Households: 46,595- Male householders: 8,901 (1,842 living alone), Female householders: 8,816 (2,074 living alone)
11,335 spouses (11,291 opposite-sex spouses), 785 unmarried partners, (785 opposite-sex unmarried partners), 13,546 children (12,414 natural, 238 adopted, 895 stepchildren), 909 grandchildren, 152 brothers or sisters, 553 parents, 68 foster children, 437 other relatives, 663 non-relatives
- In group quarters: 568
Size of family households: 6,213 2-persons, 2,603 3-persons, 2,222 4-persons, 1,542 5-persons, 413 6-persons, 398 7-or-more-persons.
Size of nonfamily households: 3,917 1-person, 339 2-persons, 28 3-persons.
7,474 married couples with children.
1,774 single-parent households (779 men, 995 women).
85.7% of residents of Kendall speak English at home.
12.6% of residents speak Spanish at home (61% speak English very well, 15% speak English well, 21% speak English not well, 3% don't speak English at all).
0.7% of residents speak other Indo-European language at home (63% speak English very well, 7% speak English well, 30% speak English not well).
0.9% of residents speak Asian or Pacific Island language at home (77% speak English very well, 23% speak English well).
0.2% of residents speak other language at home (100% speak English very well).
In fiscal year 2004:
Federal Government expenditure: $167,521,000 ($6,156 per capita)
Department of Defense expenditure: $55,861,000
Federal direct payments to individuals for retirement and disability: $109,919,000
Federal other direct payments to individuals: $23,245,000
Federal direct payments not to individuals: $180,000
Federal grants: $6,344,000
Federal procurement contracts: $23,771,000 ($21,573,000 Department of Defense)
Federal salaries and wages: $4,062,000 ($0,000 Department of Defense)
Federal Government direct loans: $0,000
Federal guaranteed/insured loans: $13,930,000
Federal Government insurance: $71,246,000
Population change from April 1, 2000 to July 1, 2005:
Births: 1,628| Here: | 57 per 1000 residents |
| State: | 85 per 1000 residents |
Deaths: 1,309
| Here: | 46 per 1000 residents |
| State: | 35 per 1000 residents |
Net international migration: +222
| Here: | +8 per 1000 residents |
| State: | +29 per 1000 residents |
Net internal migration: +4,419
| Here: | +154 per 1000 residents |
| State: | +10 per 1000 residents |
Total withdrawal of fresh water for public supply: 1.72 millions of gallons per day (89% from ground, 11% from surface)
| Here: | 6.8 |
| State: | 6.3 |
| Here: | 4.6 |
| State: | 4.0 |
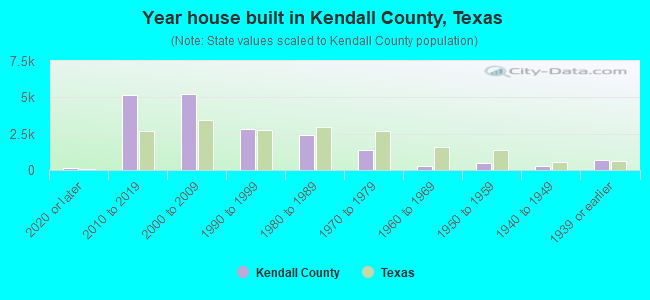
- Year house built in Kendall County, Texas
- 3352020 or later
- 5,2262010 to 2019
- 5,1712000 to 2009
- 3,1281990 to 1999
- 2,4061980 to 1989
- 1,2031970 to 1979
- 3531960 to 1969
- 3371950 to 1959
- 2321940 to 1949
- 6931939 or earlier
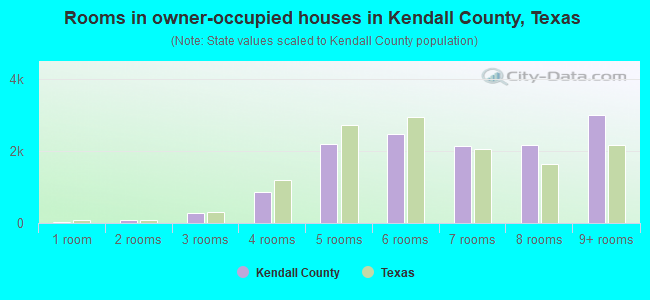
- Rooms in owner-occupied houses in Kendall County, Texas
- 191 room
- 962 rooms
- 2443 rooms
- 9644 rooms
- 2,1795 rooms
- 2,5216 rooms
- 2,3107 rooms
- 2,2528 rooms
- 2,9559+ rooms
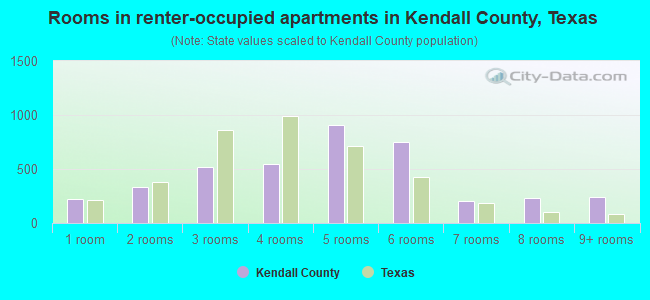
- Rooms in renter-occupied apartments in Kendall County, Texas
- 2361 room
- 4392 rooms
- 6333 rooms
- 6764 rooms
- 8305 rooms
- 6536 rooms
- 1957 rooms
- 2848 rooms
- 2509+ rooms
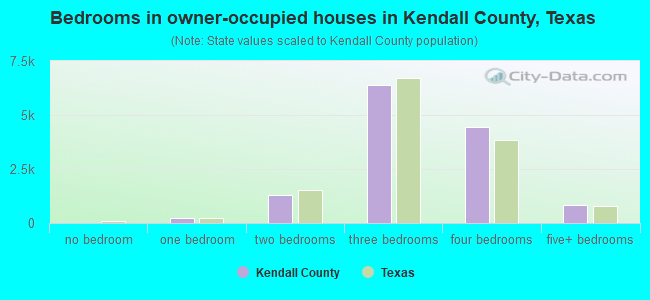
- Bedrooms in owner-occupied houses in Kendall County, Texas
- 21no bedroom
- 2361 bedroom
- 1,3522 bedrooms
- 6,3863 bedrooms
- 4,6004 bedrooms
- 9535+ bedrooms
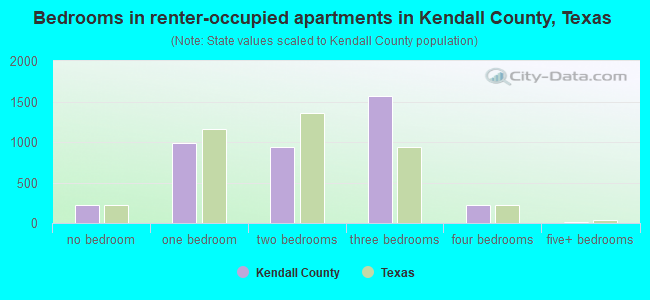
- Bedrooms in renter-occupied apartments in Kendall County, Texas
- 235no bedroom
- 1,0971 bedroom
- 1,0802 bedrooms
- 1,5213 bedrooms
- 2074 bedrooms
- 175+ bedrooms
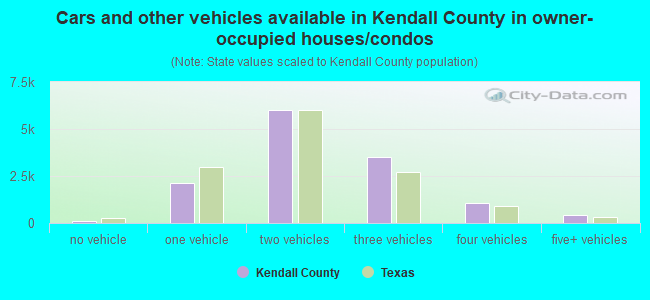
- Cars and other vehicles available in Kendall County in owner-occupied houses/condos
- 96no vehicle
- 2,1771 vehicle
- 6,1852 vehicles
- 3,4763 vehicles
- 1,0824 vehicles
- 4775+ vehicles
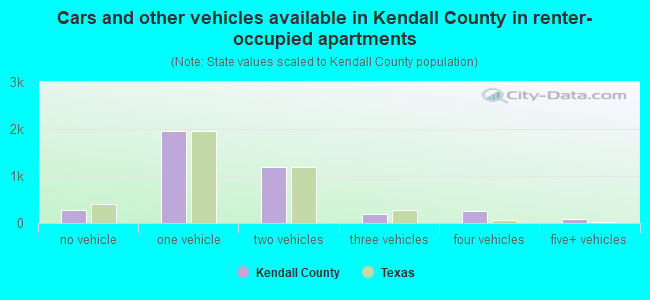
- Cars and other vehicles available in Kendall County in renter-occupied apartments
- 378no vehicle
- 1,9641 vehicle
- 1,3962 vehicles
- 1993 vehicles
- 1444 vehicles
- 945+ vehicles
86.9% of Kendall County residents lived in the same house 1 years ago.
Out of people who lived in different houses, 28% lived in this county.
Out of people who lived in different counties, 75% lived in Texas.
| Kendall County: | 86.9% |
| State average: | 85.7% |
Place of birth for U.S.-born residents:
- This state: 26,761
- Other state: 15,503
- Northeast: 1,880
- Midwest: 4,236
- South: 4,565
- West: 4,852
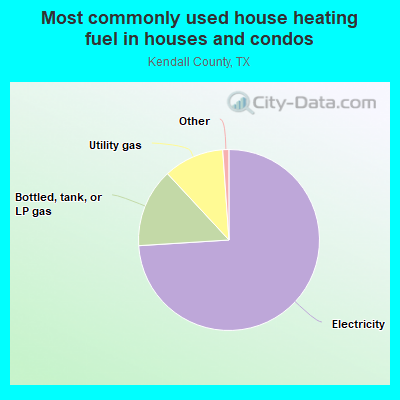
- 74.0%Electricity
- 13.1%Bottled, tank, or LP gas
- 12.0%Utility gas
- 0.6%Wood
- 0.3%Other fuel
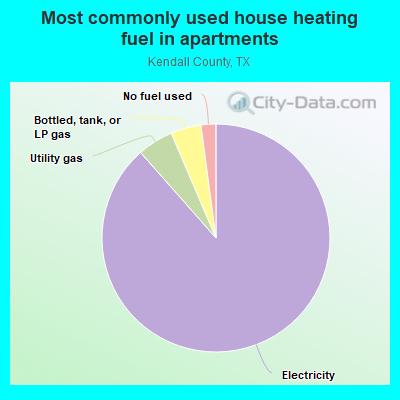
- 90.7%Electricity
- 4.0%Utility gas
- 2.7%Bottled, tank, or LP gas
- 2.4%No fuel used
- 0.3%Wood
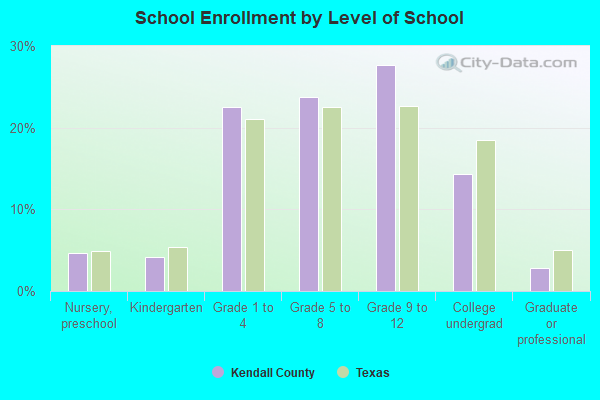
Private vs. public school enrollment:
| Here: | 14.8% |
| Texas: | 8.8% |
| Here: | 15.7% |
| Texas: | 8.0% |
| Here: | 20.0% |
| Texas: | 16.2% |
Kendall County government finances - Expenditure in 2017:
- Bond Funds - Cash and Securities: $164,000
- Charges - Other: $1,710,000
Solid Waste Management: $160,000
Parks and Recreation: $3,000
- Construction - Regular Highways: $1,241,000
General Public Buildings: $163,000
Parks and Recreation: $29,000
- Current Operations - Police Protection: $5,212,000
Judicial and Legal Services: $3,168,000
Regular Highways: $3,020,000
Central Staff Services: $2,499,000
Health - Other: $1,710,000
Financial Administration: $1,655,000
Correctional Institutions: $1,543,000
General - Other: $1,383,000
General Public Buildings: $979,000
Local Fire Protection: $712,000
Parks and Recreation: $488,000
Solid Waste Management: $447,000
Public Welfare - Other: $308,000
Natural Resources - Other: $231,000
Libraries: $165,000
Housing and Community Development: $161,000
- General - Interest on Debt: $326,000
- Intergovernmental to Local - Other - Police Protection: $320,000
Other - Local Fire Protection: $222,000
Other - Judicial and Legal Services: $188,000
Other - Libraries: $176,000
Other - Parks and Recreation: $10,000
- Long Term Debt - Beginning Outstanding - Unspecified Public Purpose: $9,543,000
Outstanding Unspecified Public Purpose: $8,598,000
Retired Unspecified Public Purpose: $945,000
- Miscellaneous - Fines and Forfeits: $343,000
General Revenue - Other: $136,000
Interest Earnings: $33,000
Sale of Property: $17,000
Rents: $7,000
Donations From Private Sources: $4,000
- Other Capital Outlay - Police Protection: $304,000
Parks and Recreation: $272,000
Health - Other: $84,000
Regular Highways: $73,000
General - Other: $13,000
Correctional Institutions: $8,000
- Other Funds - Cash and Securities: $10,071,000
- Sinking Funds - Cash and Securities: $427,000
- State Intergovernmental - Other: $899,000
Highways: $31,000
- Tax - Property: $18,815,000
General Sales and Gross Receipts: $2,589,000
Motor Vehicle License: $1,887,000
Other License: $85,000
Occupation and Business License - Other: $61,000
Alcoholic Beverage License: $55,000
Other: $15,000
- Total Salaries and Wages: $8,857,000
Kendall County government finances - Revenue in 2017:
- Bond Funds - Cash and Securities: $164,000
- Charges - Other: $1,710,000
Solid Waste Management: $160,000
Parks and Recreation: $3,000
- Construction - Regular Highways: $1,241,000
General Public Buildings: $163,000
Parks and Recreation: $29,000
- Current Operations - Police Protection: $5,212,000
Judicial and Legal Services: $3,168,000
Regular Highways: $3,020,000
Central Staff Services: $2,499,000
Health - Other: $1,710,000
Financial Administration: $1,655,000
Correctional Institutions: $1,543,000
General - Other: $1,383,000
General Public Buildings: $979,000
Local Fire Protection: $712,000
Parks and Recreation: $488,000
Solid Waste Management: $447,000
Public Welfare - Other: $308,000
Natural Resources - Other: $231,000
Libraries: $165,000
Housing and Community Development: $161,000
- General - Interest on Debt: $326,000
- Intergovernmental to Local - Other - Police Protection: $320,000
Other - Local Fire Protection: $222,000
Other - Judicial and Legal Services: $188,000
Other - Libraries: $176,000
Other - Parks and Recreation: $10,000
- Long Term Debt - Beginning Outstanding - Unspecified Public Purpose: $9,543,000
Outstanding Unspecified Public Purpose: $8,598,000
Retired Unspecified Public Purpose: $945,000
- Miscellaneous - Fines and Forfeits: $343,000
General Revenue - Other: $136,000
Interest Earnings: $33,000
Sale of Property: $17,000
Rents: $7,000
Donations From Private Sources: $4,000
- Other Capital Outlay - Police Protection: $304,000
Parks and Recreation: $272,000
Health - Other: $84,000
Regular Highways: $73,000
General - Other: $13,000
Correctional Institutions: $8,000
- Other Funds - Cash and Securities: $10,071,000
- Sinking Funds - Cash and Securities: $427,000
- State Intergovernmental - Other: $899,000
Highways: $31,000
- Tax - Property: $18,815,000
General Sales and Gross Receipts: $2,589,000
Motor Vehicle License: $1,887,000
Other License: $85,000
Occupation and Business License - Other: $61,000
Alcoholic Beverage License: $55,000
Other: $15,000
- Total Salaries and Wages: $8,857,000
Kendall County government finances - Debt in 2017:
- Bond Funds - Cash and Securities: $164,000
- Charges - Other: $1,710,000
Solid Waste Management: $160,000
Parks and Recreation: $3,000
- Construction - Regular Highways: $1,241,000
General Public Buildings: $163,000
Parks and Recreation: $29,000
- Current Operations - Police Protection: $5,212,000
Judicial and Legal Services: $3,168,000
Regular Highways: $3,020,000
Central Staff Services: $2,499,000
Health - Other: $1,710,000
Financial Administration: $1,655,000
Correctional Institutions: $1,543,000
General - Other: $1,383,000
General Public Buildings: $979,000
Local Fire Protection: $712,000
Parks and Recreation: $488,000
Solid Waste Management: $447,000
Public Welfare - Other: $308,000
Natural Resources - Other: $231,000
Libraries: $165,000
Housing and Community Development: $161,000
- General - Interest on Debt: $326,000
- Intergovernmental to Local - Other - Police Protection: $320,000
Other - Local Fire Protection: $222,000
Other - Judicial and Legal Services: $188,000
Other - Libraries: $176,000
Other - Parks and Recreation: $10,000
- Long Term Debt - Beginning Outstanding - Unspecified Public Purpose: $9,543,000
Outstanding Unspecified Public Purpose: $8,598,000
Retired Unspecified Public Purpose: $945,000
- Miscellaneous - Fines and Forfeits: $343,000
General Revenue - Other: $136,000
Interest Earnings: $33,000
Sale of Property: $17,000
Rents: $7,000
Donations From Private Sources: $4,000
- Other Capital Outlay - Police Protection: $304,000
Parks and Recreation: $272,000
Health - Other: $84,000
Regular Highways: $73,000
General - Other: $13,000
Correctional Institutions: $8,000
- Other Funds - Cash and Securities: $10,071,000
- Sinking Funds - Cash and Securities: $427,000
- State Intergovernmental - Other: $899,000
Highways: $31,000
- Tax - Property: $18,815,000
General Sales and Gross Receipts: $2,589,000
Motor Vehicle License: $1,887,000
Other License: $85,000
Occupation and Business License - Other: $61,000
Alcoholic Beverage License: $55,000
Other: $15,000
- Total Salaries and Wages: $8,857,000
Kendall County government finances - Cash and Securities in 2017:
- Bond Funds - Cash and Securities: $164,000
- Charges - Other: $1,710,000
Solid Waste Management: $160,000
Parks and Recreation: $3,000
- Construction - Regular Highways: $1,241,000
General Public Buildings: $163,000
Parks and Recreation: $29,000
- Current Operations - Police Protection: $5,212,000
Judicial and Legal Services: $3,168,000
Regular Highways: $3,020,000
Central Staff Services: $2,499,000
Health - Other: $1,710,000
Financial Administration: $1,655,000
Correctional Institutions: $1,543,000
General - Other: $1,383,000
General Public Buildings: $979,000
Local Fire Protection: $712,000
Parks and Recreation: $488,000
Solid Waste Management: $447,000
Public Welfare - Other: $308,000
Natural Resources - Other: $231,000
Libraries: $165,000
Housing and Community Development: $161,000
- General - Interest on Debt: $326,000
- Intergovernmental to Local - Other - Police Protection: $320,000
Other - Local Fire Protection: $222,000
Other - Judicial and Legal Services: $188,000
Other - Libraries: $176,000
Other - Parks and Recreation: $10,000
- Long Term Debt - Beginning Outstanding - Unspecified Public Purpose: $9,543,000
Outstanding Unspecified Public Purpose: $8,598,000
Retired Unspecified Public Purpose: $945,000
- Miscellaneous - Fines and Forfeits: $343,000
General Revenue - Other: $136,000
Interest Earnings: $33,000
Sale of Property: $17,000
Rents: $7,000
Donations From Private Sources: $4,000
- Other Capital Outlay - Police Protection: $304,000
Parks and Recreation: $272,000
Health - Other: $84,000
Regular Highways: $73,000
General - Other: $13,000
Correctional Institutions: $8,000
- Other Funds - Cash and Securities: $10,071,000
- Sinking Funds - Cash and Securities: $427,000
- State Intergovernmental - Other: $899,000
Highways: $31,000
- Tax - Property: $18,815,000
General Sales and Gross Receipts: $2,589,000
Motor Vehicle License: $1,887,000
Other License: $85,000
Occupation and Business License - Other: $61,000
Alcoholic Beverage License: $55,000
Other: $15,000
- Total Salaries and Wages: $8,857,000
Supplemental Security Income (SSI) in 2006:
- Total number of recipients: 261
- Number of aged recipients: 59
- Number of blind and disabled recipients: 202
- Number of recipients under 18: 48
- Number of recipients between 18 and 64: 130
- Number of recipients older than 64: 83
- Number of recipients also receiving OASDI: 113
- Amount of payments (thousands of dollars): 110
| Most common first names in Kendall County, TX among deceased individuals | ||
| Name | Count | Lived (average) |
|---|---|---|
| Mary | 115 | 81.1 years |
| John | 109 | 75.4 years |
| Robert | 103 | 73.9 years |
| William | 87 | 78.3 years |
| James | 85 | 76.3 years |
| Charles | 76 | 72.8 years |
| Helen | 60 | 83.5 years |
| Walter | 46 | 77.4 years |
| Dorothy | 46 | 80.7 years |
| Margaret | 44 | 82.0 years |
| Most common last names in Kendall County, TX among deceased individuals | ||
| Last name | Count | Lived (average) |
|---|---|---|
| Smith | 59 | 79.9 years |
| Davis | 29 | 80.4 years |
| Brown | 29 | 81.1 years |
| Williams | 25 | 75.8 years |
| Johnson | 24 | 75.3 years |
| Wilson | 24 | 73.8 years |
| Flach | 23 | 81.3 years |
| Miller | 22 | 74.4 years |
| Pfeiffer | 22 | 79.9 years |
| Spenrath | 22 | 79.9 years |
| Businesses in Kendall County, TX | ||||
| Name | Count | Name | Count | |
|---|---|---|---|---|
| AT&T | 1 | McDonald's | 2 | |
| AutoZone | 1 | Nike | 1 | |
| Blockbuster | 1 | Papa John's Pizza | 1 | |
| Burger King | 1 | Penske | 1 | |
| Chevrolet | 1 | Pizza Hut | 1 | |
| Church's Chicken | 1 | Quiznos | 1 | |
| Cricket Wireless | 2 | RadioShack | 1 | |
| Curves | 1 | Sears | 1 | |
| Dairy Queen | 1 | Sprint Nextel | 1 | |
| Dennys | 1 | Starbucks | 1 | |
| FedEx | 9 | T-Mobile | 2 | |
| Ford | 1 | Taco Bell | 1 | |
| GameStop | 1 | Toyota | 1 | |
| H&R Block | 1 | U-Haul | 5 | |
| Holiday Inn | 1 | UPS | 10 | |
| Home Depot | 1 | Walgreens | 1 | |
| La Quinta | 1 | Walmart | 1 | |
| Lane Furniture | 1 | Wendy's | 1 | |
| Little Caesars Pizza | 1 | YMCA | 1 | |
| Marriott | 1 | |||