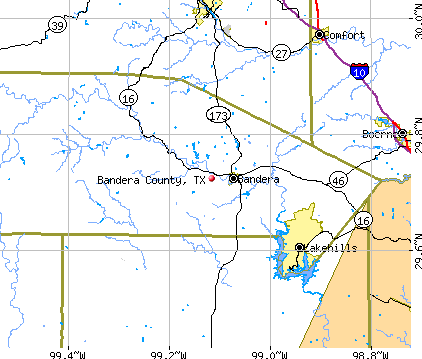
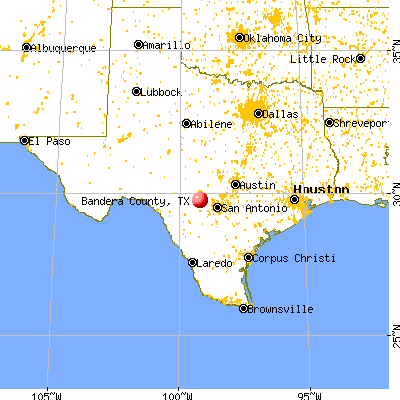
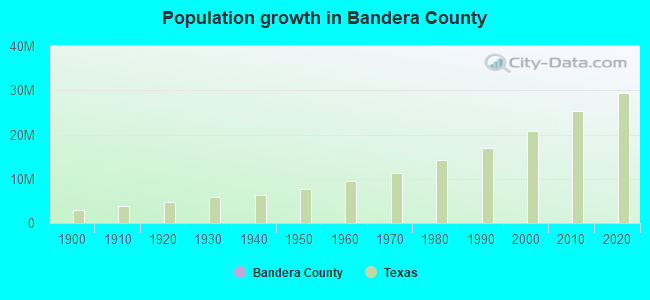
Bandera County, Texas (TX)
County owner-occupied free and clear houses and condos in 2010: 3,361
County owner-occupied houses and condos in 2000: 5,811
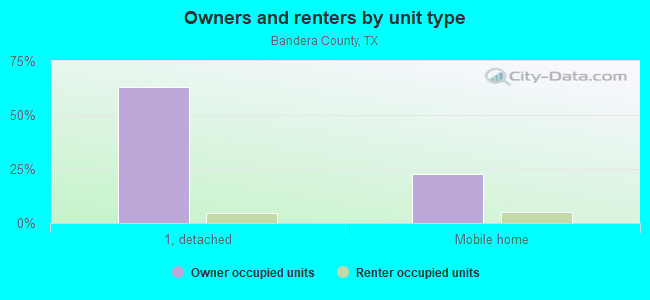
Renter-occupied apartments: 1,406 (it was 1,199 in 2000)
| % of renters here: | 17% |
| State: | 36% |
Land area: 792 sq. mi.
Water area: 5.8 sq. mi.
Population density: 27 people per square mile (low).
Industries providing employment: Educational, health and social services (19.8%), Professional, scientific, management, administrative, and waste management services (15.0%), Construction (14.2%), Retail trade (13.4%).
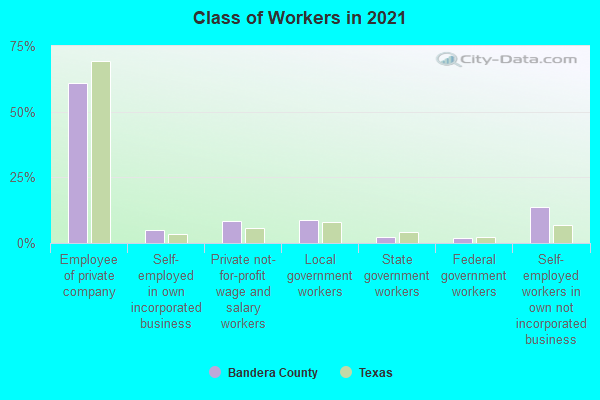
Type of workers:
- Private wage or salary: 76%
- Government: 12%
- Self-employed, not incorporated: 12%
- Unpaid family work: 0%
- OSM Map
- General Map
- Google Map
- MSN Map

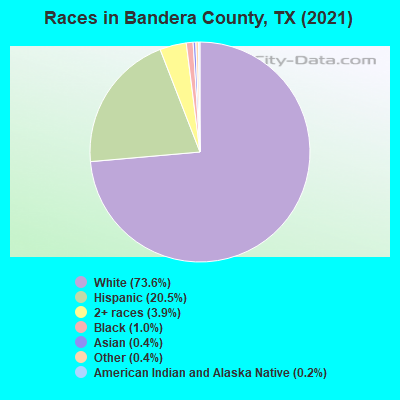
- 15,62372.7%White Non-Hispanic Alone
- 4,49220.9%Hispanic or Latino
- 7733.6%Two or more races
- 2000.9%Black Non-Hispanic Alone
- 1920.9%Some other race alone
- 1080.5%American Indian and Alaska Native alone
- 1080.5%Asian alone
| Median resident age: | 54.0 years |
| Texas median age: | 35.6 years |
| Males: 10,762 | |
| Females: 10,989 |


| Bandera County: | 2.0 people |
| Texas: | 3 people |
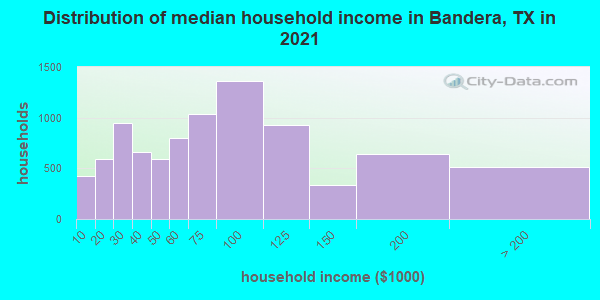
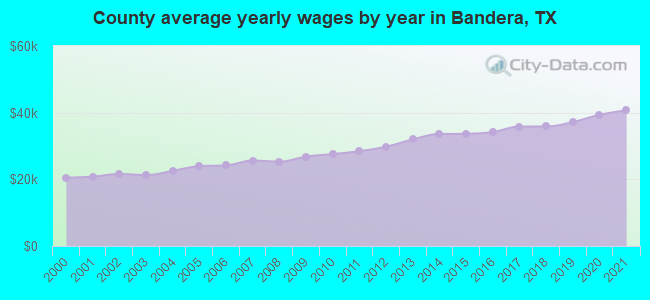
Estimated median household income in 2022: $70,235 ($39,013 in 1999)
| This county: | $70,235 |
| Texas: | $72,284 |
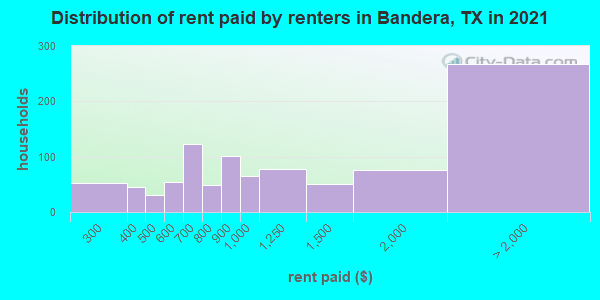
Median contract rent in 2022 for apartments: $812 (lower quartile is $680, upper quartile is $1,018)
| This county: | $812 |
| State: | $1117 |
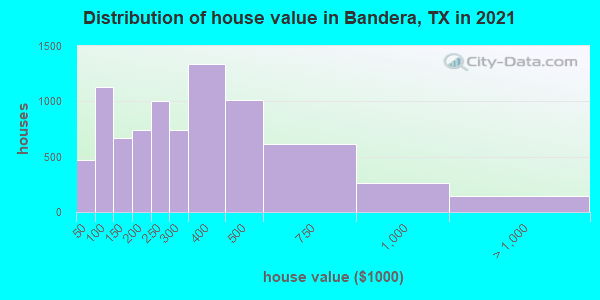
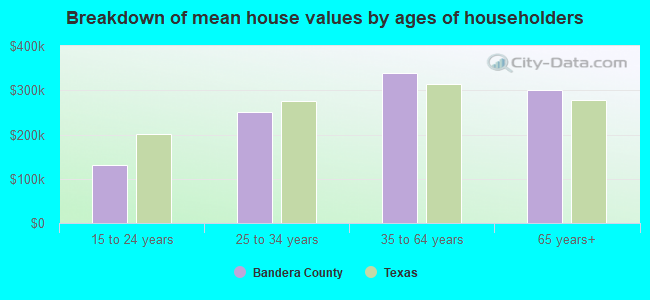
Estimated median house or condo value in 2022: $274,590 (it was $85,900 in 2000)
| Bandera: | $274,590 |
| Texas: | $275,400 |
Median monthly housing costs for homes and condos with a mortgage: $1,729
Median monthly housing costs for units without a mortgage: $453
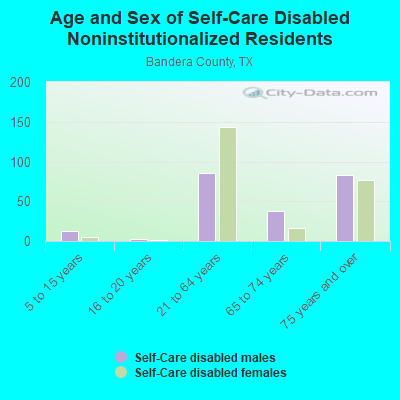
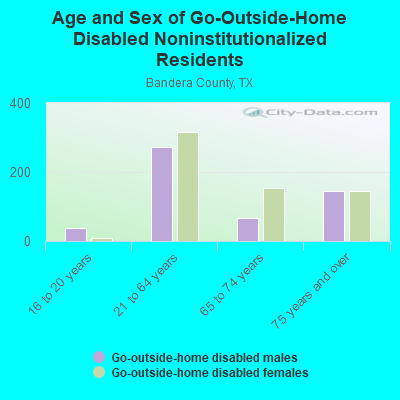
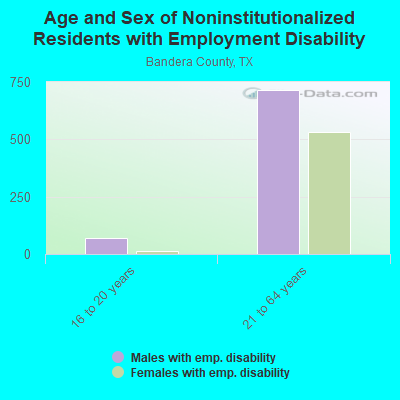
Institutionalized population: 286
Crime in 2021 (reported by the sheriff's office or county police, not the county total):
- Murders: 3
- Rapes: 2
- Robberies: 1
- Assaults: 27
- Burglaries: 41
- Thefts: 90
- Auto thefts: 22
Crime in 2020 (reported by the sheriff's office or county police, not the county total):
- Murders: 0
- Rapes: 1
- Robberies: 0
- Assaults: 12
- Burglaries: 60
- Thefts: 122
- Auto thefts: 23
Health of residents in Bandera County based on CDC Behavioral Risk Factor Surveillance System Survey Questionnaires from 2013 to 2021:
General health status score of residents in this county from 1 (poor) to 5 (excellent) is 3.4. This is worse than average.71.2% of residents exercised in the past month. This is about average.
37.5% of residents smoked 100+ cigarettes in their lives. This is less than average.
53.6% of adult residents drank alcohol in the past 30 days. This is less than average.
65.3% of residents visited a dentist within the past year. This is less than average.
Average weight of males is 199 pounds. This is more than average.
Average weight of females is 163 pounds. This is about average.
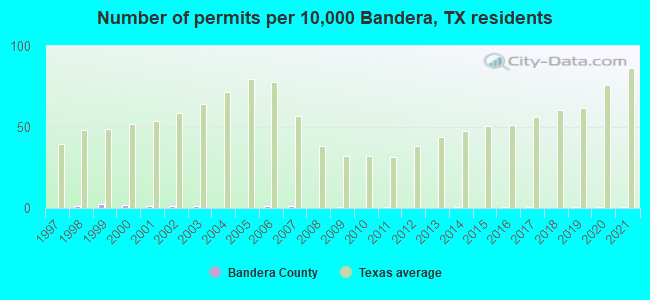
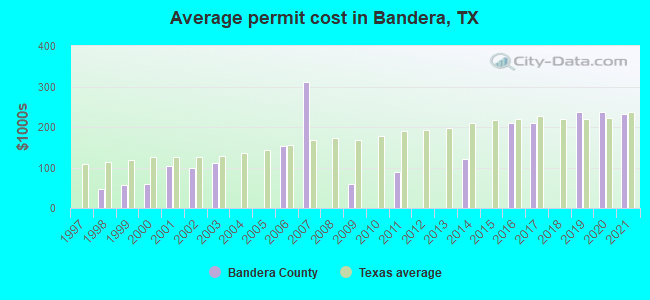
Single-family new house construction building permits:
- 2022: 3 buildings, average cost: $278,300
- 2021: 1 building, cost: $233,100
- 2020: 1 building, cost: $237,500
- 2019: 1 building, cost: $237,500
- 2018: 0 buildings
- 2017: 1 building, cost: $210,000
- 2016: 1 building, cost: $210,000
- 2015: 0 buildings
- 2014: 1 building, cost: $120,000
- 2013: 0 buildings
- 2012: 0 buildings
- 2011: 1 building, cost: $90,000
- 2010: 0 buildings
- 2009: 1 building, cost: $60,000
- 2008: 0 buildings
- 2007: 2 buildings, average cost: $311,700
- 2006: 2 buildings, average cost: $153,000
- 2005: 0 buildings
- 2004: 0 buildings
- 2003: 2 buildings, average cost: $110,400
- 2002: 2 buildings, average cost: $100,200
- 2001: 2 buildings, average cost: $102,500
- 2000: 3 buildings, average cost: $60,400
- 1999: 4 buildings, average cost: $58,300
- 1998: 2 buildings, average cost: $47,100
- 1997: 0 buildings
Median real estate property taxes paid for housing units with mortgages in 2022: $2,830 (0.9%)
Median real estate property taxes paid for housing units with no mortgage in 2022: $2,051 (0.8%)
| Bandera County: | 14.3% |
| Texas: | 14.0% |
Median age of residents in 2022: 54.0 years old
(Males: 53.8 years old, Females: 54.3 years old)
(Median age for: White residents: 57.0 years old, Black residents: 40.9 years old, American Indian residents: 61.4 years old, Asian residents: 49.7 years old, Hispanic or Latino residents: 47.3 years old, Other race residents: 52.0 years old)
Area name: San Antonio, TX HUD Metro FMR Area
Fair market rent in 2006 for a 1-bedroom apartment in Bandera County is $556 a month.
Fair market rent for a 2-bedroom apartment is $687 a month.
Fair market rent for a 3-bedroom apartment is $886 a month.
Cities in this county include: Lakehills, Lake Medina Shores, Bandera.
Neighboring counties: Assumption Parish, Louisiana  , Gulf County, Florida , St. Charles Parish, Louisiana .
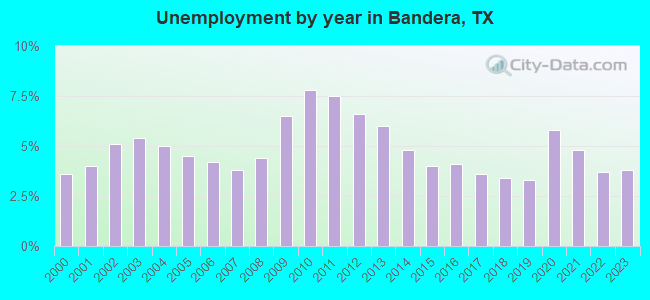
| Here: | 3.0% |
| Texas: | 3.5% |
Current college students: 423
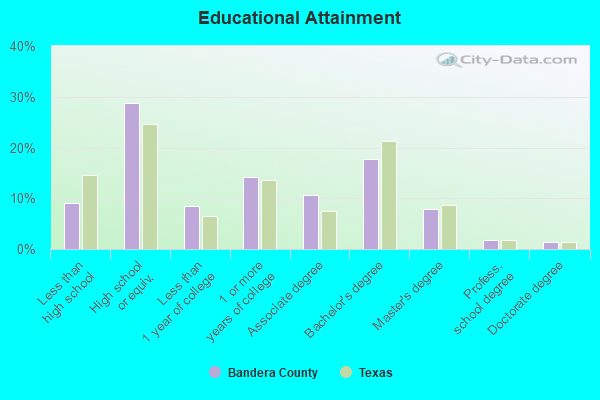
People 25 years of age or older with a high school degree or higher: 92.0%
People 25 years of age or older with a bachelor's degree or higher: 27.3%
Number of foreign born residents: 1,203 (52.5% naturalized citizens)
| Bandera County: | 5.5% |
| Whole state: | 17.2% |
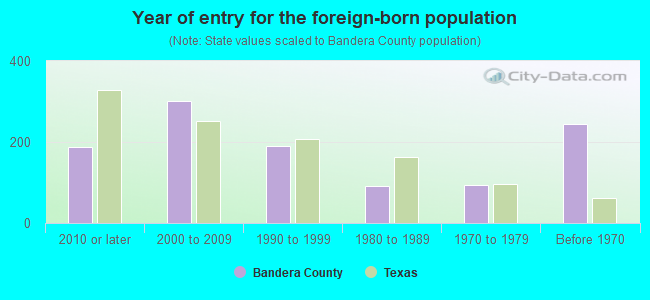
- Year of entry for the foreign-born population
- 1972010 or later
- 2452000 to 2009
- 2051990 to 1999
- 911980 to 1989
- 941970 to 1979
- 245Before 1970
Mean travel time to work (commute): & minutes
Percentage of county residents living and working in this county: 99.9%
Housing units in structures:
- One, detached: 8,378
- One, attached: 122
- Two: 130
- 3 or 4: 3
- 5 to 9: 39
- 10 to 19: 21
- Mobile homes: 2,949
- Boats, RVs, vans, etc.: 141
Housing units in Bandera County with a mortgage: 3,379 (295 second mortgage, 8 home equity loan, 247 both second mortgage and home equity loan)
Houses without a mortgage: 18
| Here: | 14.3% with mortgage |
| State: | 98.4% with mortgage |
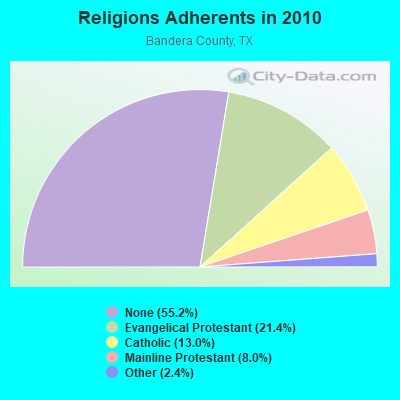
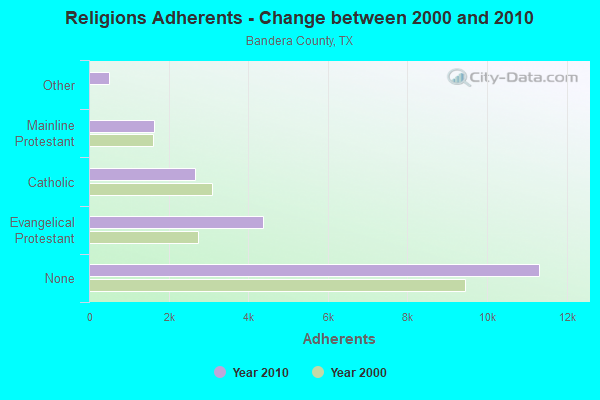
Religion statistics for Bandera County
| Religion | Adherents | Congregations |
|---|---|---|
| Evangelical Protestant | 4,375 | 25 |
| Catholic | 2,661 | 3 |
| Mainline Protestant | 1,640 | 6 |
| Other | 492 | 3 |
| None | 11,317 | - |
Source: Clifford Grammich, Kirk Hadaway, Richard Houseal, Dale E.Jones, Alexei Krindatch, Richie Stanley and Richard H.Taylor. 2012. 2010 U.S.Religion Census: Religious Congregations & Membership Study. Association of Statisticians of American Religious Bodies. Jones, Dale E., et al. 2002. Congregations and Membership in the United States 2000. Nashville, TN: Glenmary Research Center.
Food Environment Statistics:
| Bandera County: | 0.99 / 10,000 pop. |
| State: | 1.47 / 10,000 pop. |
| This county: | 1.49 / 10,000 pop. |
| Texas: | 1.11 / 10,000 pop. |
| Bandera County: | 4.97 / 10,000 pop. |
| Texas: | 3.95 / 10,000 pop. |
| This county: | 9.45 / 10,000 pop. |
| State: | 6.13 / 10,000 pop. |
| Bandera County: | 9.6% |
| Texas: | 8.9% |
| Bandera County: | 26.4% |
| State: | 26.6% |
| Here: | 10.4% |
| State: | 15.7% |
Agriculture in Bandera County:
Average size of farms: 470 acresAverage value of agricultural products sold per farm: $8,925
Average value of crops sold per acre for harvested cropland: $123.25
The value of nursery, greenhouse, floriculture, and sod as a percentage of the total market value of agricultural products sold: 5.16%
The value of livestock, poultry, and their products as a percentage of the total market value of agricultural products sold: 87.40%
Average total farm production expenses per farm: $12,550
Harvested cropland as a percentage of land in farms: 1.94%
Irrigated harvested cropland as a percentage of land in farms: 9.96%
Average market value of all machinery and equipment per farm: $25,991
The percentage of farms operated by a family or individual: 89.87%
Average age of principal farm operators: 60 years
Average number of cattle and calves per 100 acres of all land in farms: 3.33
Vegetables: 11 harvested acres
Land in orchards: 420 acres
Earthquake activity:
Bandera County-area historical earthquake activity is significantly above Texas state average. It is 22% smaller than the overall U.S. average.On 4/14/1995 at 00:32:56, a magnitude 5.7 (5.6 MB, 5.7 MS, 5.7 MW, Depth: 11.1 mi, Class: Moderate, Intensity: VI - VII) earthquake occurred 257.4 miles away from Bandera County center
On 10/20/2011 at 12:24:41, a magnitude 4.8 (4.8 MW, Depth: 3.1 mi, Class: Light, Intensity: IV - V) earthquake occurred 86.3 miles away from the county center
On 6/16/1978 at 11:46:54, a magnitude 5.3 (4.4 MB, 4.6 UK, 5.3 ML) earthquake occurred 248.6 miles away from the county center
On 4/9/1993 at 12:29:19, a magnitude 4.3 (4.1 MB, 4.3 LG, Depth: 3.1 mi) earthquake occurred 87.0 miles away from the county center
On 5/1/2018 at 16:28:56, a magnitude 4.0 (4.0 MW, Depth: 3.1 mi) earthquake occurred 86.0 miles away from Bandera County center
On 4/7/2008 at 09:51:12, a magnitude 3.9 (3.9 MW, Depth: 3.1 mi, Class: Light, Intensity: II - III) earthquake occurred 85.7 miles away from the county center
Magnitude types: regional Lg-wave magnitude (LG), body-wave magnitude (MB), local magnitude (ML), surface-wave magnitude (MS), moment magnitude (MW)
Most recent natural disasters:
- Texas Covid-19 Pandemic, Incident Period: January 20, 2020, FEMA Id: 4485, Natural disaster type: Other
- Texas Severe Storms and Flooding, Incident Period: May 22, 2016 to June 24, 2016, Major Disaster (Presidential) Declared DR-4272: June 11, 2016, FEMA Id: 4272, Natural disaster type: Storm, Flood
- Texas Wildfires, Incident Period: March 14, 2008 to September 01, 2008, Emergency Declared EM-3284: March 14, 2008, FEMA Id: 3284, Natural disaster type: Fire
- Texas Hurricane Rita, Incident Period: September 23, 2005 to October 14, 2005, Major Disaster (Presidential) Declared DR-1606: September 24, 2005, FEMA Id: 1606, Natural disaster type: Hurricane
- Texas Hurricane Rita, Incident Period: September 20, 2005 to October 14, 2005, Emergency Declared EM-3261: September 21, 2005, FEMA Id: 3261, Natural disaster type: Hurricane
- Texas Hurricane Katrina, Incident Period: August 29, 2005 to October 01, 2005, Emergency Declared EM-3216: September 02, 2005, FEMA Id: 3216, Natural disaster type: Hurricane
- Texas Severe Storms and Flooding, Incident Period: June 29, 2002 to July 31, 2002, Major Disaster (Presidential) Declared DR-1425: July 04, 2002, FEMA Id: 1425, Natural disaster type: Storm, Flood
- Texas Extreme Fire Hazards, Incident Period: August 01, 1999 to December 10, 1999, Emergency Declared EM-3142: September 01, 1999, FEMA Id: 3142, Natural disaster type: Fire
- Texas Severe Storms/Flooding, Incident Period: June 21, 1997 to July 15, 1997, Major Disaster (Presidential) Declared DR-1179: July 07, 1997, FEMA Id: 1179, Natural disaster type: Storm, Flood
- Texas Extreme Fire Hazard, Incident Period: August 30, 1993 to November 15, 1993, Emergency Declared EM-3113: September 10, 1993, FEMA Id: 3113, Natural disaster type: Fire
- 1 other natural disasters have been reported since 1953.
The number of natural disasters in Bandera County (11) is smaller than the US average (15).
Major Disasters (Presidential) Declared: 5
Emergencies Declared: 5
Causes of natural disasters: Floods: 4, Storms: 4, Fires: 3, Hurricanes: 3, Other: 1 (Note: some incidents may be assigned to more than one category).
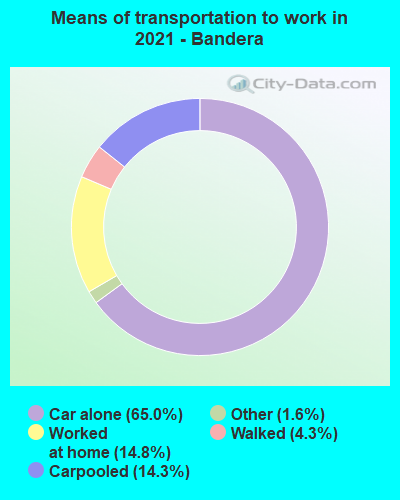
Means of transportation to work:
- Drove a car alone: 3,164 (66.2%)
- Carpooled: 606 (12.7%)
- Taxicab, motorcycle, or other means: 109 (2.3%)
- Walked: 124 (2.6%)
- Worked at home: 840 (17.6%)
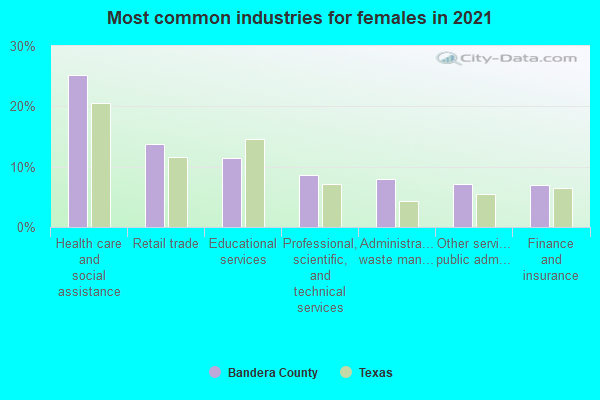
- Health care and social assistance (18%)
- Retail trade (12%)
- Professional, scientific, and technical services (11%)
- Educational services (8%)
- Administrative and support and waste management services (7%)
- Other services, except public administration (7%)
- Accommodation and food services (7%)
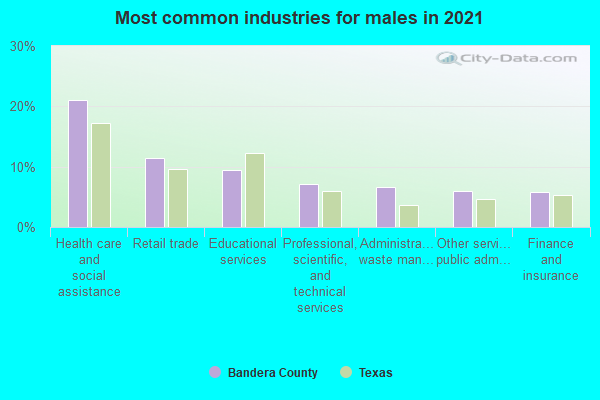
- Health care and social assistance (21%)
- Retail trade (14%)
- Professional, scientific, and technical services (12%)
- Educational services (9%)
- Administrative and support and waste management services (9%)
- Other services, except public administration (8%)
- Accommodation and food services (8%)
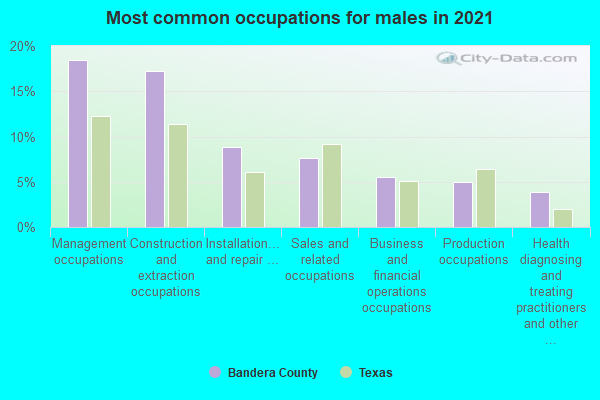
- Management occupations (20%)
- Construction and extraction occupations (14%)
- Sales and related occupations (8%)
- Installation, maintenance, and repair occupations (8%)
- Production occupations (6%)
- Business and financial operations occupations (6%)
- Transportation occupations (4%)
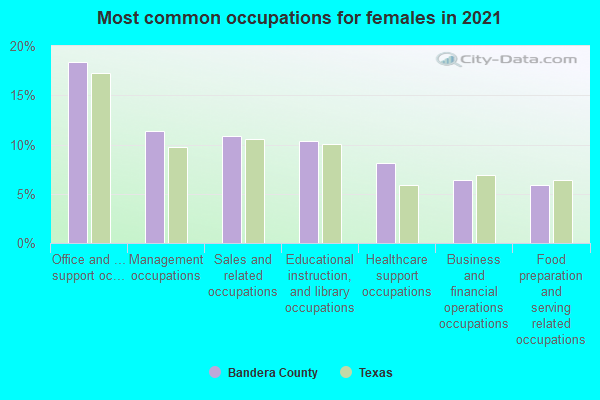
- Office and administrative support occupations (19%)
- Management occupations (13%)
- Sales and related occupations (10%)
- Educational instruction, and library occupations (9%)
- Business and financial operations occupations (8%)
- Healthcare support occupations (7%)
- Food preparation and serving related occupations (6%)
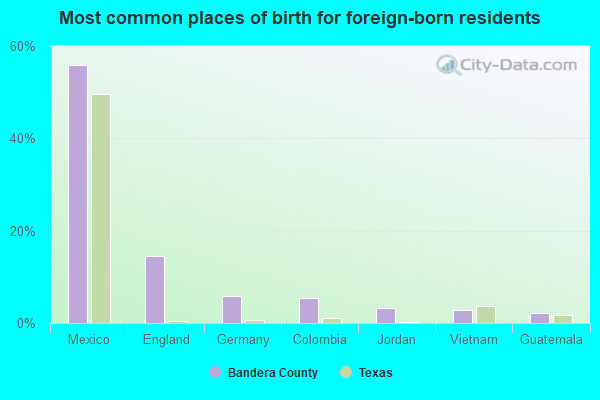
- Mexico (47%)
- England (12%)
- Colombia (9%)
- Germany (6%)
- Vietnam (4%)
- Guatemala (3%)
- Jordan (2%)
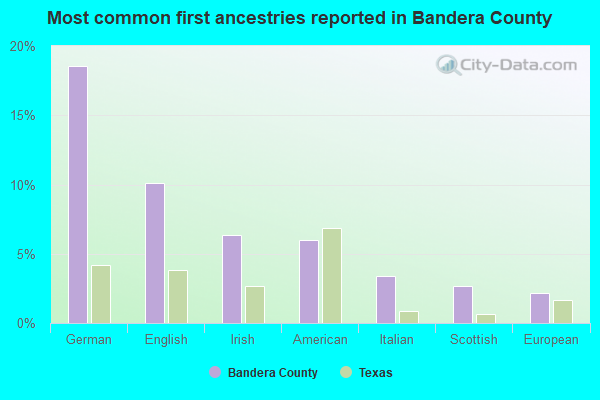
- German (20%)
- English (11%)
- American (7%)
- Irish (6%)
- Scottish (2%)
- European (2%)
- Italian (2%)
People in group quarters in Bandera County, Texas in 2010:
- 118 people in group homes for juveniles (non-correctional)
- 96 people in nursing facilities/skilled-nursing facilities
- 72 people in local jails and other municipal confinement facilities
- 34 people in workers' group living quarters and job corps centers
People in group quarters in Bandera County, Texas in 2000:
- 121 people in other noninstitutional group quarters
- 43 people in nursing homes
- 10 people in local jails and other confinement facilities (including police lockups)
- 3 people in religious group quarters
- 3 people in agriculture workers' dormitories on farms
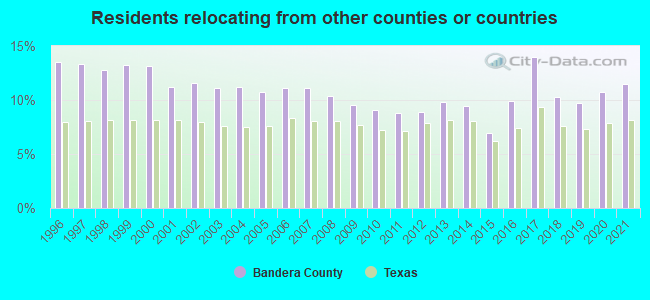
11.44% of this county's 2021 resident taxpayers lived in other counties in 2020 ($80,087 average adjusted gross income)
| Here: | 11.44% |
| Texas average: | 8.12% |
10 or fewer of this county's residents moved from foreign countries.
8.98% relocated from other counties in Texas ($61,177 average AGI)
2.45% relocated from other states ($18,910 average AGI)
Bandera County: 2.45% Texas average: 2.83%
Top counties from which taxpayers relocated into this county between 2020 and 2021:
| from Bexar County, TX | |
| from Kendall County, TX | |
| from Kerr County, TX | |
| from Harris County, TX | |
| from Medina County, TX | |
| from Comal County, TX | |
| from Travis County, TX |
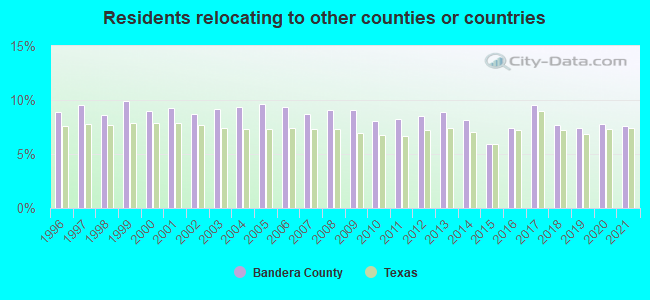
7.60% of this county's 2020 resident taxpayers moved to other counties in 2021 ($52,842 average adjusted gross income)
| Here: | 7.60% |
| Texas average: | 7.40% |
10 or fewer of this county's residents moved to foreign countries.
6.09% relocated to other counties in Texas ($42,613 average AGI)
1.51% relocated to other states ($10,229 average AGI)
Bandera County: 1.51% Texas average: 2.08%
Top counties to which taxpayers relocated from this county between 2020 and 2021:
| to Bexar County, TX | |
| to Kerr County, TX | |
| to Kendall County, TX |
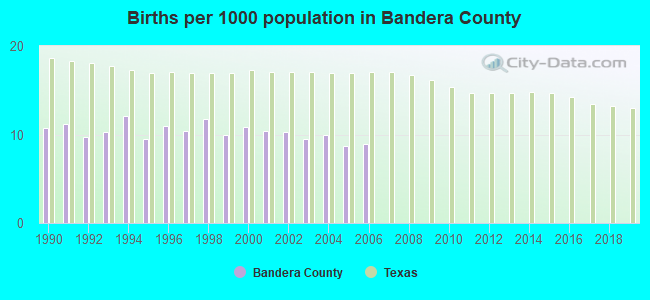
Births per 1000 population from 1990 to 1999: 10.7
Births per 1000 population from 2000 to 2006: 9.8
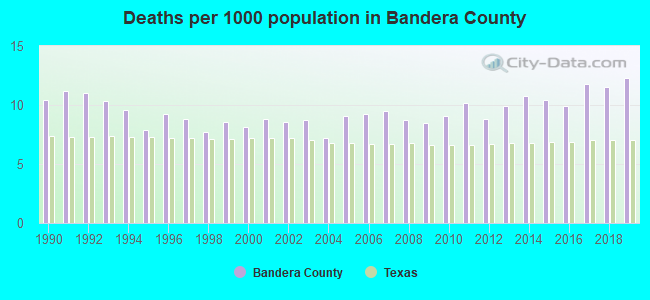
Deaths per 1000 population from 1990 to 1999: 9.5
Deaths per 1000 population from 2000 to 2009: 8.6
Deaths per 1000 population from 2010 to 2020: 10.7
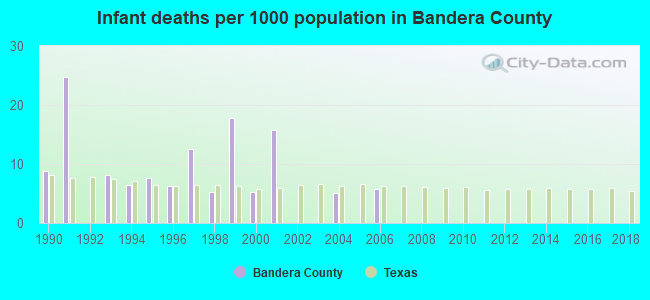
Infant deaths per 1000 live births from 1990 to 1999: 9.8
Infant deaths per 1000 live births from 2000 to 2006: 4.5
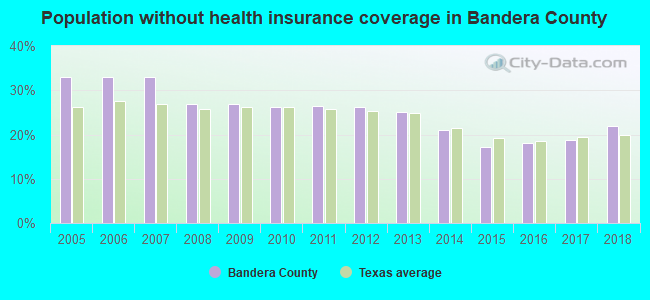
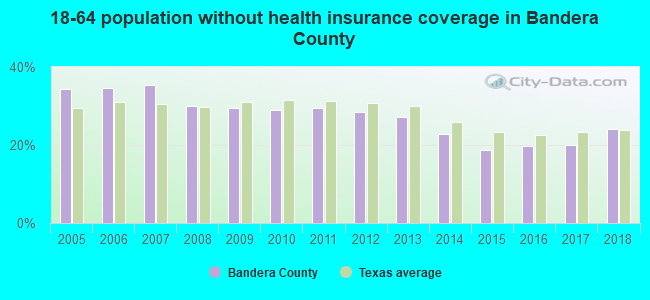
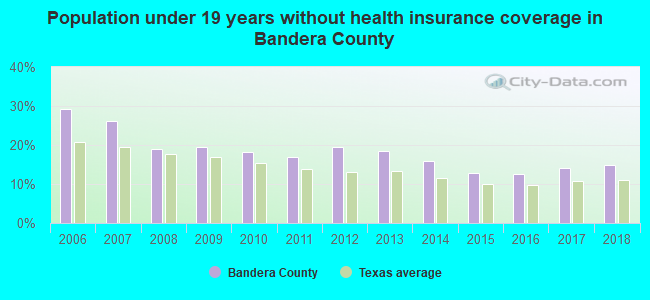
Persons under 19 years old without health insurance coverage in 2018: 14.9%
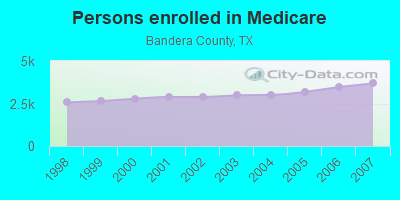
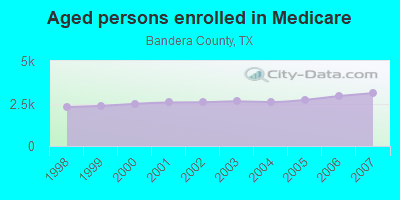
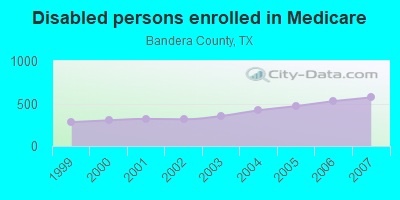
Persons enrolled in hospital insurance and/or supplemental medical insurance (Medicare) in July 1, 2007: 3,682 (3,110 aged, 572 disabled)
Children under 18 without health insurance coverage in 2007: 1,106 (25%)
Most common underlying causes of death in Bandera County, Texas in 1999 - 2019:
- Bronchus or lung, unspecified - Malignant neoplasms (279)
- Acute myocardial infarction, unspecified (209)
- Chronic obstructive pulmonary disease, unspecified (166)
- Atherosclerotic heart disease (155)
- Unspecified dementia (81)
- Senile degeneration of brain, not elsewhere classified (42)
- Alzheimer disease, unspecified (40)
Population without health insurance coverage in 2000: 17%
Children under 18 without health insurance coverage in 2000: 18%
Medical specialist MDs per 100,000 population in 2005: 785
Dentists per 100,000 population in 1998: 5
Total births per 100,000 population, July 2005 - July 2006 : 6
Total deaths per 100,000 population, July 2005 - July 2006: 35
Limited-service eating places per 100,000 population in 2005 : 10
Suicides per 1,000,000 population from 2000 to 2006: 234.3. This is more than state average.
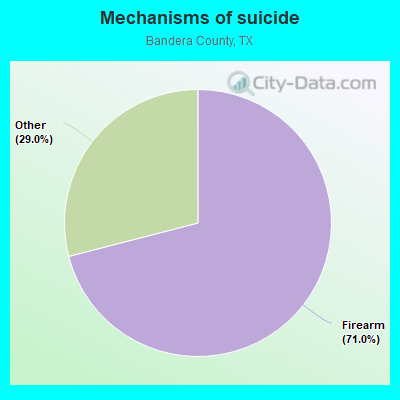
- Firearm - 166.3
- Other - 68.0
Household type by relationship:
Households: 21,751- Male householders: 4,788 (1,234 living alone), Female householders: 4,225 (1,327 living alone)
4,991 spouses (4,931 opposite-sex spouses), 373 unmarried partners, (348 opposite-sex unmarried partners), 4,117 children (3,398 natural, 314 adopted, 409 stepchildren), 792 grandchildren, 72 brothers or sisters, 253 parents, 183 foster children, 688 other relatives, 804 non-relatives
- In group quarters: 472
Size of family households: 3,365 2-persons, 1,237 3-persons, 582 4-persons, 292 5-persons, 344 6-persons, 143 7-or-more-persons.
Size of nonfamily households: 2,562 1-person, 484 2-persons, 62 4-persons.
1,862 married couples with children.
529 single-parent households (115 men, 414 women).
86.9% of residents of Bandera speak English at home.
12.0% of residents speak Spanish at home (64% speak English very well, 18% speak English well, 14% speak English not well, 3% don't speak English at all).
1.1% of residents speak other Indo-European language at home (59% speak English very well, 38% speak English well, 3% speak English not well).
0.3% of residents speak Asian or Pacific Island language at home (48% speak English very well, 29% speak English well, 24% speak English not well).
0.2% of residents speak other language at home (100% speak English very well).
In fiscal year 2004:
Federal Government expenditure: $94,748,000 ($4,796 per capita)
Department of Defense expenditure: $15,427,000
Federal direct payments to individuals for retirement and disability: $65,330,000
Federal other direct payments to individuals: $13,815,000
Federal direct payments not to individuals: $230,000
Federal grants: $10,214,000
Federal procurement contracts: $280,000 ($65,000 Department of Defense)
Federal salaries and wages: $4,879,000 ($3,936,000 Department of Defense)
Federal Government direct loans: $103,000
Federal guaranteed/insured loans: $5,716,000
Federal Government insurance: $42,105,000
Population change from April 1, 2000 to July 1, 2005:
Births: 988| Here: | 49 per 1000 residents |
| State: | 85 per 1000 residents |
Deaths: 832
| Here: | 42 per 1000 residents |
| State: | 35 per 1000 residents |
Net international migration: +107
| Here: | +5 per 1000 residents |
| State: | +29 per 1000 residents |
Net internal migration: +2,124
| Here: | +106 per 1000 residents |
| State: | +10 per 1000 residents |
Total withdrawal of fresh water for public supply: 0.55 millions of gallons per day (all from ground)
| Here: | 5.7 |
| State: | 6.3 |
| Here: | 4.6 |
| State: | 4.0 |
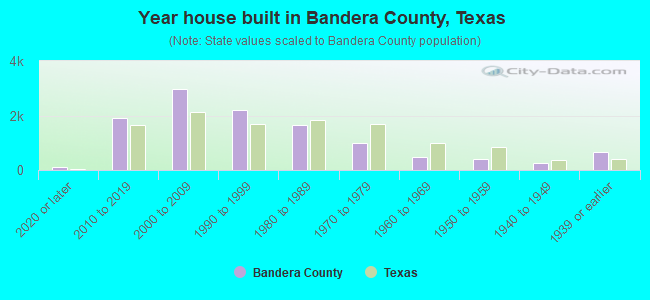
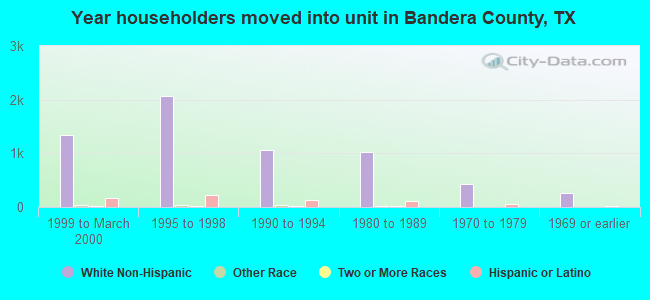
- Year house built in Bandera County, Texas
- 942020 or later
- 2,0872010 to 2019
- 3,0122000 to 2009
- 2,1841990 to 1999
- 1,4841980 to 1989
- 9911970 to 1979
- 5071960 to 1969
- 3971950 to 1959
- 2491940 to 1949
- 6391939 or earlier
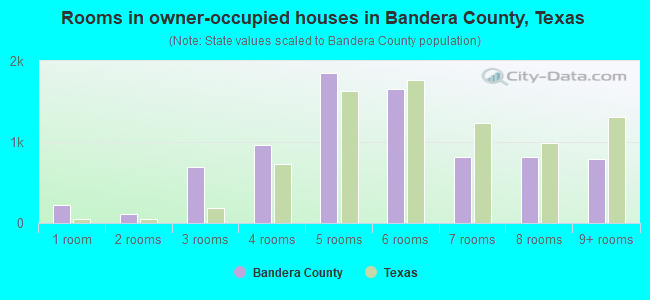
- Rooms in owner-occupied houses in Bandera County, Texas
- 2551 room
- 1972 rooms
- 6013 rooms
- 8744 rooms
- 1,8135 rooms
- 1,6286 rooms
- 9637 rooms
- 6628 rooms
- 9779+ rooms
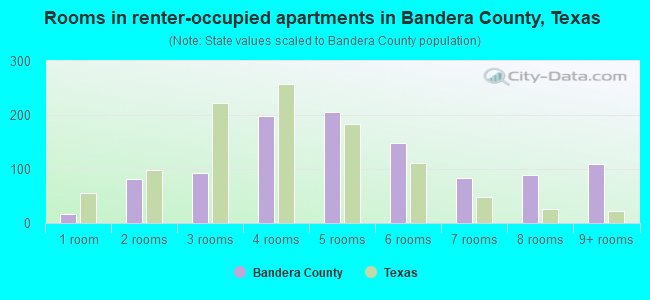
- Rooms in renter-occupied apartments in Bandera County, Texas
- 261 room
- 1122 rooms
- 1593 rooms
- 2284 rooms
- 2195 rooms
- 1216 rooms
- 1257 rooms
- 808 rooms
- 549+ rooms
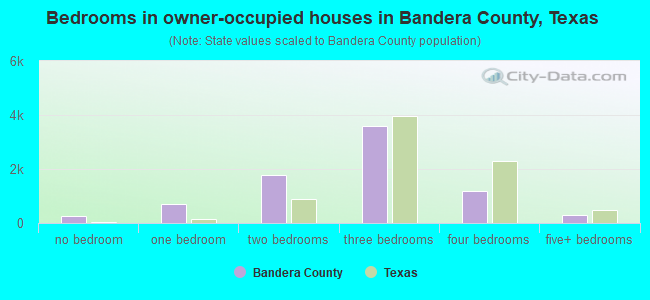
- Bedrooms in owner-occupied houses in Bandera County, Texas
- 318no bedroom
- 6361 bedroom
- 1,6782 bedrooms
- 3,5843 bedrooms
- 1,2734 bedrooms
- 4305+ bedrooms
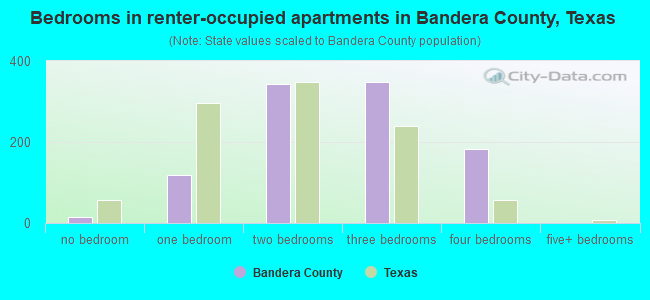
- Bedrooms in renter-occupied apartments in Bandera County, Texas
- 26no bedroom
- 1951 bedroom
- 4442 bedrooms
- 2943 bedrooms
- 1504 bedrooms
- 85+ bedrooms
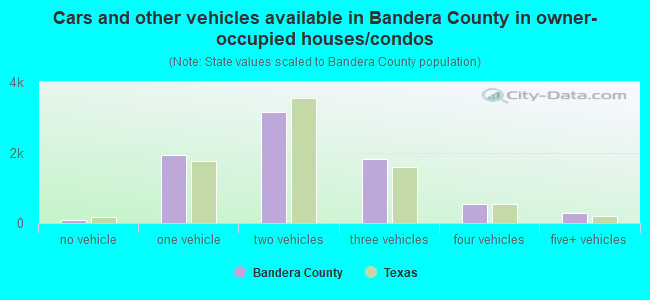
- Cars and other vehicles available in Bandera County in owner-occupied houses/condos
- 91no vehicle
- 1,9001 vehicle
- 3,1172 vehicles
- 1,8453 vehicles
- 6004 vehicles
- 3365+ vehicles
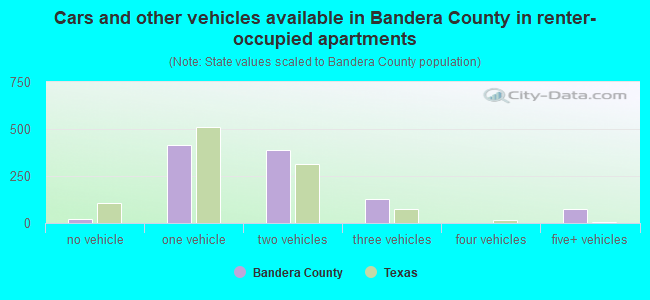
- Cars and other vehicles available in Bandera County in renter-occupied apartments
- 52no vehicle
- 5791 vehicle
- 3432 vehicles
- 1093 vehicles
- 04 vehicles
- 415+ vehicles
92.6% of Bandera County residents lived in the same house 1 years ago.
Out of people who lived in different houses, 23% lived in this county.
Out of people who lived in different counties, 83% lived in Texas.
| Bandera County: | 92.6% |
| State average: | 85.7% |
Place of birth for U.S.-born residents:
- This state: 13,039
- Other state: 6,912
- Northeast: 1,026
- Midwest: 1,904
- South: 1,947
- West: 2,041
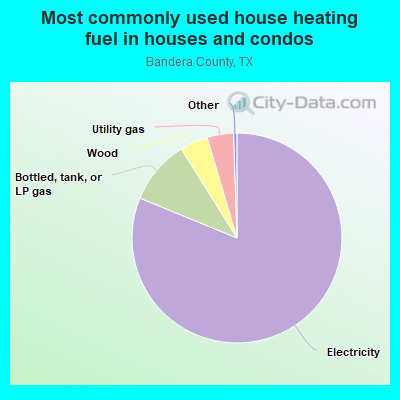
- 82.0%Electricity
- 10.4%Bottled, tank, or LP gas
- 4.4%Utility gas
- 2.9%Wood
- 0.3%Other fuel
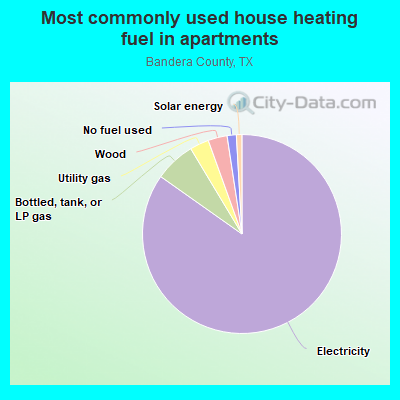
- 85.9%Electricity
- 7.9%Bottled, tank, or LP gas
- 3.6%Wood
- 1.9%Utility gas
- 0.8%Solar energy
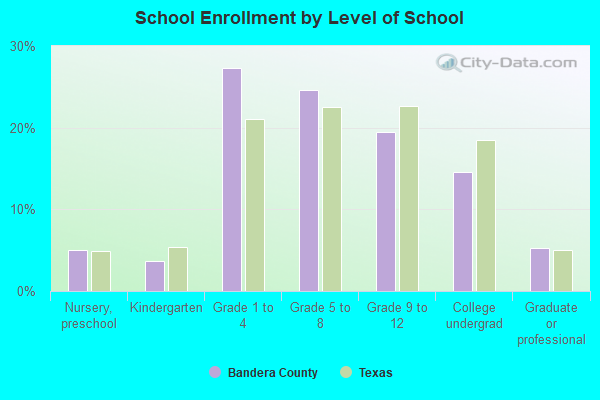
Private vs. public school enrollment:
| Here: | 20.9% |
| Texas: | 8.8% |
| Here: | 18.2% |
| Texas: | 8.0% |
| Here: | 17.6% |
| Texas: | 16.2% |
Bandera County government finances - Expenditure in 2017:
- Charges - Other: $3,058,000
Solid Waste Management: $323,000
Parks and Recreation: $32,000
- Construction - General - Other: $271,000
- Current Operations - Regular Highways: $3,214,000
Police Protection: $3,199,000
General - Other: $2,680,000
Correctional Institutions: $2,117,000
Judicial and Legal Services: $2,103,000
Health - Other: $1,615,000
Financial Administration: $1,363,000
Central Staff Services: $1,159,000
Solid Waste Management: $392,000
General Public Buildings: $322,000
Public Welfare, Vendor Payments for Medical Care: $310,000
Protective Inspection and Regulation - Other: $284,000
Libraries: $278,000
Natural Resources - Other: $163,000
Corrections - Other: $135,000
Parks and Recreation: $134,000
Sewerage: $106,000
Local Fire Protection: $79,000
- General - Interest on Debt: $476,000
- Long Term Debt - Beginning Outstanding - Unspecified Public Purpose: $9,885,000
Outstanding Unspecified Public Purpose: $9,480,000
Retired Unspecified Public Purpose: $405,000
- Miscellaneous - Fines and Forfeits: $294,000
General Revenue - Other: $136,000
Donations From Private Sources: $46,000
Interest Earnings: $18,000
- Other Capital Outlay - Police Protection: $124,000
General - Other: $58,000
Health - Other: $46,000
Sewerage: $17,000
Local Fire Protection: $3,000
Parks and Recreation: $1,000
Correctional Institutions: $1,000
- Other Funds - Cash and Securities: $7,696,000
- Sinking Funds - Cash and Securities: $151,000
- State Intergovernmental - Other: $918,000
Highways: $35,000
Health and Hospitals: $22,000
General Local Government Support: $19,000
- Tax - Property: $14,132,000
Motor Vehicle License: $735,000
General Sales and Gross Receipts: $582,000
Other Selective Sales: $453,000
Other License: $50,000
- Total Salaries and Wages: $6,265,000
Bandera County government finances - Revenue in 2017:
- Charges - Other: $3,058,000
Solid Waste Management: $323,000
Parks and Recreation: $32,000
- Construction - General - Other: $271,000
- Current Operations - Regular Highways: $3,214,000
Police Protection: $3,199,000
General - Other: $2,680,000
Correctional Institutions: $2,117,000
Judicial and Legal Services: $2,103,000
Health - Other: $1,615,000
Financial Administration: $1,363,000
Central Staff Services: $1,159,000
Solid Waste Management: $392,000
General Public Buildings: $322,000
Public Welfare, Vendor Payments for Medical Care: $310,000
Protective Inspection and Regulation - Other: $284,000
Libraries: $278,000
Natural Resources - Other: $163,000
Corrections - Other: $135,000
Parks and Recreation: $134,000
Sewerage: $106,000
Local Fire Protection: $79,000
- General - Interest on Debt: $476,000
- Long Term Debt - Beginning Outstanding - Unspecified Public Purpose: $9,885,000
Outstanding Unspecified Public Purpose: $9,480,000
Retired Unspecified Public Purpose: $405,000
- Miscellaneous - Fines and Forfeits: $294,000
General Revenue - Other: $136,000
Donations From Private Sources: $46,000
Interest Earnings: $18,000
- Other Capital Outlay - Police Protection: $124,000
General - Other: $58,000
Health - Other: $46,000
Sewerage: $17,000
Local Fire Protection: $3,000
Parks and Recreation: $1,000
Correctional Institutions: $1,000
- Other Funds - Cash and Securities: $7,696,000
- Sinking Funds - Cash and Securities: $151,000
- State Intergovernmental - Other: $918,000
Highways: $35,000
Health and Hospitals: $22,000
General Local Government Support: $19,000
- Tax - Property: $14,132,000
Motor Vehicle License: $735,000
General Sales and Gross Receipts: $582,000
Other Selective Sales: $453,000
Other License: $50,000
- Total Salaries and Wages: $6,265,000
Bandera County government finances - Debt in 2017:
- Charges - Other: $3,058,000
Solid Waste Management: $323,000
Parks and Recreation: $32,000
- Construction - General - Other: $271,000
- Current Operations - Regular Highways: $3,214,000
Police Protection: $3,199,000
General - Other: $2,680,000
Correctional Institutions: $2,117,000
Judicial and Legal Services: $2,103,000
Health - Other: $1,615,000
Financial Administration: $1,363,000
Central Staff Services: $1,159,000
Solid Waste Management: $392,000
General Public Buildings: $322,000
Public Welfare, Vendor Payments for Medical Care: $310,000
Protective Inspection and Regulation - Other: $284,000
Libraries: $278,000
Natural Resources - Other: $163,000
Corrections - Other: $135,000
Parks and Recreation: $134,000
Sewerage: $106,000
Local Fire Protection: $79,000
- General - Interest on Debt: $476,000
- Long Term Debt - Beginning Outstanding - Unspecified Public Purpose: $9,885,000
Outstanding Unspecified Public Purpose: $9,480,000
Retired Unspecified Public Purpose: $405,000
- Miscellaneous - Fines and Forfeits: $294,000
General Revenue - Other: $136,000
Donations From Private Sources: $46,000
Interest Earnings: $18,000
- Other Capital Outlay - Police Protection: $124,000
General - Other: $58,000
Health - Other: $46,000
Sewerage: $17,000
Local Fire Protection: $3,000
Parks and Recreation: $1,000
Correctional Institutions: $1,000
- Other Funds - Cash and Securities: $7,696,000
- Sinking Funds - Cash and Securities: $151,000
- State Intergovernmental - Other: $918,000
Highways: $35,000
Health and Hospitals: $22,000
General Local Government Support: $19,000
- Tax - Property: $14,132,000
Motor Vehicle License: $735,000
General Sales and Gross Receipts: $582,000
Other Selective Sales: $453,000
Other License: $50,000
- Total Salaries and Wages: $6,265,000
Bandera County government finances - Cash and Securities in 2017:
- Charges - Other: $3,058,000
Solid Waste Management: $323,000
Parks and Recreation: $32,000
- Construction - General - Other: $271,000
- Current Operations - Regular Highways: $3,214,000
Police Protection: $3,199,000
General - Other: $2,680,000
Correctional Institutions: $2,117,000
Judicial and Legal Services: $2,103,000
Health - Other: $1,615,000
Financial Administration: $1,363,000
Central Staff Services: $1,159,000
Solid Waste Management: $392,000
General Public Buildings: $322,000
Public Welfare, Vendor Payments for Medical Care: $310,000
Protective Inspection and Regulation - Other: $284,000
Libraries: $278,000
Natural Resources - Other: $163,000
Corrections - Other: $135,000
Parks and Recreation: $134,000
Sewerage: $106,000
Local Fire Protection: $79,000
- General - Interest on Debt: $476,000
- Long Term Debt - Beginning Outstanding - Unspecified Public Purpose: $9,885,000
Outstanding Unspecified Public Purpose: $9,480,000
Retired Unspecified Public Purpose: $405,000
- Miscellaneous - Fines and Forfeits: $294,000
General Revenue - Other: $136,000
Donations From Private Sources: $46,000
Interest Earnings: $18,000
- Other Capital Outlay - Police Protection: $124,000
General - Other: $58,000
Health - Other: $46,000
Sewerage: $17,000
Local Fire Protection: $3,000
Parks and Recreation: $1,000
Correctional Institutions: $1,000
- Other Funds - Cash and Securities: $7,696,000
- Sinking Funds - Cash and Securities: $151,000
- State Intergovernmental - Other: $918,000
Highways: $35,000
Health and Hospitals: $22,000
General Local Government Support: $19,000
- Tax - Property: $14,132,000
Motor Vehicle License: $735,000
General Sales and Gross Receipts: $582,000
Other Selective Sales: $453,000
Other License: $50,000
- Total Salaries and Wages: $6,265,000
Supplemental Security Income (SSI) in 2006:
- Total number of recipients: 321
- Number of aged recipients: 36
- Number of blind and disabled recipients: 285
- Number of recipients under 18: 40
- Number of recipients between 18 and 64: 233
- Number of recipients older than 64: 48
- Number of recipients also receiving OASDI: 126
- Amount of payments (thousands of dollars): 136
| Most common first names in Bandera County, TX among deceased individuals | ||
| Name | Count | Lived (average) |
|---|---|---|
| William | 87 | 74.8 years |
| John | 80 | 75.1 years |
| Charles | 57 | 72.9 years |
| James | 55 | 69.0 years |
| Mary | 53 | 77.9 years |
| Robert | 50 | 69.4 years |
| Thomas | 35 | 69.7 years |
| Jack | 28 | 70.9 years |
| George | 28 | 77.3 years |
| Richard | 28 | 68.4 years |
| Most common last names in Bandera County, TX among deceased individuals | ||
| Last name | Count | Lived (average) |
|---|---|---|
| Smith | 32 | 75.9 years |
| Stevens | 25 | 77.4 years |
| Heinen | 21 | 75.4 years |
| Jones | 19 | 67.1 years |
| Clark | 18 | 73.9 years |
| Williams | 18 | 73.8 years |
| Davis | 17 | 74.9 years |
| Mazurek | 15 | 81.4 years |
| Johnson | 14 | 76.0 years |
| Kalka | 14 | 80.1 years |
| Businesses in Bandera County, TX | ||||
| Name | Count | Name | Count | |
|---|---|---|---|---|
| Church's Chicken | 1 | H&R Block | 1 | |
| Cricket Wireless | 1 | SONIC Drive-In | 1 | |
| Curves | 1 | True Value | 1 | |
| Dairy Queen | 1 | U-Haul | 2 | |
| FedEx | 2 | UPS | 2 | |