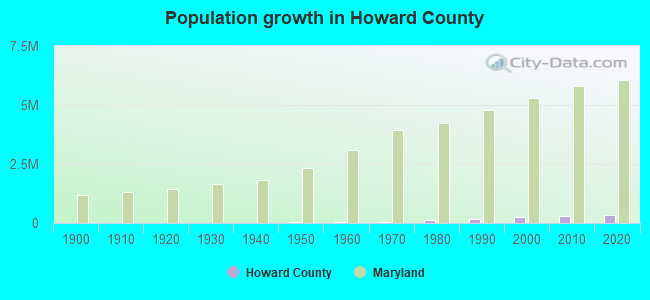
Howard County, Maryland (MD)
County owner-occupied free and clear houses and condos in 2010: 13,018
County owner-occupied houses and condos in 2000: 66,414
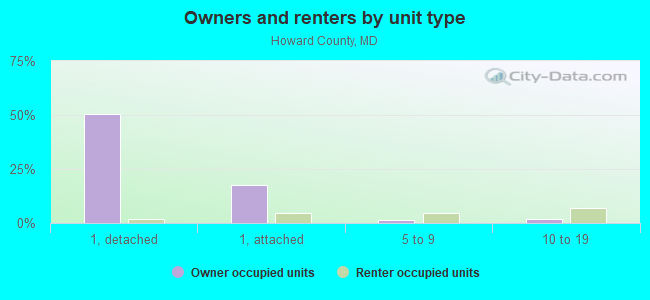
Renter-occupied apartments: 27,556 (it was 23,629 in 2000)
| % of renters here: | 26% |
| State: | 32% |
Land area: 252 sq. mi.
Water area: 1.5 sq. mi.
Population density: 1331 people per square mile (very high).
Industries providing employment: Educational, health and social services (25.8%), Professional, scientific, management, administrative, and waste management services (22.1%), Public administration (11.6%).
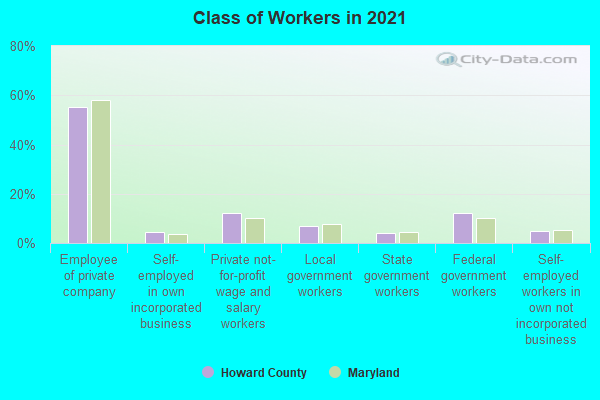
Type of workers:
- Private wage or salary: 70%
- Government: 25%
- Self-employed, not incorporated: 5%
- Unpaid family work: 0%
- OSM Map
- General Map
- Google Map
- MSN Map

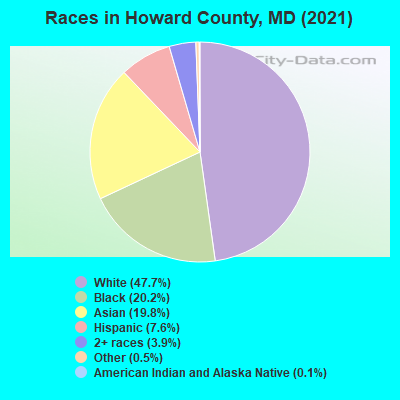
- 156,13246.5%White Non-Hispanic Alone
- 66,97520.0%Black Non-Hispanic Alone
- 65,13719.4%Asian alone
- 26,4987.9%Hispanic or Latino
- 16,9955.1%Two or more races
- 3,3511.0%Some other race alone
- 2530.08%Native Hawaiian and Other
Pacific Islander alone - 700.02%American Indian and Alaska Native alone
| Median resident age: | 39.8 years |
| Maryland median age: | 39.7 years |
| Males: 166,139 | |
| Females: 169,272 |


| Howard County: | 2.0 people |
| Maryland: | 3 people |
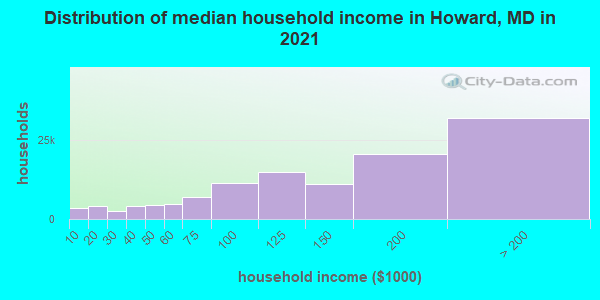
Estimated median household income in 2022: $133,438 ($74,167 in 1999)
| This county: | $133,438 |
| Maryland: | $94,991 |
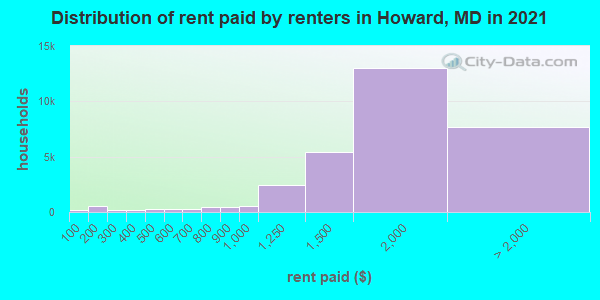
Median contract rent in 2022 for apartments: $1,797 (lower quartile is $1,512, upper quartile is $2,186)
| This county: | $1797 |
| State: | $1388 |
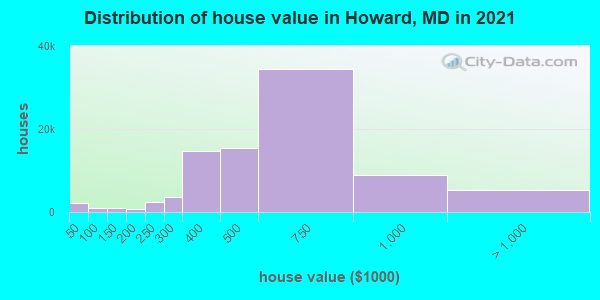
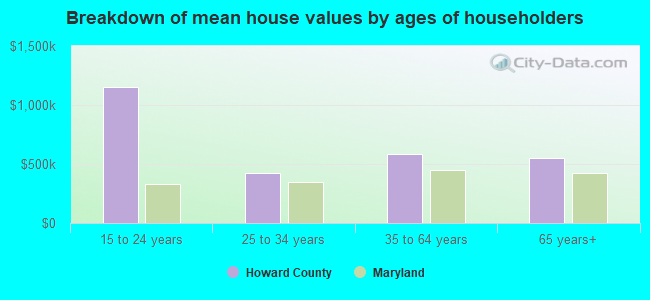
Estimated median house or condo value in 2022: $580,600 (it was $198,600 in 2000)
| Howard: | $580,600 |
| Maryland: | $398,100 |
Mean price in 2022:
Median monthly housing costs for homes and condos with a mortgage: $2,738Detached houses: $717,893
Here: $717,893 State: $526,819 Townhouses or other attached units: $426,492
Here: $426,492 State: $328,305 In 2-unit structures: $353,320
Here: $353,320 State: $346,599 In 3-to-4-unit structures: $417,899
Here: $417,899 State: $295,378 In 5-or-more-unit structures: $417,841
Here: $417,841 State: $350,378 Mobile homes: $48,469
Here: $48,469 State: $89,353
Median monthly housing costs for units without a mortgage: $953
Institutionalized population: 1,818
Crime in 2020 (reported by the sheriff's office or county police, not the county total):
- Murders: 0
- Rapes: 0
- Robberies: 0
- Assaults: 0
- Burglaries: 0
- Thefts: 0
- Auto thefts: 0
Crime in 2019 (reported by the sheriff's office or county police, not the county total):
- Murders: 0
- Rapes: 0
- Robberies: 0
- Assaults: 0
- Burglaries: 0
- Thefts: 1
- Auto thefts: 0
Health of residents in Howard County based on CDC Behavioral Risk Factor Surveillance System Survey Questionnaires from 2013 to 2021:
General health status score of residents in this county from 1 (poor) to 5 (excellent) is 3.5. This is about average.73.7% of residents exercised in the past month. This is about average.
41.4% of residents smoked 100+ cigarettes in their lives. This is about average.
56.5% of adult residents drank alcohol in the past 30 days. This is less than average.
72.1% of residents visited a dentist within the past year. This is about average.
Average weight of males is 198 pounds. This is about average.
Average weight of females is 166 pounds. This is about average.
Health of residents in Howard County based on CDC Behavioral Risk Factor Surveillance System Survey Questionnaires from 2003 to 2012:
General health status score of residents in this county from 1 (poor) to 5 (excellent) is 3.8. This is significantly better than average.84.5% of residents exercised in the past month. This is more than average.
35.7% of residents smoked 100+ cigarettes in their lives. This is less than average.
98.8% of adult residents drank alcohol in the past 30 days. This is more than average.
83.0% of residents visited a dentist within the past year. This is more than average.
Average weight of males is 194 pounds. This is about average.
Average weight of females is 154 pounds. This is less than average.
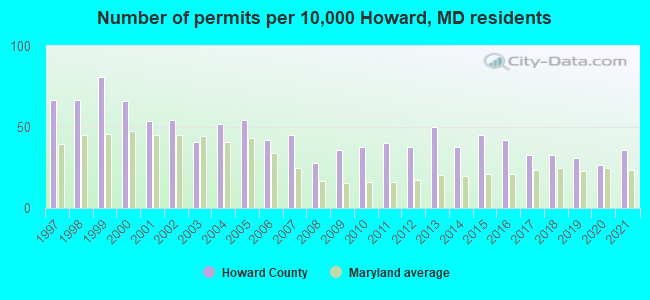
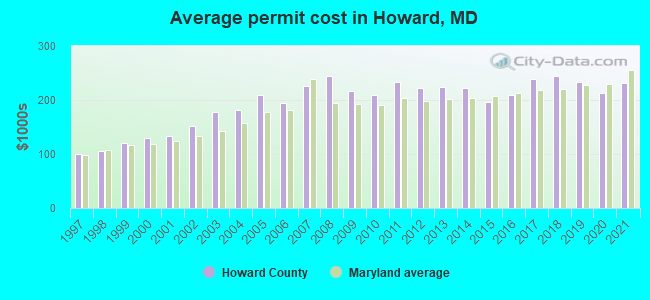
Single-family new house construction building permits:
- 2022: 459 buildings, average cost: $287,000
- 2021: 882 buildings, average cost: $230,900
- 2020: 651 buildings, average cost: $212,900
- 2019: 761 buildings, average cost: $234,200
- 2018: 808 buildings, average cost: $244,500
- 2017: 817 buildings, average cost: $239,000
- 2016: 1039 buildings, average cost: $210,100
- 2015: 1113 buildings, average cost: $197,200
- 2014: 931 buildings, average cost: $222,600
- 2013: 1235 buildings, average cost: $223,500
- 2012: 938 buildings, average cost: $222,200
- 2011: 991 buildings, average cost: $234,200
- 2010: 936 buildings, average cost: $209,400
- 2009: 890 buildings, average cost: $216,700
- 2008: 681 buildings, average cost: $243,800
- 2007: 1113 buildings, average cost: $224,700
- 2006: 1040 buildings, average cost: $193,600
- 2005: 1340 buildings, average cost: $209,000
- 2004: 1284 buildings, average cost: $180,600
- 2003: 1010 buildings, average cost: $176,800
- 2002: 1341 buildings, average cost: $150,600
- 2001: 1327 buildings, average cost: $134,000
- 2000: 1631 buildings, average cost: $130,200
- 1999: 2003 buildings, average cost: $119,600
- 1998: 1648 buildings, average cost: $104,900
- 1997: 1658 buildings, average cost: $99,900
Median real estate property taxes paid for housing units with mortgages in 2022: $6,449 (1.1%)
Median real estate property taxes paid for housing units with no mortgage in 2022: $6,610 (1.2%)
| Howard County: | 5.3% |
| Maryland: | 9.6% |
Median age of residents in 2022: 39.8 years old
(Males: 38.1 years old, Females: 41.2 years old)
(Median age for: White residents: 45.0 years old, Black residents: 36.3 years old, American Indian residents: 29.9 years old, Asian residents: 41.1 years old, Hispanic or Latino residents: 29.4 years old, Other race residents: 30.8 years old)
Area name: Baltimore-Towson, MD HUD Metro FMR Area
Fair market rent in 2006 for a 1-bedroom apartment in Howard County is $791 a month.
Fair market rent for a 2-bedroom apartment is $950 a month.
Fair market rent for a 3-bedroom apartment is $1220 a month.
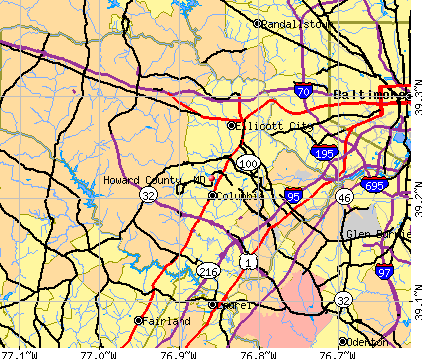
Cities in this county include: Columbia, Ellicott City, Scaggsville, Ilchester, Elkridge, North Laurel, Savage-Guilford, Savage, Fulton, Highland.
2023 air pollution in Howard County:
Carbon Monoxide: 0.247 ppm (standard limit: 9 ppm). Near U.S. average.
Nitrogen Dioxide: 0.02 ppm (standard limit: 0.053 ppm). Significanly above U.S. average.
Particulate Matter (PM2.5) Annual: 9.1 µg/m3(standard limit: 15.0 µg/m3). Near U.S. average.
Neighboring counties: Brown County, Illinois  , Lincoln County, Nevada , Mesa County, Colorado , Jefferson County, Missouri , Lincoln County, Kansas , Ross County, Ohio , Sullivan County, Indiana .
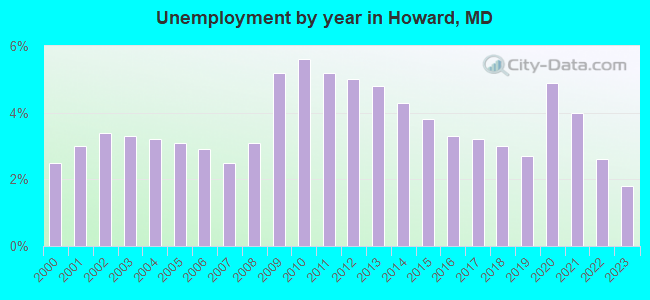
| Here: | 1.6% |
| Maryland: | 2.0% |
Current college students: 16,025
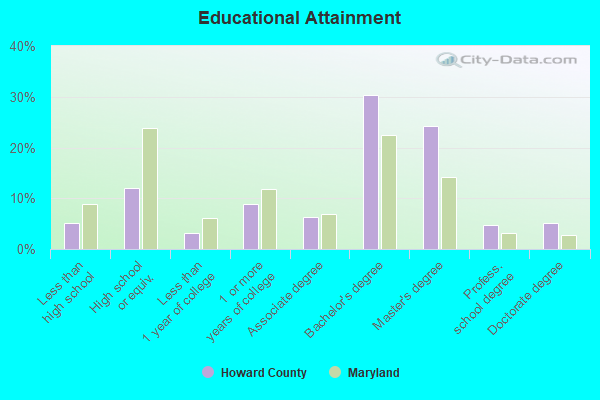
People 25 years of age or older with a high school degree or higher: 95.6%
People 25 years of age or older with a bachelor's degree or higher: 65.2%
Number of foreign born residents: 76,706 (63.7% naturalized citizens)
| Howard County: | 22.9% |
| Whole state: | 16.7% |
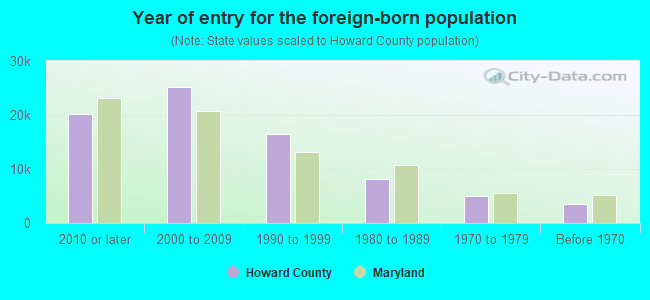
- Year of entry for the foreign-born population
- 22,7382010 or later
- 21,2302000 to 2009
- 14,2011990 to 1999
- 8,1721980 to 1989
- 5,0151970 to 1979
- 3,554Before 1970
Mean travel time to work (commute): minutes
Percentage of county residents living and working in this county: 95.1%
Housing units in structures:
- One, detached: 64,065
- One, attached: 25,975
- Two: 842
- 3 or 4: 2,041
- 5 to 9: 7,337
- 10 to 19: 14,219
- 20 to 49: 3,271
- 50 or more: 7,181
- Mobile homes: 887
Housing units in Howard County with a mortgage: 62,637 (7,107 second mortgage, 108 home equity loan, 6,389 both second mortgage and home equity loan)
Houses without a mortgage: 1,337
| Here: | 98.4% with mortgage |
| State: | 97.5% with mortgage |
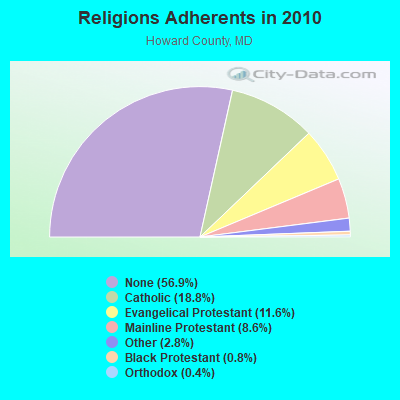
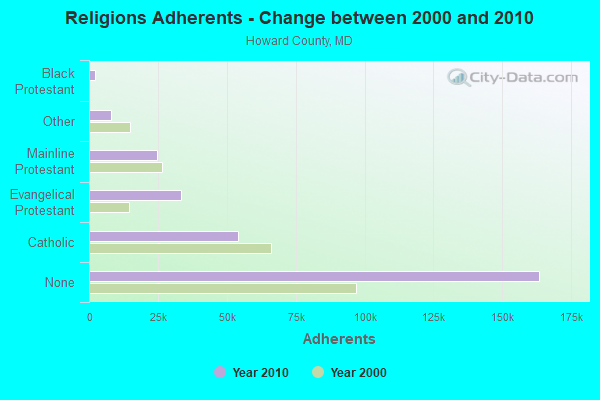
Religion statistics for Howard County
| Religion | Adherents | Congregations |
|---|---|---|
| Catholic | 54,058 | 8 |
| Evangelical Protestant | 33,403 | 98 |
| Mainline Protestant | 24,571 | 58 |
| Other | 8,163 | 23 |
| Black Protestant | 2,332 | 11 |
| Orthodox | 1,065 | 3 |
| None | 163,493 | - |
Source: Clifford Grammich, Kirk Hadaway, Richard Houseal, Dale E.Jones, Alexei Krindatch, Richie Stanley and Richard H.Taylor. 2012. 2010 U.S.Religion Census: Religious Congregations & Membership Study. Association of Statisticians of American Religious Bodies. Jones, Dale E., et al. 2002. Congregations and Membership in the United States 2000. Nashville, TN: Glenmary Research Center.
Food Environment Statistics:
| Howard County: | 1.54 / 10,000 pop. |
| State: | 1.96 / 10,000 pop. |
| Here: | 0.07 / 10,000 pop. |
| Maryland: | 0.07 / 10,000 pop. |
| This county: | 0.70 / 10,000 pop. |
| Maryland: | 1.22 / 10,000 pop. |
| Howard County: | 1.91 / 10,000 pop. |
| Maryland: | 2.05 / 10,000 pop. |
| This county: | 5.50 / 10,000 pop. |
| State: | 5.40 / 10,000 pop. |
| Howard County: | 7.5% |
| Maryland: | 9.1% |
| Howard County: | 23.9% |
| State: | 26.7% |
| Here: | 16.4% |
| State: | 15.5% |
Agriculture in Howard County:
Average size of farms: 109 acresAverage value of agricultural products sold per farm: $62,603
Average value of crops sold per acre for harvested cropland: $796.31
The value of nursery, greenhouse, floriculture, and sod as a percentage of the total market value of agricultural products sold: 53.26%
The value of livestock, poultry, and their products as a percentage of the total market value of agricultural products sold: 24.19%
Average total farm production expenses per farm: $64,315
Harvested cropland as a percentage of land in farms: 54.87%
Average market value of all machinery and equipment per farm: $62,954
The percentage of farms operated by a family or individual: 84.39%
Average age of principal farm operators: 56 years
Average number of cattle and calves per 100 acres of all land in farms: 11.35
Milk cows as a percentage of all cattle and calves: 21.03%
Corn for grain: 7162 harvested acres
All wheat for grain: 1942 harvested acres
Soybeans for beans: 4234 harvested acres
Vegetables: 131 harvested acres
Land in orchards: 122 acres
Earthquake activity:
Howard County-area historical earthquake activity is significantly above Maryland state average. It is 58% smaller than the overall U.S. average.On 8/23/2011 at 17:51:04, a magnitude 5.8 (5.8 MW, Depth: 3.7 mi, Class: Moderate, Intensity: VI - VII) earthquake occurred 107.7 miles away from Howard County center
On 1/16/1994 at 01:49:16, a magnitude 4.6 (4.6 MB, 4.6 LG, Depth: 3.1 mi, Class: Light, Intensity: IV - V) earthquake occurred 88.4 miles away from the county center
On 9/25/1998 at 19:52:52, a magnitude 5.2 (4.8 MB, 4.3 MS, 5.2 LG, 4.5 MW, Depth: 3.1 mi) earthquake occurred 243.7 miles away from the county center
On 8/25/2011 at 05:07:52, a magnitude 4.5 (4.5 ML, Depth: 4.2 mi) earthquake occurred 106.4 miles away from the county center
On 12/9/2003 at 20:59:18, a magnitude 4.5 (4.5 ML, Depth: 6.2 mi) earthquake occurred 120.4 miles away from Howard County center
On 12/9/2003 at 20:59:14, a magnitude 4.5 (4.5 MB, 4.5 LG) earthquake occurred 126.3 miles away from the county center
Magnitude types: regional Lg-wave magnitude (LG), body-wave magnitude (MB), local magnitude (ML), surface-wave magnitude (MS), moment magnitude (MW)
Most recent natural disasters:
- Maryland Covid-19 Pandemic, Incident Period: January 20, 2020, Major Disaster (Presidential) Declared DR-4491-MD: March 26, 2020, FEMA Id: 4491, Natural disaster type: Other
- Maryland Severe Storm And Flooding, Incident Period: May 27, 2018 - May 28, 2018, FEMA Id: 4376, Natural disaster type: Storm, Flood
- Maryland Severe Storm and Flooding, Incident Period: July 30, 2016 to July 31, 2016, Major Disaster (Presidential) Declared DR-4279: September 16, 2016, FEMA Id: 4279, Natural disaster type: Storm, Flood
- Maryland Severe Winter Storm and Snowstorm, Incident Period: January 22, 2016 to January 23, 2016, Major Disaster (Presidential) Declared DR-4261: March 04, 2016, FEMA Id: 4261, Natural disaster type: Snowstorm, Winter Storm
- Maryland Snow Storm, Incident Period: February 12, 2014 to February 13, 2014, Major Disaster (Presidential) Declared DR-4170: April 10, 2014, FEMA Id: 4170, Natural disaster type: Storm, Snow
- Maryland Hurricane Sandy, Incident Period: October 26, 2012 to November 08, 2012, Emergency Declared EM-3349: October 28, 2012, FEMA Id: 3349, Natural disaster type: Hurricane
- Maryland Hurricane Sandy, Incident Period: October 26, 2012 to November 04, 2012, Major Disaster (Presidential) Declared DR-4091: November 20, 2012, FEMA Id: 4091, Natural disaster type: Hurricane
- Maryland Remnants of Tropical Storm Lee, Incident Period: September 06, 2011 to September 09, 2011, Major Disaster (Presidential) Declared DR-4038: October 05, 2011, FEMA Id: 4038, Natural disaster type: Tropical Storm
- Maryland Hurricane Irene, Incident Period: August 26, 2011 to September 05, 2011, Emergency Declared EM-3335: August 27, 2011, FEMA Id: 3335, Natural disaster type: Hurricane
- Maryland Severe Winter Storms and Snowstorms, Incident Period: February 05, 2010 to February 11, 2010, Major Disaster (Presidential) Declared DR-1910: May 06, 2010, FEMA Id: 1910, Natural disaster type: Snowstorm, Winter Storm
- 10 other natural disasters have been reported since 1953.
The number of natural disasters in Howard County (20) is greater than the US average (15).
Major Disasters (Presidential) Declared: 14
Emergencies Declared: 5
Causes of natural disasters: Hurricanes: 5, Winter Storms: 5, Floods: 4, Snowstorms: 4, Storms: 4, Tropical Storms: 2, Blizzard: 1, Heavy Rain: 1, Snow: 1, Snowfall: 1, Other: 1 (Note: some incidents may be assigned to more than one category).
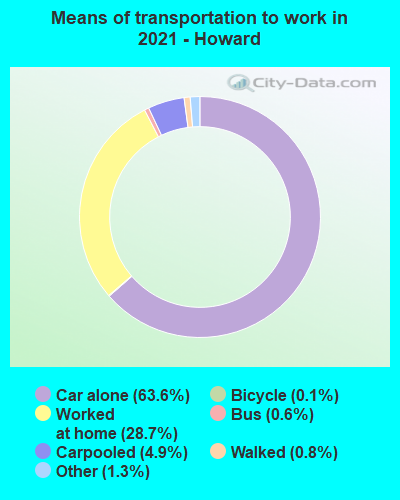
Means of transportation to work:
- Drove a car alone: 117,981 (65.5%)
- Carpooled: 13,416 (7.4%)
- Bus: 361 (0.2%)
- Long-distance train or commuter rail: 81 (0.0%)
- Ferryboat: 54 (0.0%)
- Taxicab, motorcycle, or other means: 2,136 (1.2%)
- Bicycle: 214 (0.1%)
- Walked: 1,381 (0.8%)
- Worked at home: 44,504 (24.7%)
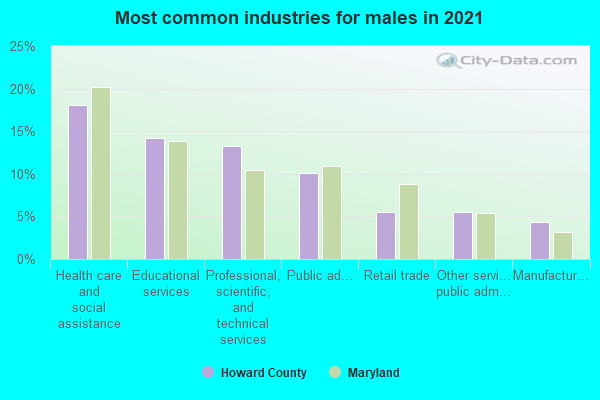
- Health care and social assistance (20%)
- Educational services (16%)
- Professional, scientific, and technical services (13%)
- Public administration (8%)
- Finance and insurance (6%)
- Retail trade (5%)
- Other services, except public administration (5%)
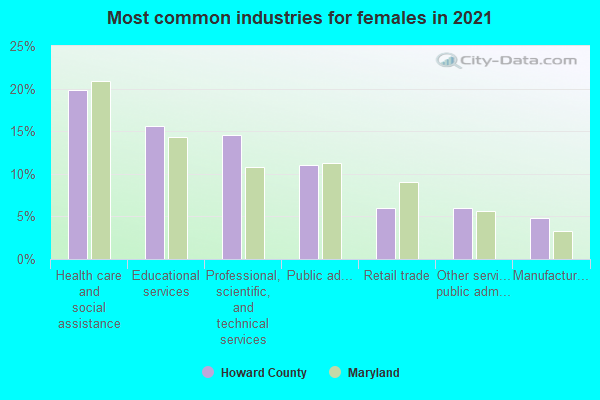
- Health care and social assistance (22%)
- Educational services (17%)
- Professional, scientific, and technical services (14%)
- Public administration (9%)
- Finance and insurance (6%)
- Retail trade (6%)
- Other services, except public administration (5%)
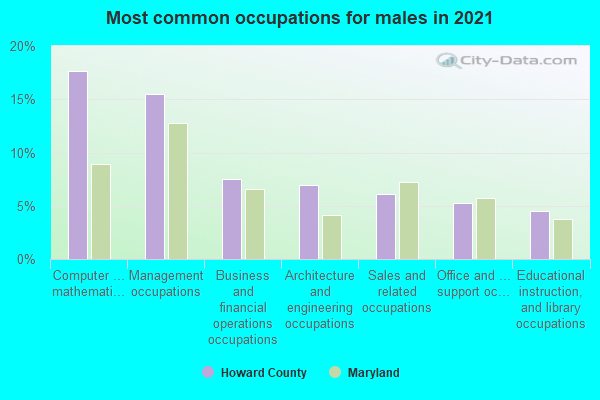
- Computer and mathematical occupations (16%)
- Management occupations (16%)
- Business and financial operations occupations (8%)
- Architecture and engineering occupations (7%)
- Sales and related occupations (7%)
- Office and administrative support occupations (6%)
- Health diagnosing and treating practitioners and other technical occupations (4%)
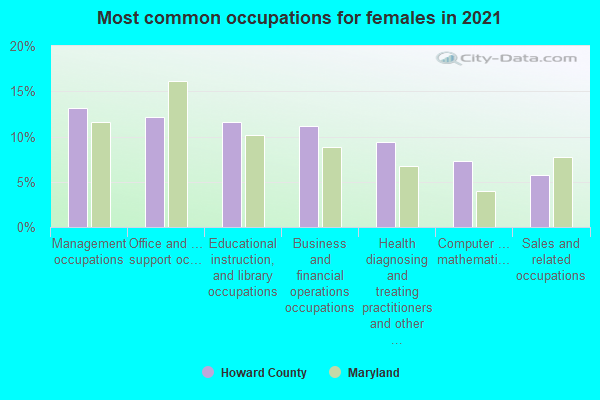
- Educational instruction, and library occupations (13%)
- Management occupations (12%)
- Business and financial operations occupations (10%)
- Health diagnosing and treating practitioners and other technical occupations (10%)
- Office and administrative support occupations (10%)
- Sales and related occupations (7%)
- Computer and mathematical occupations (7%)
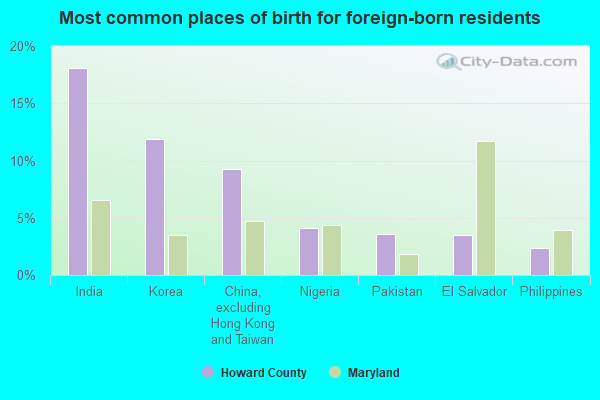
- India (18%)
- Korea (12%)
- China, excluding Hong Kong and Taiwan (9%)
- Nigeria (5%)
- El Salvador (4%)
- Honduras (3%)
- Philippines (2%)
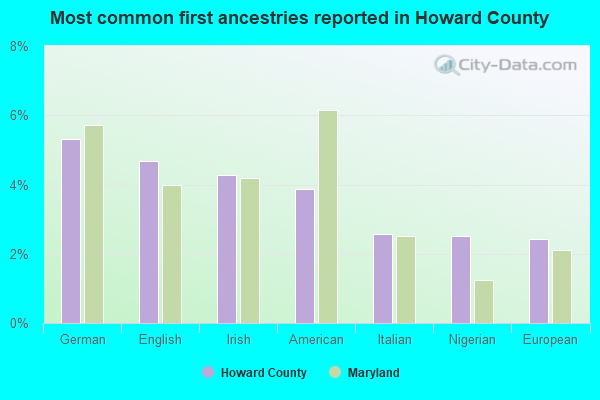
- German (5%)
- English (5%)
- Irish (5%)
- American (4%)
- Nigerian (3%)
- Italian (2%)
- European (2%)
People in group quarters in Howard County, Maryland in 2010:
- 817 people in state prisons
- 454 people in nursing facilities/skilled-nursing facilities
- 245 people in local jails and other municipal confinement facilities
- 212 people in mental (psychiatric) hospitals and psychiatric units in other hospitals
- 201 people in group homes intended for adults
- 148 people in workers' group living quarters and job corps centers
- 82 people in emergency and transitional shelters (with sleeping facilities) for people experiencing homelessness
- 58 people in other noninstitutional facilities
- 52 people in hospitals with patients who have no usual home elsewhere
- 26 people in group homes for juveniles (non-correctional)
- 15 people in residential treatment centers for adults
- 10 people in residential schools for people with disabilities
- 2 people in correctional residential facilities
People in group quarters in Howard County, Maryland in 2000:
- 1,185 people in other noninstitutional group quarters
- 879 people in state prisons
- 448 people in nursing homes
- 306 people in mental (psychiatric) hospitals or wards
- 218 people in local jails and other confinement facilities (including police lockups)
- 216 people in other group homes
- 183 people in homes for the physically handicapped
- 108 people in homes for the mentally retarded
- 30 people in religious group quarters
- 13 people in hospitals/wards and hospices for chronically ill
- 13 people in hospices or homes for chronically ill
- 12 people in wards in general hospitals for patients who have no usual home elsewhere
- 11 people in homes for the mentally ill
- 5 people in agriculture workers' dormitories on farms
- 4 people in other nonhousehold living situations
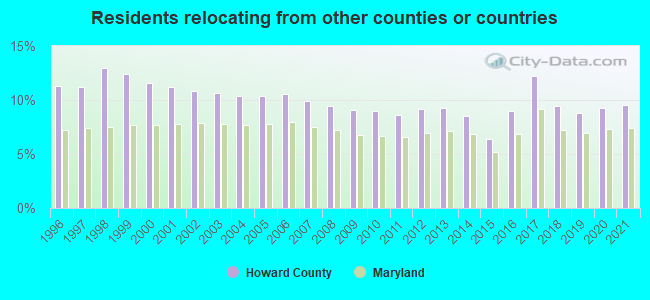
9.51% of this county's 2021 resident taxpayers lived in other counties in 2020 ($84,372 average adjusted gross income)
| Here: | 9.51% |
| Maryland average: | 7.42% |
0.07% of residents moved from foreign countries ($746 average AGI)
Howard County: 0.07% Maryland average: 0.05%
5.94% relocated from other counties in Maryland ($50,822 average AGI)
3.49% relocated from other states ($32,804 average AGI)
Howard County: 3.49% Maryland average: 3.41%
Top counties from which taxpayers relocated into this county between 2020 and 2021:
| from Prince George's County, MD | |
| from Baltimore County, MD | |
| from Anne Arundel County, MD | |
| from Montgomery County, MD | |
| from Baltimore city, MD | |
| from Carroll County, MD | |
| from District of Columbia, DC |
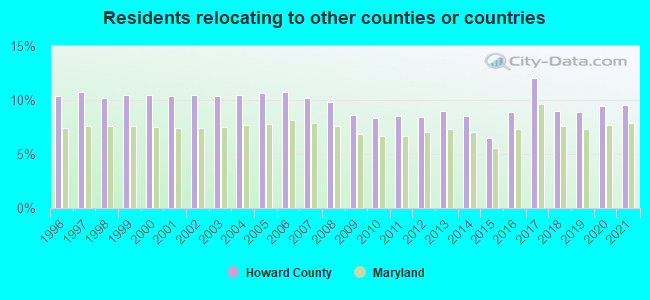
9.56% of this county's 2020 resident taxpayers moved to other counties in 2021 ($97,685 average adjusted gross income)
| Here: | 9.56% |
| Maryland average: | 7.91% |
0.05% of residents moved to foreign countries ($625 average AGI)
Howard County: 0.05% Maryland average: 0.04%
5.70% relocated to other counties in Maryland ($50,053 average AGI)
3.81% relocated to other states ($47,007 average AGI)
Howard County: 3.81% Maryland average: 3.93%
Top counties to which taxpayers relocated from this county between 2020 and 2021:
| to Anne Arundel County, MD | |
| to Baltimore County, MD | |
| to Montgomery County, MD | |
| to Prince George's County, MD | |
| to Baltimore city, MD | |
| to Carroll County, MD | |
| to Frederick County, MD |
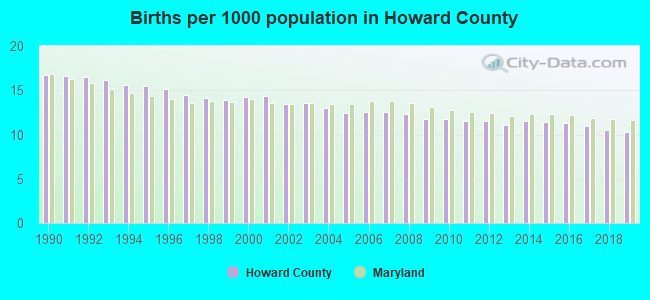
Births per 1000 population from 1990 to 1999: 15.5
Births per 1000 population from 2000 to 2009: 13.0
Births per 1000 population from 2010 to 2022: 9.4
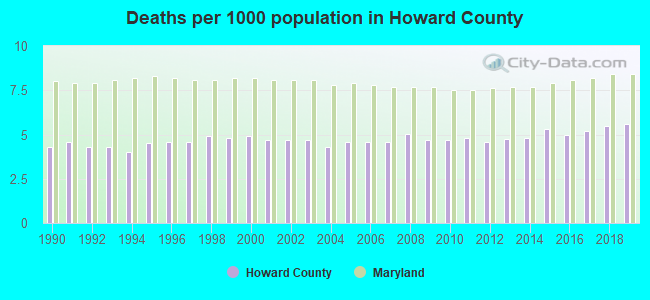
Deaths per 1000 population from 1990 to 1999: 4.5
Deaths per 1000 population from 2000 to 2009: 4.7
Deaths per 1000 population from 2010 to 2020: 5.1
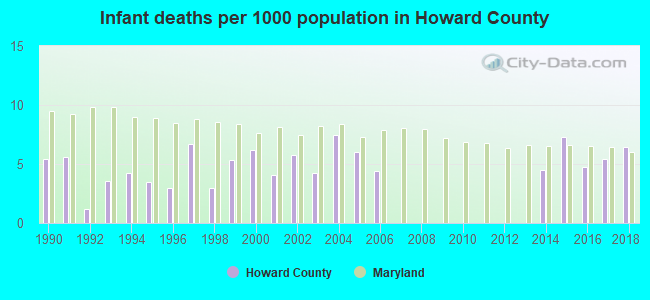
Infant deaths per 1000 live births from 1990 to 1999: 4.1
Infant deaths per 1000 live births from 2000 to 2009: 3.8
Infant deaths per 1000 live births from 2010 to 2021: 3.4
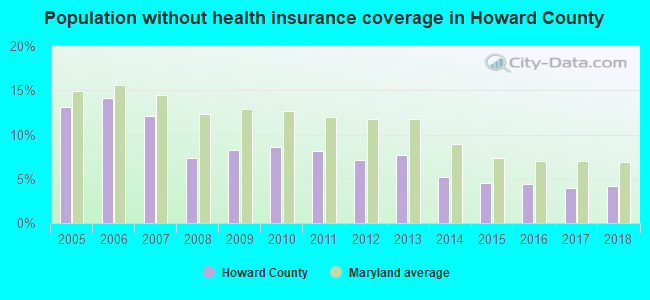
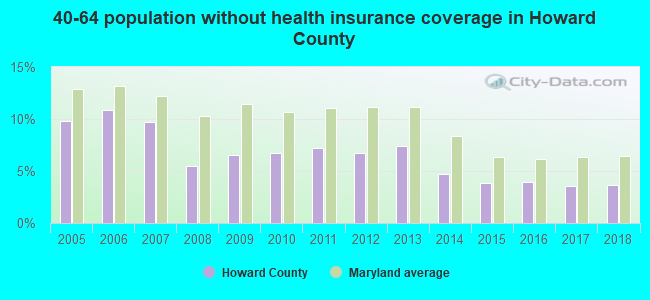
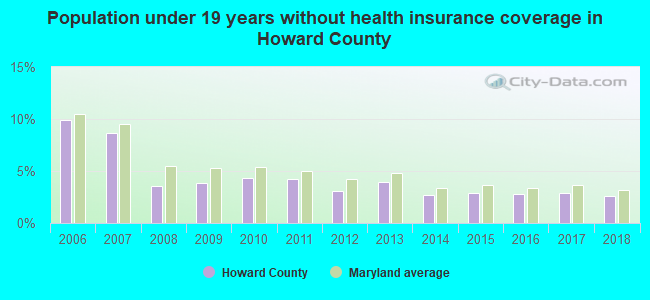
Persons under 19 years old without health insurance coverage in 2018: 2.6%

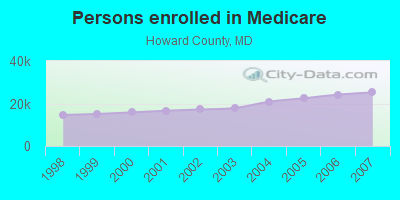
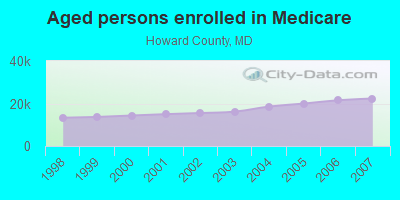
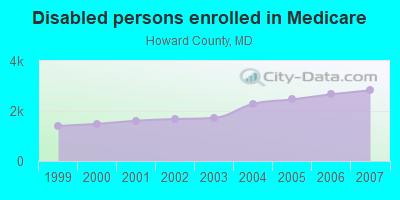
Persons enrolled in hospital insurance and/or supplemental medical insurance (Medicare) in July 1, 2007: 25,182 (22,351 aged, 2,831 disabled)
Children under 18 without health insurance coverage in 2007: 5,112 (7%)
Most common underlying causes of death in Howard County, Maryland in 1999 - 2019:
- Unspecified dementia (1,772)
- Bronchus or lung, unspecified - Malignant neoplasms (1,559)
- Atherosclerotic heart disease (1,409)
- Atherosclerotic cardiovascular disease, so described (1,367)
- Acute myocardial infarction, unspecified (1,287)
- Alzheimer disease, unspecified (824)
- Stroke, not specified as haemorrhage or infarction (774)
- Chronic obstructive pulmonary disease, unspecified (772)
- Breast, unspecified - Malignant neoplasms (610)
- Pneumonia, unspecified (610)
Population without health insurance coverage in 2000: 11%
Children under 18 without health insurance coverage in 2000: 11%
Short term general hospital admissions per 100,000 population in 2004: 5,283
Short term general hospital beds per 100,000 population in 2004: 76
Emergency room visits per 100,000 population in 2004: 26,306
General practice office based MDs per 100,000 population in 2005: 1,248
Medical specialist MDs per 100,000 population in 2005: 462
Dentists per 100,000 population in 1998: 16
Total births per 100,000 population, July 2005 - July 2006 : 60
Total deaths per 100,000 population, July 2005 - July 2006: 92
Limited-service eating places per 100,000 population in 2005 : 21
Beer, wine & liquor stores per 100,000 population in 2005: 1
Homicides per 1,000,000 population from 2000 to 2006: 27.3. This is less than state average.
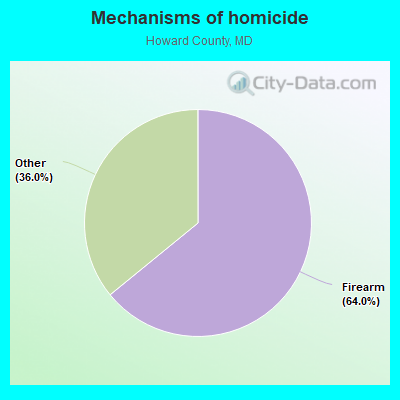
- Firearm - 17.5
- Other - 9.8
Suicides per 1,000,000 population from 2000 to 2006: 66.2. This is less than state average.
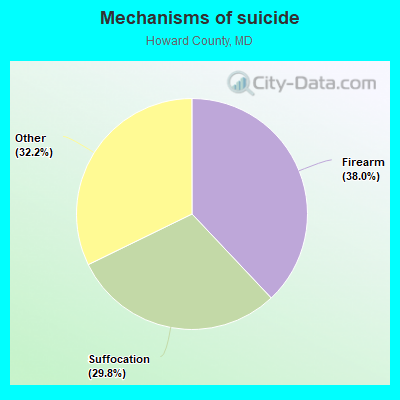
- Firearm - 25.1
- Suffocation - 19.7
- Other - 21.3
Household type by relationship:
Households: 335,411- Male householders: 62,716 (8,978 living alone), Female householders: 58,707 (16,783 living alone)
70,934 spouses (70,369 opposite-sex spouses), 7,976 unmarried partners, (7,669 opposite-sex unmarried partners), 103,965 children (99,562 natural, 2,653 adopted, 1,750 stepchildren), 5,641 grandchildren, 2,454 brothers or sisters, 7,487 parents, 0 foster children, 5,538 other relatives, 7,276 non-relatives
- In group quarters: 2,717
Size of family households: 34,452 2-persons, 20,971 3-persons, 21,127 4-persons, 6,846 5-persons, 2,720 6-persons, 1,486 7-or-more-persons.
Size of nonfamily households: 25,761 1-person, 7,107 2-persons, 697 3-persons, 136 4-persons, 120 5-persons.
57,549 married couples with children.
14,968 single-parent households (4,729 men, 10,239 women).
72.2% of residents of Howard speak English at home.
5.8% of residents speak Spanish at home (69% speak English very well, 14% speak English well, 12% speak English not well, 5% don't speak English at all).
7.6% of residents speak other Indo-European language at home (76% speak English very well, 16% speak English well, 6% speak English not well, 2% don't speak English at all).
10.4% of residents speak Asian or Pacific Island language at home (63% speak English very well, 18% speak English well, 18% speak English not well, 1% don't speak English at all).
4.0% of residents speak other language at home (82% speak English very well, 12% speak English well, 6% speak English not well).
In fiscal year 2004:
Federal Government expenditure: $1,239,365,000 ($4,646 per capita)
Department of Defense expenditure: $366,422,000
Federal direct payments to individuals for retirement and disability: $468,153,000
Federal other direct payments to individuals: $113,156,000
Federal direct payments not to individuals: $936,000
Federal grants: $122,224,000
Federal procurement contracts: $466,355,000 ($294,013,000 Department of Defense)
Federal salaries and wages: $68,541,000 ($10,387,000 Department of Defense)
Federal Government direct loans: $428,000
Federal guaranteed/insured loans: $230,712,000
Federal Government insurance: $66,218,000
Population change from April 1, 2000 to July 1, 2005:
Births: 18,503| Here: | 69 per 1000 residents |
| State: | 71 per 1000 residents |
Deaths: 6,914
| Here: | 26 per 1000 residents |
| State: | 41 per 1000 residents |
Net international migration: +5,704
| Here: | +21 per 1000 residents |
| State: | +19 per 1000 residents |
Net internal migration: +4,672
| Here: | +17 per 1000 residents |
| State: | +2 per 1000 residents |
Total withdrawal of fresh water for public supply: 0.00 millions of gallons per day (all from surface)
| Here: | 8.1 |
| State: | 7.3 |
| Here: | 4.2 |
| State: | 4.2 |
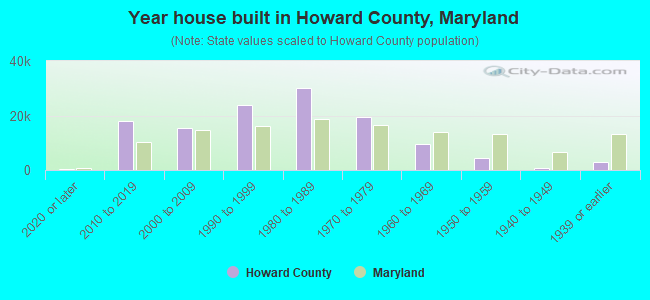
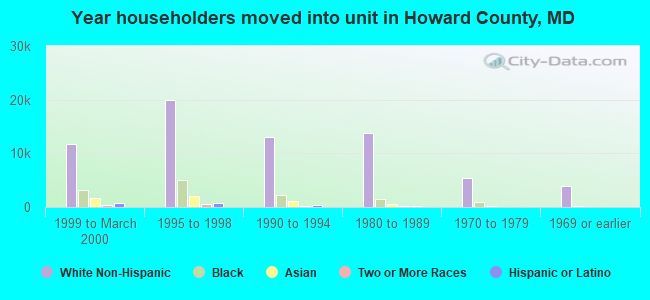
- Year house built in Howard County, Maryland
- 1,9262020 or later
- 16,2502010 to 2019
- 20,6752000 to 2009
- 24,4021990 to 1999
- 26,9031980 to 1989
- 21,2241970 to 1979
- 7,8911960 to 1969
- 3,7621950 to 1959
- 6351940 to 1949
- 2,1501939 or earlier
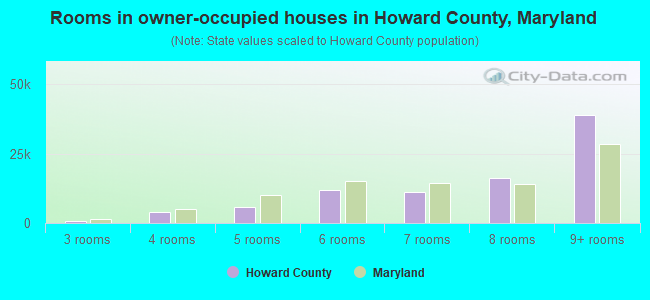
- Rooms in owner-occupied houses in Howard County, Maryland
- 01 room
- 02 rooms
- 1,6163 rooms
- 3,8964 rooms
- 8,4235 rooms
- 10,8846 rooms
- 10,2587 rooms
- 12,8548 rooms
- 37,7669+ rooms
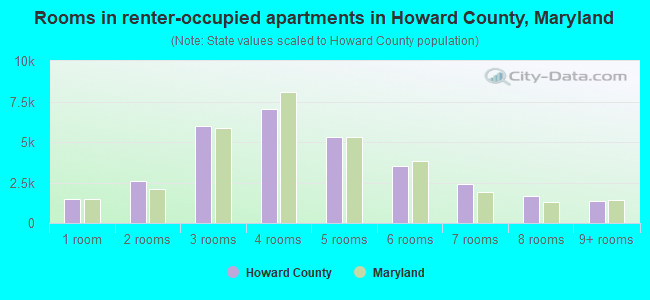
- Rooms in renter-occupied apartments in Howard County, Maryland
- 5131 room
- 2,9092 rooms
- 6,4683 rooms
- 11,1644 rooms
- 6,3035 rooms
- 4,9386 rooms
- 1,7797 rooms
- 6828 rooms
- 9709+ rooms
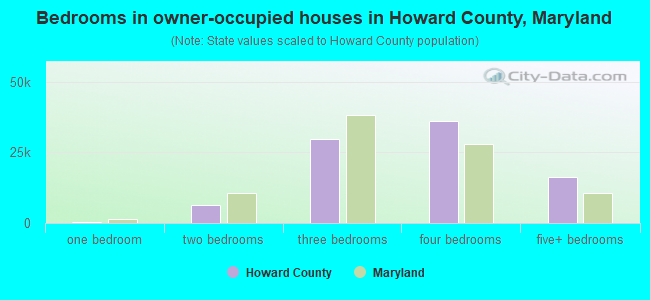
- Bedrooms in owner-occupied houses in Howard County, Maryland
- 0no bedroom
- 4811 bedroom
- 9,3712 bedrooms
- 27,2483 bedrooms
- 33,8664 bedrooms
- 14,7315+ bedrooms
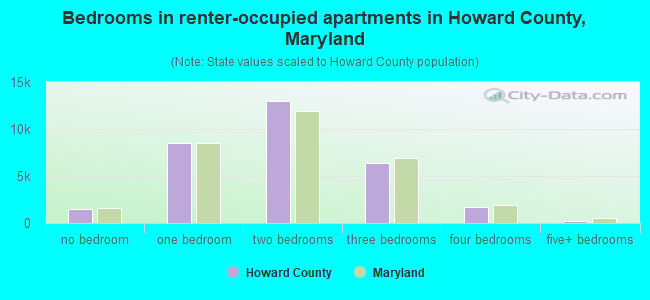
- Bedrooms in renter-occupied apartments in Howard County, Maryland
- 513no bedroom
- 9,6861 bedroom
- 15,4772 bedrooms
- 7,7893 bedrooms
- 1,6484 bedrooms
- 6135+ bedrooms
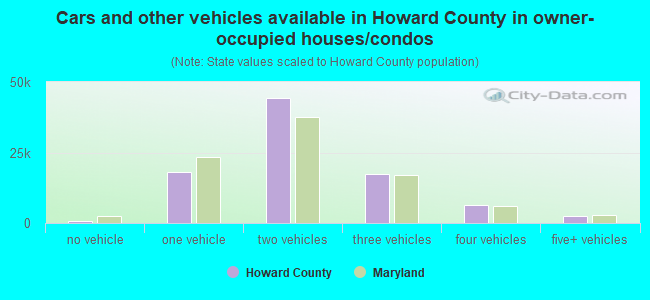
- Cars and other vehicles available in Howard County in owner-occupied houses/condos
- 1,223no vehicle
- 18,7761 vehicle
- 40,6302 vehicles
- 16,6813 vehicles
- 6,1894 vehicles
- 2,1985+ vehicles
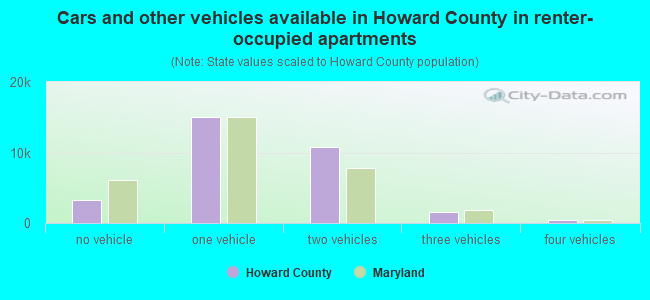
- Cars and other vehicles available in Howard County in renter-occupied apartments
- 3,185no vehicle
- 16,9291 vehicle
- 13,0152 vehicles
- 1,9643 vehicles
- 4694 vehicles
- 1645+ vehicles
86.7% of Howard County residents lived in the same house 1 years ago.
Out of people who lived in different houses, 24% lived in this county.
Out of people who lived in different counties, 60% lived in Maryland.
| Howard County: | 86.7% |
| State average: | 88.5% |
Place of birth for U.S.-born residents:
- This state: 135,190
- Other state: 117,613
- Northeast: 43,395
- Midwest: 14,501
- South: 49,527
- West: 10,190
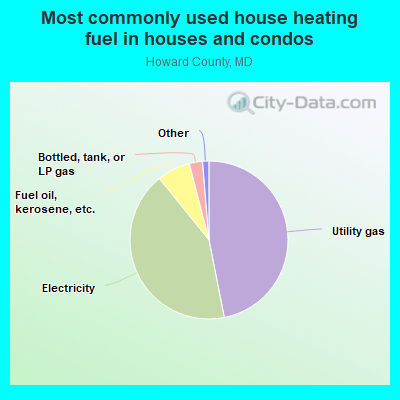
- 49.1%Utility gas
- 39.2%Electricity
- 5.9%Fuel oil, kerosene, etc.
- 3.2%Bottled, tank, or LP gas
- 1.0%Wood
- 0.8%Other fuel
- 0.6%Solar energy
- 0.1%No fuel used
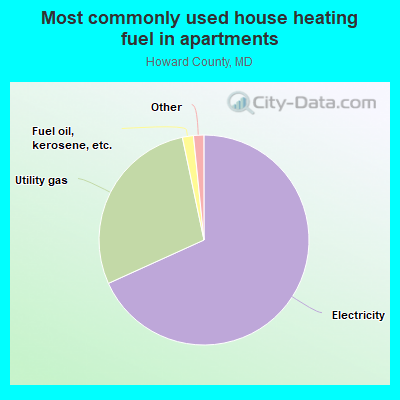
- 70.1%Electricity
- 26.8%Utility gas
- 0.9%Fuel oil, kerosene, etc.
- 0.9%Bottled, tank, or LP gas
- 0.7%Solar energy
- 0.5%No fuel used
- 0.2%Other fuel
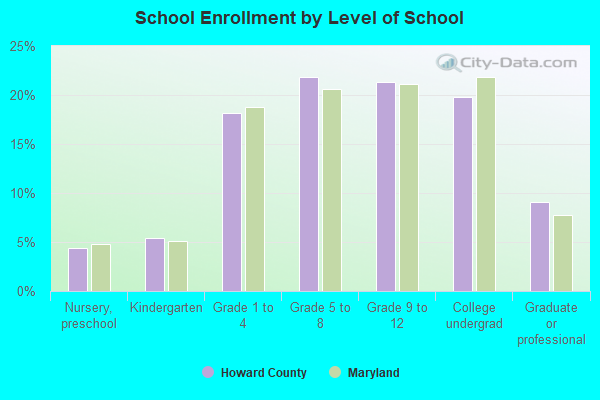
Private vs. public school enrollment:
| Here: | 11.1% |
| Maryland: | 15.2% |
| Here: | 12.0% |
| Maryland: | 14.4% |
| Here: | 13.3% |
| Maryland: | 20.2% |
Howard County government finances - Expenditure in 2020:
- Bond Funds - Cash and Securities: $256,044,000
Cash and Securities: $108,676,000
- Charges - Other: $53,032,000
Other: $45,738,000
Sewerage: $33,254,000
Sewerage: $32,152,000
Solid Waste Management: $31,571,000
Higher Education - Other: $31,115,000
Higher Education - Other: $29,152,000
Parks and Recreation: $24,125,000
Solid Waste Management: $21,791,000
Parks and Recreation: $18,186,000
Elementary and Secondary Education School Lunch: $5,096,000
Higher Education Auxiliary Enterprises: $1,465,000
Higher Education Auxiliary Enterprises: $1,248,000
Elementary and Secondary Education School Tuition and Transportation: $1,031,000
Elementary and Secondary Education School Tuition and Transportation: $473,000
Elementary and Secondary Education - Other: $375,000
Parking Facilities: $5,000
Parking Facilities: $4,000
- Construction - Elementary and Secondary Education: $64,056,000
Elementary and Secondary Education: $43,592,000
Other Higher Education: $22,185,000
Other Higher Education: $7,174,000
- Current Operations - Elementary and Secondary Education: $925,596,000
Elementary and Secondary Education: $838,736,000
General - Other: $173,625,000
General - Other: $167,544,000
Local Fire Protection: $116,041,000
Police Protection: $114,837,000
Police Protection: $114,044,000
Local Fire Protection: $108,084,000
Water Utilities: $100,959,000
Other Higher Education: $98,260,000
Water Utilities: $95,742,000
Other Higher Education: $95,419,000
Parks and Recreation: $69,563,000
Housing and Community Development: $59,852,000
Parks and Recreation: $56,777,000
Housing and Community Development: $50,960,000
Regular Highways: $46,628,000
Regular Highways: $44,978,000
Sewerage: $39,582,000
Sewerage: $34,500,000
Judicial and Legal Services: $24,743,000
Judicial and Legal Services: $23,643,000
Solid Waste Management: $22,418,000
Libraries: $21,451,000
Central Staff Services: $21,038,000
Libraries: $20,309,000
Correctional Institutions: $20,117,000
Central Staff Services: $19,565,000
Solid Waste Management: $19,473,000
Correctional Institutions: $19,137,000
General Public Buildings: $18,472,000
General Public Buildings: $17,745,000
Transit Utilities: $16,793,000
Transit Utilities: $16,652,000
Financial Administration: $16,313,000
Health - Other: $12,893,000
Health - Other: $12,415,000
Public Welfare - Other: $10,093,000
Financial Administration: $9,816,000
Protective Inspection and Regulation - Other: $7,992,000
Protective Inspection and Regulation - Other: $7,592,000
Natural Resources - Other: $5,468,000
Higher Education Auxiliary Enterprises: $3,696,000
Higher Education Auxiliary Enterprises: $3,386,000
Natural Resources - Other: $2,223,000
- Federal Intergovernmental - Housing and Community Development: $16,874,000
Other: $14,202,000
Housing and Community Development: $12,009,000
Other: $7,274,000
Education: $7,027,000
Education: $3,848,000
Highways: $1,316,000
Highways: $1,235,000
Transit Utilities: $801,000
Transit Utilities: $329,000
Water Utilities: $227,000
Water Utilities: $110,000
- General - Interest on Debt: $92,267,000
Interest on Debt: $76,406,000
- Intergovernmental to Local - Other - Elementary and Secondary Education: $14,818,000
Other - Elementary and Secondary Education: $6,039,000
Other - General - Other: $638,000
- Local Intergovernmental - Education: $47,472,000
Education: $39,978,000
Other: $4,428,000
Other: $701,000
- Long Term Debt - Outstanding Unspecified Public Purpose: $2,388,622,000
Beginning Outstanding - Unspecified Public Purpose: $2,315,490,000
Outstanding Unspecified Public Purpose: $2,233,677,000
Beginning Outstanding - Unspecified Public Purpose: $1,951,993,000
Issue, Unspecified Public Purpose: $662,553,000
Retired Unspecified Public Purpose: $380,869,000
Issue, Unspecified Public Purpose: $287,731,000
Retired Unspecified Public Purpose: $214,598,000
Beginning Outstanding - Public Debt for Private Purpose: $118,663,000
Outstanding Nonguaranteed - Industrial Revenue: $118,113,000
Beginning Outstanding - Public Debt for Private Purpose: $117,563,000
Outstanding Nonguaranteed - Industrial Revenue: $117,013,000
Retired Nonguaranteed - Public Debt for Private Purpose: $550,000
Retired Nonguaranteed - Public Debt for Private Purpose: $550,000
- Miscellaneous - General Revenue - Other: $44,722,000
General Revenue - Other: $41,905,000
Interest Earnings: $13,959,000
Interest Earnings: $8,127,000
Fines and Forfeits: $4,316,000
Fines and Forfeits: $3,989,000
Sale of Property: $1,383,000
Rents: $482,000
Donations From Private Sources: $470,000
Donations From Private Sources: $413,000
Rents: $196,000
Sale of Property: $34,000
- Other Capital Outlay - Police Protection: $1,634,000
Elementary and Secondary Education: $1,365,000
Other Higher Education: $1,243,000
Elementary and Secondary Education: $1,120,000
Other Higher Education: $356,000
Police Protection: $276,000
Regular Highways: $243,000
Parks and Recreation: $217,000
Regular Highways: $189,000
Parks and Recreation: $151,000
Transit Utilities: $137,000
Health - Other: $83,000
Central Staff Services: $56,000
General Public Building: $52,000
Correctional Institutions: $23,000
Judicial and Legal Services: $11,000
- Other Funds - Cash and Securities: $590,803,000
Cash and Securities: $509,867,000
- Revenue - Water Utilities: $27,380,000
Water Utilities: $25,717,000
- Short Term Debt Outstanding - End of Fiscal Year: $54,987,000
Beginning: $53,450,000
Beginning: $45,476,000
End of Fiscal Year: $32,317,000
- Sinking Funds - Cash and Securities: $128,439,000
Cash and Securities: $126,784,000
- State Intergovernmental - Education: $352,586,000
Education: $306,014,000
Other: $30,003,000
Other: $19,427,000
Transit Utilities: $4,003,000
Highways: $3,900,000
Transit Utilities: $3,696,000
Highways: $2,445,000
General Local Government Support: $2,314,000
General Local Government Support: $1,520,000
Water Utilities: $1,209,000
Water Utilities: $879,000
Housing and Community Development: $79,000
- Tax - Property: $703,717,000
Property: $668,114,000
Individual Income: $521,861,000
Individual Income: $444,453,000
Other: $86,112,000
Other: $77,122,000
Documentary and Stock Transfer: $23,267,000
Documentary and Stock Transfer: $22,703,000
Public Utility License: $5,980,000
Other Selective Sales: $5,289,000
Other Selective Sales: $4,651,000
Public Utility License: $4,602,000
Other License: $3,571,000
Occupation and Business License - Other: $3,167,000
Occupation and Business License - Other: $3,125,000
Amusements Sales: $3,048,000
Amusements Sales: $2,978,000
Other License: $2,759,000
Alcoholic Beverage License: $301,000
Alcoholic Beverage License: $182,000
- Total Salaries and Wages: $752,780,000
: $738,322,000
Howard County government finances - Revenue in 2020:
- Bond Funds - Cash and Securities: $256,044,000
Cash and Securities: $108,676,000
- Charges - Other: $53,032,000
Other: $45,738,000
Sewerage: $33,254,000
Sewerage: $32,152,000
Solid Waste Management: $31,571,000
Higher Education - Other: $31,115,000
Higher Education - Other: $29,152,000
Parks and Recreation: $24,125,000
Solid Waste Management: $21,791,000
Parks and Recreation: $18,186,000
Elementary and Secondary Education School Lunch: $5,096,000
Higher Education Auxiliary Enterprises: $1,465,000
Higher Education Auxiliary Enterprises: $1,248,000
Elementary and Secondary Education School Tuition and Transportation: $1,031,000
Elementary and Secondary Education School Tuition and Transportation: $473,000
Elementary and Secondary Education - Other: $375,000
Parking Facilities: $5,000
Parking Facilities: $4,000
- Construction - Elementary and Secondary Education: $64,056,000
Elementary and Secondary Education: $43,592,000
Other Higher Education: $22,185,000
Other Higher Education: $7,174,000
- Current Operations - Elementary and Secondary Education: $925,596,000
Elementary and Secondary Education: $838,736,000
General - Other: $173,625,000
General - Other: $167,544,000
Local Fire Protection: $116,041,000
Police Protection: $114,837,000
Police Protection: $114,044,000
Local Fire Protection: $108,084,000
Water Utilities: $100,959,000
Other Higher Education: $98,260,000
Water Utilities: $95,742,000
Other Higher Education: $95,419,000
Parks and Recreation: $69,563,000
Housing and Community Development: $59,852,000
Parks and Recreation: $56,777,000
Housing and Community Development: $50,960,000
Regular Highways: $46,628,000
Regular Highways: $44,978,000
Sewerage: $39,582,000
Sewerage: $34,500,000
Judicial and Legal Services: $24,743,000
Judicial and Legal Services: $23,643,000
Solid Waste Management: $22,418,000
Libraries: $21,451,000
Central Staff Services: $21,038,000
Libraries: $20,309,000
Correctional Institutions: $20,117,000
Central Staff Services: $19,565,000
Solid Waste Management: $19,473,000
Correctional Institutions: $19,137,000
General Public Buildings: $18,472,000
General Public Buildings: $17,745,000
Transit Utilities: $16,793,000
Transit Utilities: $16,652,000
Financial Administration: $16,313,000
Health - Other: $12,893,000
Health - Other: $12,415,000
Public Welfare - Other: $10,093,000
Financial Administration: $9,816,000
Protective Inspection and Regulation - Other: $7,992,000
Protective Inspection and Regulation - Other: $7,592,000
Natural Resources - Other: $5,468,000
Higher Education Auxiliary Enterprises: $3,696,000
Higher Education Auxiliary Enterprises: $3,386,000
Natural Resources - Other: $2,223,000
- Federal Intergovernmental - Housing and Community Development: $16,874,000
Other: $14,202,000
Housing and Community Development: $12,009,000
Other: $7,274,000
Education: $7,027,000
Education: $3,848,000
Highways: $1,316,000
Highways: $1,235,000
Transit Utilities: $801,000
Transit Utilities: $329,000
Water Utilities: $227,000
Water Utilities: $110,000
- General - Interest on Debt: $92,267,000
Interest on Debt: $76,406,000
- Intergovernmental to Local - Other - Elementary and Secondary Education: $14,818,000
Other - Elementary and Secondary Education: $6,039,000
Other - General - Other: $638,000
- Local Intergovernmental - Education: $47,472,000
Education: $39,978,000
Other: $4,428,000
Other: $701,000
- Long Term Debt - Outstanding Unspecified Public Purpose: $2,388,622,000
Beginning Outstanding - Unspecified Public Purpose: $2,315,490,000
Outstanding Unspecified Public Purpose: $2,233,677,000
Beginning Outstanding - Unspecified Public Purpose: $1,951,993,000
Issue, Unspecified Public Purpose: $662,553,000
Retired Unspecified Public Purpose: $380,869,000
Issue, Unspecified Public Purpose: $287,731,000
Retired Unspecified Public Purpose: $214,598,000
Beginning Outstanding - Public Debt for Private Purpose: $118,663,000
Outstanding Nonguaranteed - Industrial Revenue: $118,113,000
Beginning Outstanding - Public Debt for Private Purpose: $117,563,000
Outstanding Nonguaranteed - Industrial Revenue: $117,013,000
Retired Nonguaranteed - Public Debt for Private Purpose: $550,000
Retired Nonguaranteed - Public Debt for Private Purpose: $550,000
- Miscellaneous - General Revenue - Other: $44,722,000
General Revenue - Other: $41,905,000
Interest Earnings: $13,959,000
Interest Earnings: $8,127,000
Fines and Forfeits: $4,316,000
Fines and Forfeits: $3,989,000
Sale of Property: $1,383,000
Rents: $482,000
Donations From Private Sources: $470,000
Donations From Private Sources: $413,000
Rents: $196,000
Sale of Property: $34,000
- Other Capital Outlay - Police Protection: $1,634,000
Elementary and Secondary Education: $1,365,000
Other Higher Education: $1,243,000
Elementary and Secondary Education: $1,120,000
Other Higher Education: $356,000
Police Protection: $276,000
Regular Highways: $243,000
Parks and Recreation: $217,000
Regular Highways: $189,000
Parks and Recreation: $151,000
Transit Utilities: $137,000
Health - Other: $83,000
Central Staff Services: $56,000
General Public Building: $52,000
Correctional Institutions: $23,000
Judicial and Legal Services: $11,000
- Other Funds - Cash and Securities: $590,803,000
Cash and Securities: $509,867,000
- Revenue - Water Utilities: $27,380,000
Water Utilities: $25,717,000
- Short Term Debt Outstanding - End of Fiscal Year: $54,987,000
Beginning: $53,450,000
Beginning: $45,476,000
End of Fiscal Year: $32,317,000
- Sinking Funds - Cash and Securities: $128,439,000
Cash and Securities: $126,784,000
- State Intergovernmental - Education: $352,586,000
Education: $306,014,000
Other: $30,003,000
Other: $19,427,000
Transit Utilities: $4,003,000
Highways: $3,900,000
Transit Utilities: $3,696,000
Highways: $2,445,000
General Local Government Support: $2,314,000
General Local Government Support: $1,520,000
Water Utilities: $1,209,000
Water Utilities: $879,000
Housing and Community Development: $79,000
- Tax - Property: $703,717,000
Property: $668,114,000
Individual Income: $521,861,000
Individual Income: $444,453,000
Other: $86,112,000
Other: $77,122,000
Documentary and Stock Transfer: $23,267,000
Documentary and Stock Transfer: $22,703,000
Public Utility License: $5,980,000
Other Selective Sales: $5,289,000
Other Selective Sales: $4,651,000
Public Utility License: $4,602,000
Other License: $3,571,000
Occupation and Business License - Other: $3,167,000
Occupation and Business License - Other: $3,125,000
Amusements Sales: $3,048,000
Amusements Sales: $2,978,000
Other License: $2,759,000
Alcoholic Beverage License: $301,000
Alcoholic Beverage License: $182,000
- Total Salaries and Wages: $752,780,000
: $738,322,000
Howard County government finances - Debt in 2020:
- Bond Funds - Cash and Securities: $256,044,000
Cash and Securities: $108,676,000
- Charges - Other: $53,032,000
Other: $45,738,000
Sewerage: $33,254,000
Sewerage: $32,152,000
Solid Waste Management: $31,571,000
Higher Education - Other: $31,115,000
Higher Education - Other: $29,152,000
Parks and Recreation: $24,125,000
Solid Waste Management: $21,791,000
Parks and Recreation: $18,186,000
Elementary and Secondary Education School Lunch: $5,096,000
Higher Education Auxiliary Enterprises: $1,465,000
Higher Education Auxiliary Enterprises: $1,248,000
Elementary and Secondary Education School Tuition and Transportation: $1,031,000
Elementary and Secondary Education School Tuition and Transportation: $473,000
Elementary and Secondary Education - Other: $375,000
Parking Facilities: $5,000
Parking Facilities: $4,000
- Construction - Elementary and Secondary Education: $64,056,000
Elementary and Secondary Education: $43,592,000
Other Higher Education: $22,185,000
Other Higher Education: $7,174,000
- Current Operations - Elementary and Secondary Education: $925,596,000
Elementary and Secondary Education: $838,736,000
General - Other: $173,625,000
General - Other: $167,544,000
Local Fire Protection: $116,041,000
Police Protection: $114,837,000
Police Protection: $114,044,000
Local Fire Protection: $108,084,000
Water Utilities: $100,959,000
Other Higher Education: $98,260,000
Water Utilities: $95,742,000
Other Higher Education: $95,419,000
Parks and Recreation: $69,563,000
Housing and Community Development: $59,852,000
Parks and Recreation: $56,777,000
Housing and Community Development: $50,960,000
Regular Highways: $46,628,000
Regular Highways: $44,978,000
Sewerage: $39,582,000
Sewerage: $34,500,000
Judicial and Legal Services: $24,743,000
Judicial and Legal Services: $23,643,000
Solid Waste Management: $22,418,000
Libraries: $21,451,000
Central Staff Services: $21,038,000
Libraries: $20,309,000
Correctional Institutions: $20,117,000
Central Staff Services: $19,565,000
Solid Waste Management: $19,473,000
Correctional Institutions: $19,137,000
General Public Buildings: $18,472,000
General Public Buildings: $17,745,000
Transit Utilities: $16,793,000
Transit Utilities: $16,652,000
Financial Administration: $16,313,000
Health - Other: $12,893,000
Health - Other: $12,415,000
Public Welfare - Other: $10,093,000
Financial Administration: $9,816,000
Protective Inspection and Regulation - Other: $7,992,000
Protective Inspection and Regulation - Other: $7,592,000
Natural Resources - Other: $5,468,000
Higher Education Auxiliary Enterprises: $3,696,000
Higher Education Auxiliary Enterprises: $3,386,000
Natural Resources - Other: $2,223,000
- Federal Intergovernmental - Housing and Community Development: $16,874,000
Other: $14,202,000
Housing and Community Development: $12,009,000
Other: $7,274,000
Education: $7,027,000
Education: $3,848,000
Highways: $1,316,000
Highways: $1,235,000
Transit Utilities: $801,000
Transit Utilities: $329,000
Water Utilities: $227,000
Water Utilities: $110,000
- General - Interest on Debt: $92,267,000
Interest on Debt: $76,406,000
- Intergovernmental to Local - Other - Elementary and Secondary Education: $14,818,000
Other - Elementary and Secondary Education: $6,039,000
Other - General - Other: $638,000
- Local Intergovernmental - Education: $47,472,000
Education: $39,978,000
Other: $4,428,000
Other: $701,000
- Long Term Debt - Outstanding Unspecified Public Purpose: $2,388,622,000
Beginning Outstanding - Unspecified Public Purpose: $2,315,490,000
Outstanding Unspecified Public Purpose: $2,233,677,000
Beginning Outstanding - Unspecified Public Purpose: $1,951,993,000
Issue, Unspecified Public Purpose: $662,553,000
Retired Unspecified Public Purpose: $380,869,000
Issue, Unspecified Public Purpose: $287,731,000
Retired Unspecified Public Purpose: $214,598,000
Beginning Outstanding - Public Debt for Private Purpose: $118,663,000
Outstanding Nonguaranteed - Industrial Revenue: $118,113,000
Beginning Outstanding - Public Debt for Private Purpose: $117,563,000
Outstanding Nonguaranteed - Industrial Revenue: $117,013,000
Retired Nonguaranteed - Public Debt for Private Purpose: $550,000
Retired Nonguaranteed - Public Debt for Private Purpose: $550,000
- Miscellaneous - General Revenue - Other: $44,722,000
General Revenue - Other: $41,905,000
Interest Earnings: $13,959,000
Interest Earnings: $8,127,000
Fines and Forfeits: $4,316,000
Fines and Forfeits: $3,989,000
Sale of Property: $1,383,000
Rents: $482,000
Donations From Private Sources: $470,000
Donations From Private Sources: $413,000
Rents: $196,000
Sale of Property: $34,000
- Other Capital Outlay - Police Protection: $1,634,000
Elementary and Secondary Education: $1,365,000
Other Higher Education: $1,243,000
Elementary and Secondary Education: $1,120,000
Other Higher Education: $356,000
Police Protection: $276,000
Regular Highways: $243,000
Parks and Recreation: $217,000
Regular Highways: $189,000
Parks and Recreation: $151,000
Transit Utilities: $137,000
Health - Other: $83,000
Central Staff Services: $56,000
General Public Building: $52,000
Correctional Institutions: $23,000
Judicial and Legal Services: $11,000
- Other Funds - Cash and Securities: $590,803,000
Cash and Securities: $509,867,000
- Revenue - Water Utilities: $27,380,000
Water Utilities: $25,717,000
- Short Term Debt Outstanding - End of Fiscal Year: $54,987,000
Beginning: $53,450,000
Beginning: $45,476,000
End of Fiscal Year: $32,317,000
- Sinking Funds - Cash and Securities: $128,439,000
Cash and Securities: $126,784,000
- State Intergovernmental - Education: $352,586,000
Education: $306,014,000
Other: $30,003,000
Other: $19,427,000
Transit Utilities: $4,003,000
Highways: $3,900,000
Transit Utilities: $3,696,000
Highways: $2,445,000
General Local Government Support: $2,314,000
General Local Government Support: $1,520,000
Water Utilities: $1,209,000
Water Utilities: $879,000
Housing and Community Development: $79,000
- Tax - Property: $703,717,000
Property: $668,114,000
Individual Income: $521,861,000
Individual Income: $444,453,000
Other: $86,112,000
Other: $77,122,000
Documentary and Stock Transfer: $23,267,000
Documentary and Stock Transfer: $22,703,000
Public Utility License: $5,980,000
Other Selective Sales: $5,289,000
Other Selective Sales: $4,651,000
Public Utility License: $4,602,000
Other License: $3,571,000
Occupation and Business License - Other: $3,167,000
Occupation and Business License - Other: $3,125,000
Amusements Sales: $3,048,000
Amusements Sales: $2,978,000
Other License: $2,759,000
Alcoholic Beverage License: $301,000
Alcoholic Beverage License: $182,000
- Total Salaries and Wages: $752,780,000
: $738,322,000
Howard County government finances - Cash and Securities in 2020:
- Bond Funds - Cash and Securities: $256,044,000
Cash and Securities: $108,676,000
- Charges - Other: $53,032,000
Other: $45,738,000
Sewerage: $33,254,000
Sewerage: $32,152,000
Solid Waste Management: $31,571,000
Higher Education - Other: $31,115,000
Higher Education - Other: $29,152,000
Parks and Recreation: $24,125,000
Solid Waste Management: $21,791,000
Parks and Recreation: $18,186,000
Elementary and Secondary Education School Lunch: $5,096,000
Higher Education Auxiliary Enterprises: $1,465,000
Higher Education Auxiliary Enterprises: $1,248,000
Elementary and Secondary Education School Tuition and Transportation: $1,031,000
Elementary and Secondary Education School Tuition and Transportation: $473,000
Elementary and Secondary Education - Other: $375,000
Parking Facilities: $5,000
Parking Facilities: $4,000
- Construction - Elementary and Secondary Education: $64,056,000
Elementary and Secondary Education: $43,592,000
Other Higher Education: $22,185,000
Other Higher Education: $7,174,000
- Current Operations - Elementary and Secondary Education: $925,596,000
Elementary and Secondary Education: $838,736,000
General - Other: $173,625,000
General - Other: $167,544,000
Local Fire Protection: $116,041,000
Police Protection: $114,837,000
Police Protection: $114,044,000
Local Fire Protection: $108,084,000
Water Utilities: $100,959,000
Other Higher Education: $98,260,000
Water Utilities: $95,742,000
Other Higher Education: $95,419,000
Parks and Recreation: $69,563,000
Housing and Community Development: $59,852,000
Parks and Recreation: $56,777,000
Housing and Community Development: $50,960,000
Regular Highways: $46,628,000
Regular Highways: $44,978,000
Sewerage: $39,582,000
Sewerage: $34,500,000
Judicial and Legal Services: $24,743,000
Judicial and Legal Services: $23,643,000
Solid Waste Management: $22,418,000
Libraries: $21,451,000
Central Staff Services: $21,038,000
Libraries: $20,309,000
Correctional Institutions: $20,117,000
Central Staff Services: $19,565,000
Solid Waste Management: $19,473,000
Correctional Institutions: $19,137,000
General Public Buildings: $18,472,000
General Public Buildings: $17,745,000
Transit Utilities: $16,793,000
Transit Utilities: $16,652,000
Financial Administration: $16,313,000
Health - Other: $12,893,000
Health - Other: $12,415,000
Public Welfare - Other: $10,093,000
Financial Administration: $9,816,000
Protective Inspection and Regulation - Other: $7,992,000
Protective Inspection and Regulation - Other: $7,592,000
Natural Resources - Other: $5,468,000
Higher Education Auxiliary Enterprises: $3,696,000
Higher Education Auxiliary Enterprises: $3,386,000
Natural Resources - Other: $2,223,000
- Federal Intergovernmental - Housing and Community Development: $16,874,000
Other: $14,202,000
Housing and Community Development: $12,009,000
Other: $7,274,000
Education: $7,027,000
Education: $3,848,000
Highways: $1,316,000
Highways: $1,235,000
Transit Utilities: $801,000
Transit Utilities: $329,000
Water Utilities: $227,000
Water Utilities: $110,000
- General - Interest on Debt: $92,267,000
Interest on Debt: $76,406,000
- Intergovernmental to Local - Other - Elementary and Secondary Education: $14,818,000
Other - Elementary and Secondary Education: $6,039,000
Other - General - Other: $638,000
- Local Intergovernmental - Education: $47,472,000
Education: $39,978,000
Other: $4,428,000
Other: $701,000
- Long Term Debt - Outstanding Unspecified Public Purpose: $2,388,622,000
Beginning Outstanding - Unspecified Public Purpose: $2,315,490,000
Outstanding Unspecified Public Purpose: $2,233,677,000
Beginning Outstanding - Unspecified Public Purpose: $1,951,993,000
Issue, Unspecified Public Purpose: $662,553,000
Retired Unspecified Public Purpose: $380,869,000
Issue, Unspecified Public Purpose: $287,731,000
Retired Unspecified Public Purpose: $214,598,000
Beginning Outstanding - Public Debt for Private Purpose: $118,663,000
Outstanding Nonguaranteed - Industrial Revenue: $118,113,000
Beginning Outstanding - Public Debt for Private Purpose: $117,563,000
Outstanding Nonguaranteed - Industrial Revenue: $117,013,000
Retired Nonguaranteed - Public Debt for Private Purpose: $550,000
Retired Nonguaranteed - Public Debt for Private Purpose: $550,000
- Miscellaneous - General Revenue - Other: $44,722,000
General Revenue - Other: $41,905,000
Interest Earnings: $13,959,000
Interest Earnings: $8,127,000
Fines and Forfeits: $4,316,000
Fines and Forfeits: $3,989,000
Sale of Property: $1,383,000
Rents: $482,000
Donations From Private Sources: $470,000
Donations From Private Sources: $413,000
Rents: $196,000
Sale of Property: $34,000
- Other Capital Outlay - Police Protection: $1,634,000
Elementary and Secondary Education: $1,365,000
Other Higher Education: $1,243,000
Elementary and Secondary Education: $1,120,000
Other Higher Education: $356,000
Police Protection: $276,000
Regular Highways: $243,000
Parks and Recreation: $217,000
Regular Highways: $189,000
Parks and Recreation: $151,000
Transit Utilities: $137,000
Health - Other: $83,000
Central Staff Services: $56,000
General Public Building: $52,000
Correctional Institutions: $23,000
Judicial and Legal Services: $11,000
- Other Funds - Cash and Securities: $590,803,000
Cash and Securities: $509,867,000
- Revenue - Water Utilities: $27,380,000
Water Utilities: $25,717,000
- Short Term Debt Outstanding - End of Fiscal Year: $54,987,000
Beginning: $53,450,000
Beginning: $45,476,000
End of Fiscal Year: $32,317,000
- Sinking Funds - Cash and Securities: $128,439,000
Cash and Securities: $126,784,000
- State Intergovernmental - Education: $352,586,000
Education: $306,014,000
Other: $30,003,000
Other: $19,427,000
Transit Utilities: $4,003,000
Highways: $3,900,000
Transit Utilities: $3,696,000
Highways: $2,445,000
General Local Government Support: $2,314,000
General Local Government Support: $1,520,000
Water Utilities: $1,209,000
Water Utilities: $879,000
Housing and Community Development: $79,000
- Tax - Property: $703,717,000
Property: $668,114,000
Individual Income: $521,861,000
Individual Income: $444,453,000
Other: $86,112,000
Other: $77,122,000
Documentary and Stock Transfer: $23,267,000
Documentary and Stock Transfer: $22,703,000
Public Utility License: $5,980,000
Other Selective Sales: $5,289,000
Other Selective Sales: $4,651,000
Public Utility License: $4,602,000
Other License: $3,571,000
Occupation and Business License - Other: $3,167,000
Occupation and Business License - Other: $3,125,000
Amusements Sales: $3,048,000
Amusements Sales: $2,978,000
Other License: $2,759,000
Alcoholic Beverage License: $301,000
Alcoholic Beverage License: $182,000
- Total Salaries and Wages: $752,780,000
: $738,322,000
Supplemental Security Income (SSI) in 2006:
- Total number of recipients: 2,293
- Number of aged recipients: 783
- Number of blind and disabled recipients: 1,510
- Number of recipients under 18: 242
- Number of recipients between 18 and 64: 1,064
- Number of recipients older than 64: 987
- Number of recipients also receiving OASDI: 585
- Amount of payments (thousands of dollars): 1,038
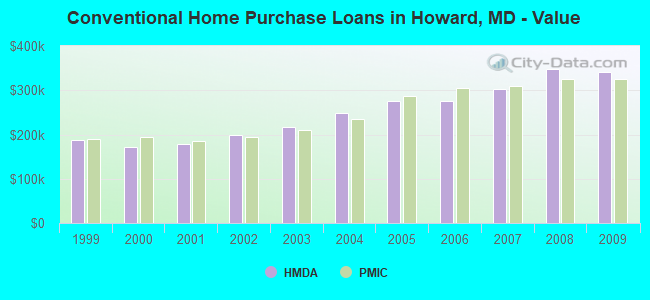
| Home Mortgage Disclosure Act Aggregated Statistics For Year 2009 (Based on 41 full tracts) | ||||||||||||||
| A) FHA, FSA/RHS & VA Home Purchase Loans | B) Conventional Home Purchase Loans | C) Refinancings | D) Home Improvement Loans | E) Loans on Dwellings For 5+ Families | F) Non-occupant Loans on < 5 Family Dwellings (A B C & D) | G) Loans On Manufactured Home Dwelling (A B C & D) | ||||||||
|---|---|---|---|---|---|---|---|---|---|---|---|---|---|---|
| Number | Average Value | Number | Average Value | Number | Average Value | Number | Average Value | Number | Average Value | Number | Average Value | Number | Average Value | |
| LOANS ORIGINATED | 1,478 | $316,702 | 1,974 | $341,475 | 10,832 | $298,026 | 417 | $189,626 | 4 | $10,582,250 | 306 | $223,944 | 27 | $64,926 |
| APPLICATIONS APPROVED, NOT ACCEPTED | 48 | $352,458 | 152 | $411,539 | 744 | $308,078 | 55 | $102,909 | 0 | $0 | 20 | $260,950 | 13 | $71,231 |
| APPLICATIONS DENIED | 121 | $314,612 | 224 | $334,562 | 2,500 | $320,733 | 166 | $105,446 | 1 | $18,000 | 141 | $216,730 | 47 | $71,447 |
| APPLICATIONS WITHDRAWN | 164 | $310,994 | 287 | $344,380 | 1,959 | $317,956 | 59 | $220,136 | 1 | $2,600,000 | 77 | $249,571 | 4 | $95,500 |
| FILES CLOSED FOR INCOMPLETENESS | 15 | $324,400 | 55 | $341,200 | 437 | $314,302 | 30 | $158,167 | 0 | $0 | 21 | $242,571 | 7 | $76,714 |
| Private Mortgage Insurance Companies Aggregated Statistics For Year 2009 (Based on 41 full tracts) | ||||||
| A) Conventional Home Purchase Loans | B) Refinancings | C) Non-occupant Loans on < 5 Family Dwellings (A & B) | ||||
|---|---|---|---|---|---|---|
| Number | Average Value | Number | Average Value | Number | Average Value | |
| LOANS ORIGINATED | 241 | $326,266 | 155 | $326,368 | 3 | $334,667 |
| APPLICATIONS APPROVED, NOT ACCEPTED | 74 | $346,378 | 63 | $321,921 | 0 | $0 |
| APPLICATIONS DENIED | 46 | $369,565 | 57 | $332,281 | 0 | $0 |
| APPLICATIONS WITHDRAWN | 24 | $361,583 | 18 | $366,611 | 0 | $0 |
| FILES CLOSED FOR INCOMPLETENESS | 1 | $584,000 | 1 | $193,000 | 0 | $0 |
| Most common first names in Howard County, MD among deceased individuals | ||
| Name | Count | Lived (average) |
|---|---|---|
| Mary | 607 | 80.2 years |
| John | 532 | 75.7 years |
| William | 486 | 75.3 years |
| James | 381 | 71.4 years |
| Margaret | 328 | 80.7 years |
| Charles | 319 | 74.6 years |
| Robert | 296 | 71.1 years |
| Helen | 273 | 82.8 years |
| Joseph | 264 | 75.5 years |
| Dorothy | 245 | 80.6 years |
| Most common last names in Howard County, MD among deceased individuals | ||
| Last name | Count | Lived (average) |
|---|---|---|
| Smith | 164 | 75.5 years |
| Johnson | 129 | 73.9 years |
| Brown | 116 | 75.6 years |
| Jones | 109 | 75.7 years |
| Miller | 101 | 79.6 years |
| Wilson | 75 | 76.7 years |
| Williams | 69 | 74.6 years |
| Taylor | 69 | 80.9 years |
| Anderson | 69 | 75.7 years |
| Davis | 66 | 76.5 years |
| Businesses in Howard County, MD | ||||
| Name | Count | Name | Count | |
|---|---|---|---|---|
| 7-Eleven | 7 | JCPenney | 1 | |
| ALDO | 3 | JoS. A. Bank | 2 | |
| AT&T | 8 | Johnny Rockets | 1 | |
| Abercrombie & Fitch | 1 | Jones New York | 3 | |
| Abercrombie Kids | 1 | Journeys | 2 | |
| Ace Hardware | 1 | Justice | 2 | |
| Advance Auto Parts | 3 | KFC | 2 | |
| Aeropostale | 2 | Knights Inn | 1 | |
| Aerosoles | 1 | Kroger | 1 | |
| American Eagle Outfitters | 3 | La Quinta | 1 | |
| Ann Taylor | 2 | La-Z-Boy | 1 | |
| Apple Store | 1 | Lane Bryant | 2 | |
| Applebee's | 1 | Lane Furniture | 2 | |
| Arby's | 3 | LensCrafters | 1 | |
| Baja Fresh Mexican Grill | 2 | Levi Strauss & Co. | 1 | |
| Bakers | 1 | Lowe's | 1 | |
| Banana Republic | 2 | Macy's | 1 | |
| Baskin-Robbins | 8 | Marriott | 5 | |
| Bath & Body Works | 2 | Marshalls | 1 | |
| Bebe | 1 | MasterBrand Cabinets | 27 | |
| Bed Bath & Beyond | 2 | McDonald's | 17 | |
| Best Western | 1 | Men's Wearhouse | 3 | |
| Blockbuster | 2 | Motherhood Maternity | 3 | |
| Brookstone | 1 | New Balance | 10 | |
| Brunswick Bowling & Billiards | 1 | New York & Co | 1 | |
| Budget Car Rental | 1 | Nike | 24 | |
| Burger King | 7 | Nissan | 1 | |
| CVS | 3 | Nordstrom | 1 | |
| Cache | 1 | Office Depot | 1 | |
| CarMax | 1 | Old Navy | 2 | |
| Casual Male XL | 1 | Olive Garden | 2 | |
| Catherines | 1 | On The Border | 1 | |
| Charlotte Russe | 1 | Pac Sun | 2 | |
| Chevrolet | 2 | Panda Express | 1 | |
| Chick-Fil-A | 5 | Panera Bread | 3 | |
| Chico's | 1 | Papa John's Pizza | 4 | |
| Chipotle | 3 | Payless | 2 | |
| Cinnabon | 2 | Penske | 2 | |
| Clarks | 2 | PetSmart | 2 | |
| Cold Stone Creamery | 1 | Pier 1 Imports | 1 | |
| Coldwater Creek | 1 | Pizza Hut | 7 | |
| Comfort Inn | 1 | Qdoba Mexican Grill | 2 | |
| Comfort Suites | 1 | Quiznos | 6 | |
| Costco | 2 | RadioShack | 3 | |
| Cricket Wireless | 3 | Ramada | 1 | |
| Curves | 4 | Red Lobster | 2 | |
| DHL | 3 | Red Robin | 1 | |
| Dairy Queen | 1 | Red Roof Inn | 2 | |
| Days Inn | 1 | Rite Aid | 3 | |
| Decora Cabinetry | 8 | Ruby Tuesday | 2 | |
| Dennys | 1 | Rue21 | 1 | |
| Domino's Pizza | 3 | SAS Shoes | 1 | |
| DressBarn | 1 | Safeway | 4 | |
| Dressbarn | 1 | Sears | 4 | |
| Dunkin Donuts | 12 | Sephora | 2 | |
| Econo Lodge | 2 | Sheraton | 1 | |
| Eddie Bauer | 2 | Skechers USA | 1 | |
| Express | 1 | Sleep Inn | 2 | |
| Extended Stay America | 2 | Spencer Gifts | 2 | |
| Extended Stay Deluxe | 1 | Sprint Nextel | 4 | |
| Famous Footwear | 1 | Staples | 3 | |
| FedEx | 48 | Starbucks | 16 | |
| Finish Line | 2 | Studio Plus Deluxe Studios | 1 | |
| Firestone Complete Auto Care | 1 | Subway | 15 | |
| Foot Locker | 2 | Super 8 | 2 | |
| Ford | 1 | T-Mobile | 7 | |
| Forever 21 | 2 | T.G.I. Driday's | 2 | |
| GNC | 3 | T.J.Maxx | 1 | |
| GameStop | 5 | Taco Bell | 4 | |
| Gap | 2 | Talbots | 2 | |
| Giant | 5 | Target | 1 | |
| Goodwill | 6 | The Cheesecake Factory | 1 | |
| Gymboree | 2 | The Limited | 2 | |
| H&M | 2 | The Room Place | 2 | |
| H&R Block | 5 | Toyota | 1 | |
| Hardee's | 1 | Toys"R"Us | 2 | |
| Havertys Furniture | 1 | Trader Joe's | 1 | |
| Hilton | 5 | U-Haul | 5 | |
| Hobby Lobby | 1 | UPS | 55 | |
| Holiday Inn | 4 | Vans | 7 | |
| Hollister Co. | 1 | Verizon Wireless | 2 | |
| Home Depot | 2 | Victoria's Secret | 2 | |
| Hot Topic | 2 | Vons | 4 | |
| Houlihan's | 1 | Walgreens | 1 | |
| Hyundai | 1 | Walmart | 2 | |
| J. Jill | 1 | Wendy's | 6 | |
| J.Crew | 2 | Wet Seal | 1 | |
Howard County on our top lists:
- #3 on the list of "Top 101 counties with the best general health status score of residents (1-5), 3 years of data"
- #4 on the list of "Top 101 counties with the highest percentage of residents that exercised in the past month"
- #11 on the list of "Top 101 counties with the largest number of children under 18 without health insurance coverage in 2000 (pop. 50,000+)"
- #13 on the list of "Top 101 counties with the highest percentage of residents that visited a dentist within the past year"
- #13 on the list of "Top 101 counties with the lowest percentage of residents that smoked 100+ cigarettes in their lives"
- #26 on the list of "Top 101 counties with the lowest number of deaths per 1000 residents 2007-2013 (pop. 50,000+)"
- #35 on the list of "Top 101 counties with the lowest average weight of females"
- #44 on the list of "Top 101 counties with the largest number of people without health insurance coverage in 2000 (pop. 50,000+)"
- #57 on the list of "Top 101 counties with the largest number of children under 18 without health insurance coverage in 2000"
- #67 on the list of "Top 101 counties with the highest percentage of residents relocating to foreign countries in 2011 (pop. 50,000+)"
- #73 on the list of "Top 101 counties with the lowest number of deaths per 1000 residents 2007-2013"
- #89 on the list of "Top 101 counties with the largest decrease in the number of births per 1000 residents 2000-2006 to 2007-2013 (pop 50,000+)"
- #93 on the list of "Top 101 counties with the highest percentage of residents relocating from foreign countries between 2010 and 2011 (pop. 50,000+)"
- #97 on the list of "Top 101 counties with the highest percentage of residents that drank alcohol in the past 30 days"