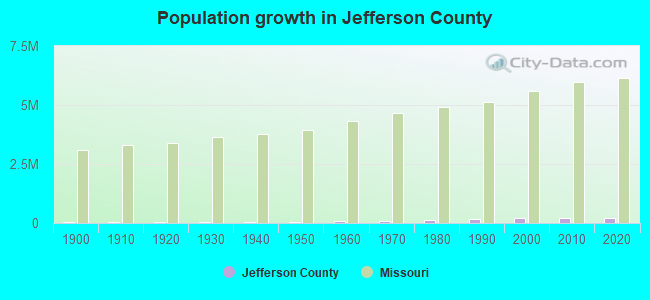
Jefferson County, Missouri (MO)
County owner-occupied free and clear houses and condos in 2010: 17,378
County owner-occupied houses and condos in 2000: 59,615
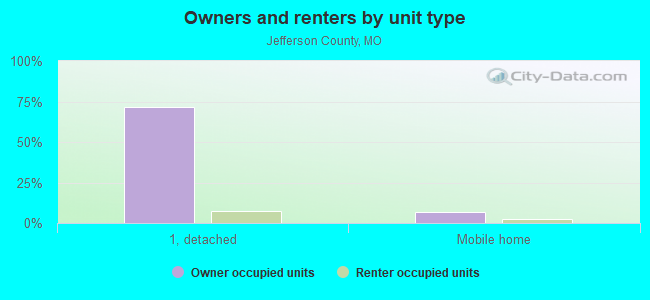
Renter-occupied apartments: 14,864 (it was 11,884 in 2000)
| % of renters here: | 17% |
| State: | 31% |
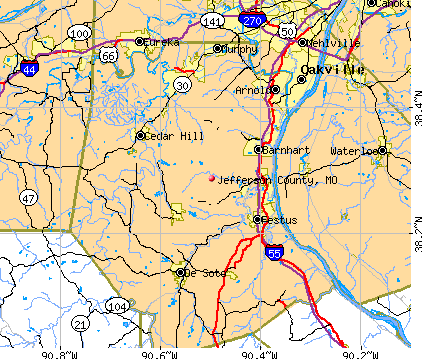
Land area: 657 sq. mi.
Water area: 7.3 sq. mi.
Population density: 349 people per square mile (high).
Industries providing employment: Educational, health and social services (21.2%), Manufacturing (12.3%), Retail trade (12.0%), Construction (10.4%), Professional, scientific, management, administrative, and waste management services (10.4%).
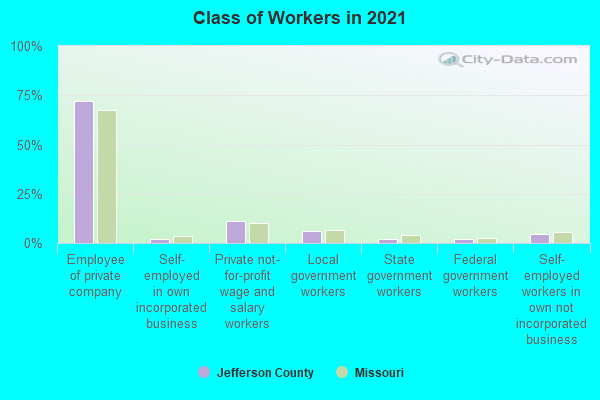
Type of workers:
- Private wage or salary: 86%
- Government: 10%
- Self-employed, not incorporated: 4%
- Unpaid family work: 0%
- OSM Map
- General Map
- Google Map
- MSN Map

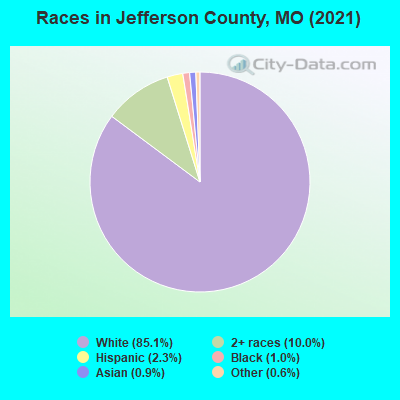
- 209,06491.2%White Non-Hispanic Alone
- 9,4644.1%Two or more races
- 5,5312.4%Hispanic or Latino
- 2,3841.0%Asian alone
- 1,3540.6%Black Non-Hispanic Alone
- 1,0240.4%Some other race alone
- 4620.2%American Indian and Alaska Native alone
- 530.02%Native Hawaiian and Other
Pacific Islander alone
| Median resident age: | 40.0 years |
| Missouri median age: | 39.1 years |
| Males: 114,699 | |
| Females: 114,637 |

 | Do not recommend living in Missouri (106 replies) |
| Things You Remember About St. Louis (229 replies) |
| Missouri stays deep red! (71 replies) |
| Looking to relocate to West Plains BUT... (26 replies) |
| Parts of Missouri that have an upstate NY feel/vibe? (22 replies) |
| Small Friendly Conservative Safe/Affordable to Retire (35 replies) |
| Jefferson County: | 2.0 people |
| Missouri: | 2 people |
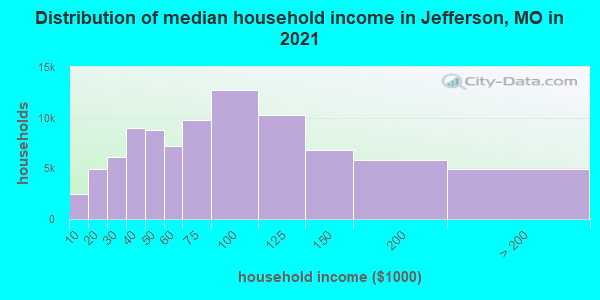
Estimated median household income in 2022: $78,568 ($46,338 in 1999)
| This county: | $78,568 |
| Missouri: | $64,811 |
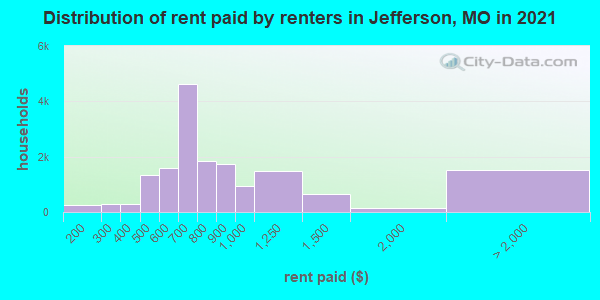
Median contract rent in 2022 for apartments: $693 (lower quartile is $584, upper quartile is $921)
| This county: | $693 |
| State: | $757 |
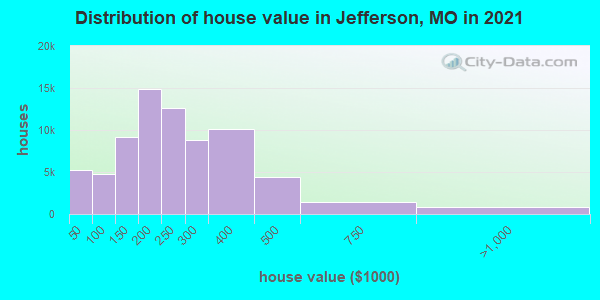
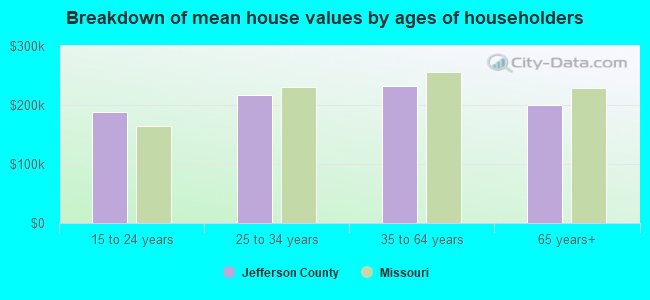
Estimated median house or condo value in 2022: $219,800 (it was $93,300 in 2000)
| Jefferson: | $219,800 |
| Missouri: | $221,200 |
Mean price in 2022:
Median monthly housing costs for homes and condos with a mortgage: $1,362Detached houses: $266,340
Here: $266,340 State: $278,068 Townhouses or other attached units: $218,771
Here: $218,771 State: $260,773 In 2-unit structures: $308,042
Here: $308,042 State: $172,667 In 3-to-4-unit structures: $137,125
Here: $137,125 State: $181,162 In 5-or-more-unit structures: $166,271
Here: $166,271 State: $263,082 Mobile homes: $95,722
Here: $95,722 State: $95,912
Median monthly housing costs for units without a mortgage: $459
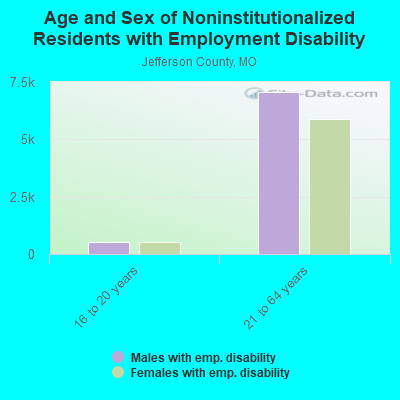
Institutionalized population: 1,460
Crime in 2021 (reported by the sheriff's office or county police, not the county total):
- Murders: 6
- Rapes: 38
- Robberies: 10
- Assaults: 471
- Burglaries: 389
- Thefts: 1216
- Auto thefts: 454
Crime in 2020 (reported by the sheriff's office or county police, not the county total):
- Murders: 3
- Rapes: 32
- Robberies: 17
- Assaults: 480
- Burglaries: 557
- Thefts: 1461
- Auto thefts: 479
Health of residents in Jefferson County based on CDC Behavioral Risk Factor Surveillance System Survey Questionnaires from 2013 to 2021:
General health status score of residents in this county from 1 (poor) to 5 (excellent) is 3.4. This is about average.71.9% of residents exercised in the past month. This is about average.
45.2% of residents smoked 100+ cigarettes in their lives. This is about average.
53.7% of adult residents drank alcohol in the past 30 days. This is less than average.
67.3% of residents visited a dentist within the past year. This is about average.
Average weight of males is 200 pounds. This is more than average.
Average weight of females is 167 pounds. This is more than average.
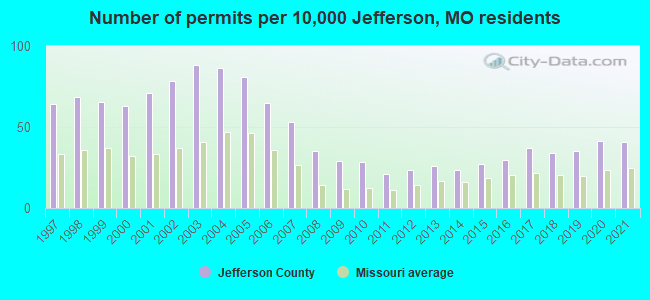
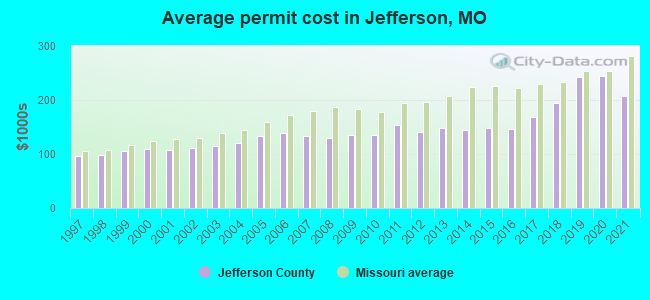
Single-family new house construction building permits:
- 2022: 706 buildings, average cost: $298,500
- 2021: 811 buildings, average cost: $207,200
- 2020: 817 buildings, average cost: $245,200
- 2019: 702 buildings, average cost: $241,500
- 2018: 675 buildings, average cost: $193,800
- 2017: 734 buildings, average cost: $167,500
- 2016: 592 buildings, average cost: $146,500
- 2015: 534 buildings, average cost: $147,900
- 2014: 467 buildings, average cost: $145,000
- 2013: 518 buildings, average cost: $147,600
- 2012: 468 buildings, average cost: $139,500
- 2011: 421 buildings, average cost: $153,200
- 2010: 567 buildings, average cost: $136,100
- 2009: 573 buildings, average cost: $136,300
- 2008: 701 buildings, average cost: $128,500
- 2007: 1049 buildings, average cost: $132,500
- 2006: 1288 buildings, average cost: $138,600
- 2005: 1607 buildings, average cost: $133,200
- 2004: 1717 buildings, average cost: $120,800
- 2003: 1745 buildings, average cost: $114,300
- 2002: 1548 buildings, average cost: $111,500
- 2001: 1403 buildings, average cost: $107,600
- 2000: 1242 buildings, average cost: $109,700
- 1999: 1296 buildings, average cost: $106,400
- 1998: 1357 buildings, average cost: $98,500
- 1997: 1273 buildings, average cost: $96,000
Median real estate property taxes paid for housing units with mortgages in 2022: $1,826 (0.8%)
Median real estate property taxes paid for housing units with no mortgage in 2022: $1,501 (0.8%)
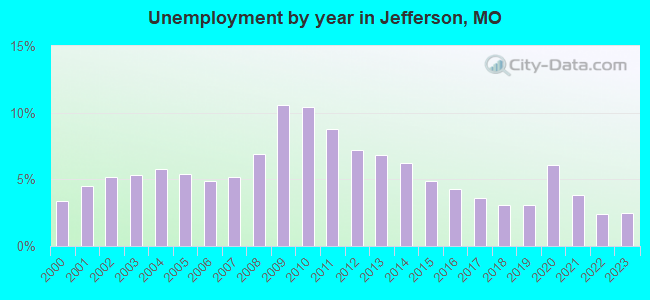
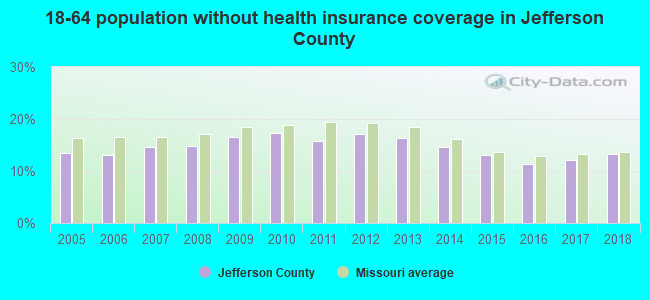
| Jefferson County: | 8.8% |
| Missouri: | 13.2% |
Median age of residents in 2022: 40.0 years old
(Males: 39.5 years old, Females: 40.8 years old)
(Median age for: White residents: 41.1 years old, Black residents: 36.1 years old, American Indian residents: 45.7 years old, Asian residents: 34.3 years old, Hispanic or Latino residents: 24.2 years old, Other race residents: 27.6 years old)
Area name: St. Louis, MO-IL HUD Metro FMR Area
Fair market rent in 2006 for a 1-bedroom apartment in Jefferson County is $526 a month.
Fair market rent for a 2-bedroom apartment is $654 a month.
Fair market rent for a 3-bedroom apartment is $842 a month.
Cities in this county include: Arnold, Festus, Murphy, De Soto, Barnhart, Imperial, Crystal City, High Ridge, Pevely, Herculaneum.
2023 air pollution in Jefferson County:
Ozone (1-hour): 0.043 ppm (standard limit: 0.12 ppm). Above U.S. average.
Particulate Matter (PM10) Annual: 15.4 µg/m3. Near U.S. average.
Particulate Matter (PM2.5) Annual: 8.9 µg/m3(standard limit: 15.0 µg/m3). Near U.S. average.
Sulfur Oxides Annual: 0.001 ppm (standard limit: 0.03 ppm). Near U.S. average.
Neighboring counties: Navajo County, Arizona  , Lincoln County, Nevada , Howard County, Maryland
  , Piute County, Utah , Rio Arriba County, New Mexico , Chariton County
  , Crittenden County, Kentucky
  , Essex County, Virginia , La Plata County, Colorado , Laclede County
  , Nowata County, Oklahoma , San Miguel County, Colorado , Ross County, Ohio , Smyth County, Virginia .
| Here: | 2.6% |
| Missouri: | 2.8% |
Current college students: 7,775
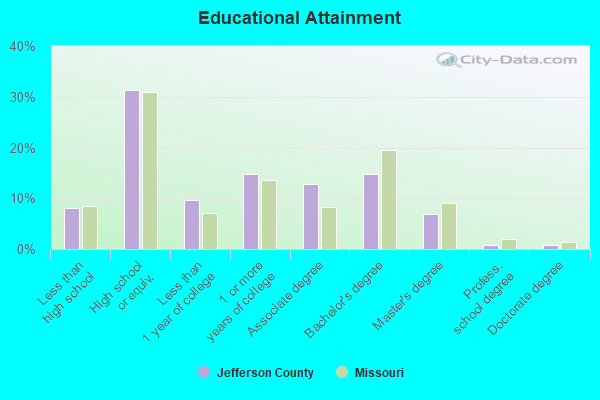
People 25 years of age or older with a high school degree or higher: 91.3%
People 25 years of age or older with a bachelor's degree or higher: 25.9%
Number of foreign born residents: 4,460 (77.7% naturalized citizens)
| Jefferson County: | 1.9% |
| Whole state: | 4.1% |
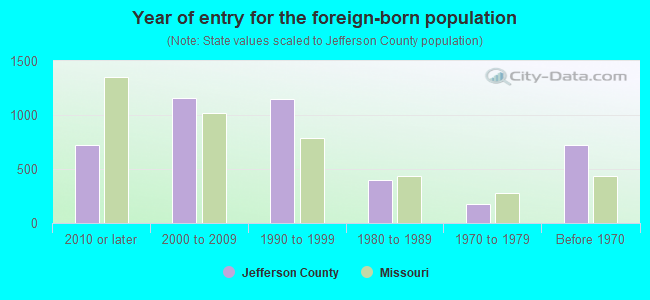
- Year of entry for the foreign-born population
- 8082010 or later
- 1,3902000 to 2009
- 1,0701990 to 1999
- 3941980 to 1989
- 1731970 to 1979
- 721Before 1970
Mean travel time to work (commute): minutes
Percentage of county residents living and working in this county: 96.1%
Housing units in structures:
- One, detached: 75,379
- One, attached: 2,141
- Two: 1,636
- 3 or 4: 1,981
- 5 to 9: 1,638
- 10 to 19: 1,817
- 20 to 49: 957
- 50 or more: 543
- Mobile homes: 7,991
Housing units in Jefferson County with a mortgage: 49,207 (3,436 second mortgage, 41 home equity loan, 2,625 both second mortgage and home equity loan)
Houses without a mortgage: 1,212
| Here: | 98.0% with mortgage |
| State: | 98.0% with mortgage |
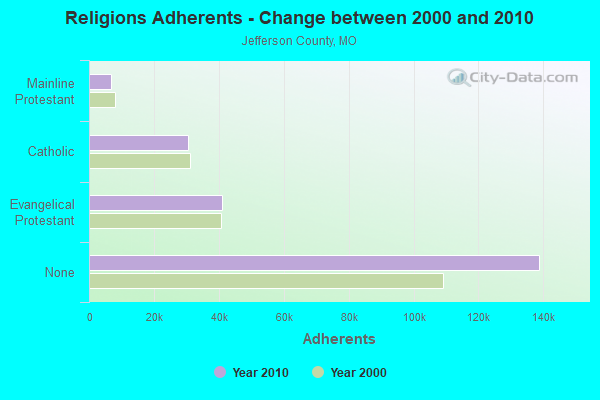
Religion statistics for Jefferson County
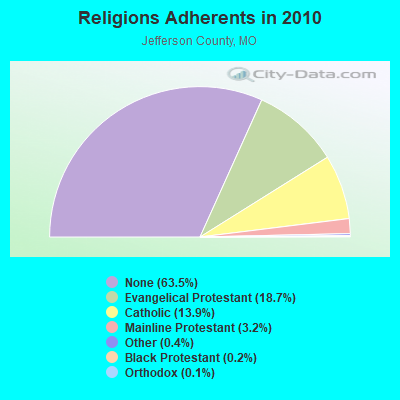
| Religion | Adherents | Congregations |
|---|---|---|
| Evangelical Protestant | 40,846 | 107 |
| Catholic | 30,495 | 11 |
| Mainline Protestant | 6,917 | 31 |
| Other | 925 | 9 |
| Black Protestant | 496 | 3 |
| Orthodox | 260 | 1 |
| None | 138,794 | - |
Source: Clifford Grammich, Kirk Hadaway, Richard Houseal, Dale E.Jones, Alexei Krindatch, Richie Stanley and Richard H.Taylor. 2012. 2010 U.S.Religion Census: Religious Congregations & Membership Study. Association of Statisticians of American Religious Bodies. Jones, Dale E., et al. 2002. Congregations and Membership in the United States 2000. Nashville, TN: Glenmary Research Center.
Food Environment Statistics:
| Jefferson County: | 1.07 / 10,000 pop. |
| State: | 1.88 / 10,000 pop. |
| Here: | 0.05 / 10,000 pop. |
| Missouri: | 0.18 / 10,000 pop. |
| This county: | 0.70 / 10,000 pop. |
| Missouri: | 0.60 / 10,000 pop. |
| Jefferson County: | 3.66 / 10,000 pop. |
| Missouri: | 4.34 / 10,000 pop. |
| This county: | 4.40 / 10,000 pop. |
| State: | 7.37 / 10,000 pop. |
| Jefferson County: | 9.1% |
| Missouri: | 8.8% |
| Jefferson County: | 29.5% |
| State: | 29.6% |
| Here: | 14.5% |
| State: | 13.5% |
Agriculture in Jefferson County:
Average size of farms: 163 acresAverage value of agricultural products sold per farm: $13,857
Average value of crops sold per acre for harvested cropland: $115.69
The value of nursery, greenhouse, floriculture, and sod as a percentage of the total market value of agricultural products sold: 9.41%
The value of livestock, poultry, and their products as a percentage of the total market value of agricultural products sold: 58.37%
Average total farm production expenses per farm: $13,902
Harvested cropland as a percentage of land in farms: 30.50%
Average market value of all machinery and equipment per farm: $28,577
The percentage of farms operated by a family or individual: 94.24%
Average age of principal farm operators: 56 years
Average number of cattle and calves per 100 acres of all land in farms: 10.86
Milk cows as a percentage of all cattle and calves: 3.59%
Corn for grain: 3402 harvested acres
All wheat for grain: 1677 harvested acres
Soybeans for beans: 6984 harvested acres
Vegetables: 77 harvested acres
Land in orchards: 89 acres
Earthquake activity:
Jefferson County-area historical earthquake activity is significantly above Missouri state average. It is 348% greater than the overall U.S. average.On 4/18/2008 at 09:36:59, a magnitude 5.4 (5.1 MB, 4.8 MS, 5.4 MW, 5.2 MW, Class: Moderate, Intensity: VI - VII) earthquake occurred 142.2 miles away from Jefferson County center
On 9/26/1990 at 13:18:51, a magnitude 5.0 (4.7 MB, 4.8 LG, 5.0 LG, Depth: 7.7 mi) earthquake occurred 93.7 miles away from the county center
On 4/18/2008 at 09:36:59, a magnitude 5.2 (5.2 MW, Depth: 8.9 mi) earthquake occurred 142.2 miles away from the county center
On 5/4/1991 at 01:18:54, a magnitude 5.0 (4.4 MB, 4.6 LG, 5.0 LG, Depth: 3.1 mi) earthquake occurred 124.8 miles away from the county center
On 6/10/1987 at 23:48:54, a magnitude 5.1 (4.9 MB, 4.4 MS, 4.6 MS, 5.1 LG) earthquake occurred 146.2 miles away from Jefferson County center
On 6/18/2002 at 17:37:15, a magnitude 5.0 (4.3 MB, 4.6 MW, 5.0 LG) earthquake occurred 149.4 miles away from the county center
Magnitude types: regional Lg-wave magnitude (LG), body-wave magnitude (MB), surface-wave magnitude (MS), moment magnitude (MW)
Most recent natural disasters:
- Missouri Covid-19 Pandemic, Incident Period: January 20, 2020, FEMA Id: 4490, Natural disaster type: Other
- Missouri Severe Storms, Tornadoes, And Flooding, Incident Period: April 29, 2019, FEMA Id: 4451, Natural disaster type: Storm, Tornado, Flood
- Missouri Severe Storms, Tornadoes, Straight-line Winds, And Flooding, Incident Period: April 28, 2017 - May 11, 2017, FEMA Id: 4317, Natural disaster type: Storm, Tornado, Flood, Wind
- Missouri Severe Storms, Tornadoes, Straight-line Winds, and Flooding, Incident Period: December 23, 2015 to January 09, 2016, Major Disaster (Presidential) Declared DR-4250: January 21, 2016, FEMA Id: 4250, Natural disaster type: Storm, Tornado, Flood, Wind
- Missouri Severe Storms, Tornadoes, Straight-line Winds, and Flooding, Incident Period: December 22, 2015 to January 09, 2016, Emergency Declared EM-3374: January 02, 2016, FEMA Id: 3374, Natural disaster type: Storm, Tornado, Flood, Wind
- Missouri Severe Storms, Tornadoes, Straight-line Winds, and Flooding, Incident Period: May 15, 2015 to July 27, 2015, Major Disaster (Presidential) Declared DR-4238: August 07, 2015, FEMA Id: 4238, Natural disaster type: Storm, Tornado, Flood, Wind
- Missouri Severe Winter Storm, Incident Period: January 31, 2011 to February 05, 2011, Emergency Declared EM-3317: February 03, 2011, FEMA Id: 3317, Natural disaster type: Winter Storm
- Missouri Severe Storms, Tornadoes, and Flooding, Incident Period: May 08, 2009 to May 16, 2009, Major Disaster (Presidential) Declared DR-1847: June 19, 2009, FEMA Id: 1847, Natural disaster type: Storm, Tornado, Flood
- Missouri Severe Winter Storm, Incident Period: January 26, 2009 to January 28, 2009, Emergency Declared EM-3303: January 30, 2009, FEMA Id: 3303, Natural disaster type: Winter Storm
- Missouri Severe Storms, Flooding, and a Tornado, Incident Period: September 11, 2008 to September 24, 2008, Major Disaster (Presidential) Declared DR-1809: November 13, 2008, FEMA Id: 1809, Natural disaster type: Storm, Tornado, Flood
- 17 other natural disasters have been reported since 1953.
The number of natural disasters in Jefferson County (27) is a lot greater than the US average (15).
Major Disasters (Presidential) Declared: 16
Emergencies Declared: 7
Causes of natural disasters: Storms: 19, Floods: 18, Tornadoes: 15, Winds: 4, Winter Storms: 3, Drought: 1, Flash Flood: 1, Heavy Rain: 1, Hurricane: 1, Other: 1 (Note: some incidents may be assigned to more than one category).
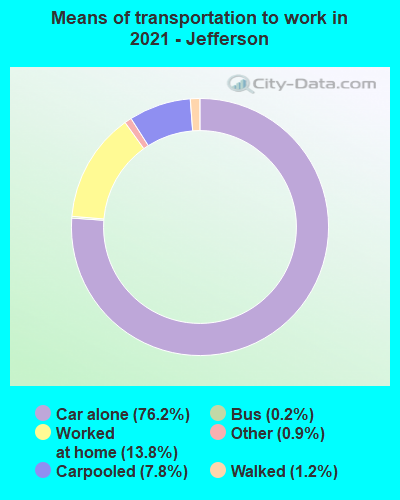
Means of transportation to work:
- Drove a car alone: 42,120 (70.8%)
- Carpooled: 4,641 (7.8%)
- Bus: 43 (0.1%)
- Taxicab, motorcycle, or other means: 510 (0.9%)
- Bicycle: 10 (0.0%)
- Walked: 703 (1.2%)
- Worked at home: 12,894 (21.7%)
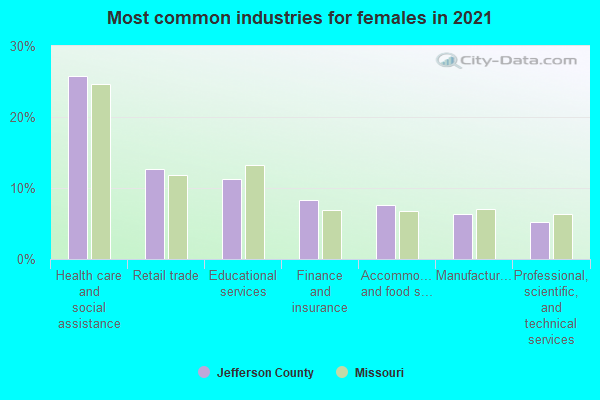
- Health care and social assistance (25%)
- Educational services (12%)
- Retail trade (8%)
- Professional, scientific, and technical services (7%)
- Finance and insurance (7%)
- Manufacturing (6%)
- Accommodation and food services (6%)
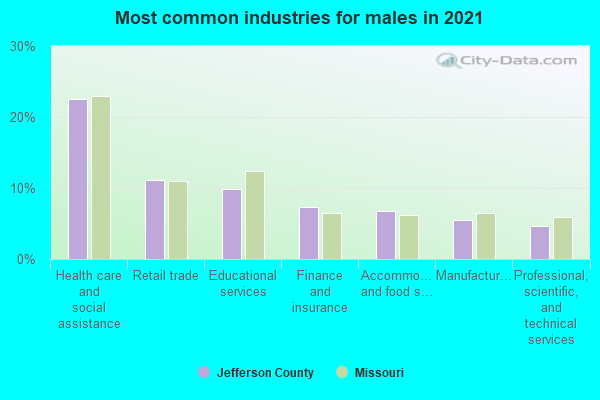
- Health care and social assistance (27%)
- Educational services (13%)
- Retail trade (9%)
- Professional, scientific, and technical services (8%)
- Finance and insurance (7%)
- Manufacturing (7%)
- Accommodation and food services (7%)
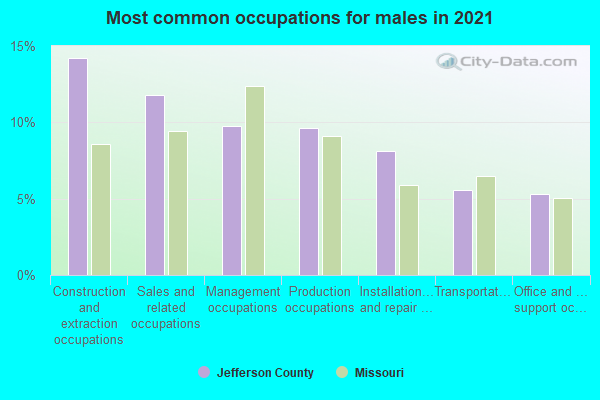
- Construction and extraction occupations (14%)
- Management occupations (13%)
- Installation, maintenance, and repair occupations (10%)
- Production occupations (10%)
- Sales and related occupations (8%)
- Transportation occupations (7%)
- Office and administrative support occupations (5%)
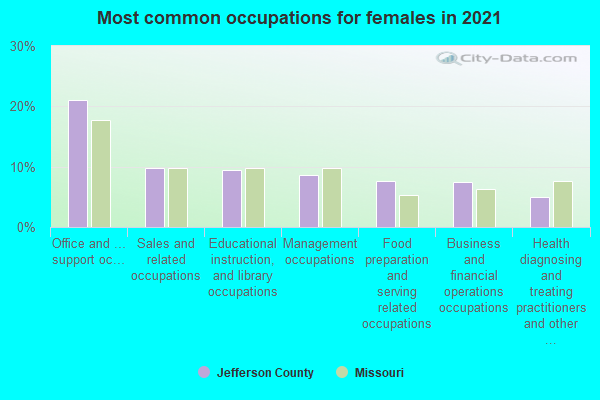
- Office and administrative support occupations (20%)
- Management occupations (9%)
- Educational instruction, and library occupations (9%)
- Healthcare support occupations (8%)
- Sales and related occupations (7%)
- Health diagnosing and treating practitioners and other technical occupations (7%)
- Business and financial operations occupations (7%)
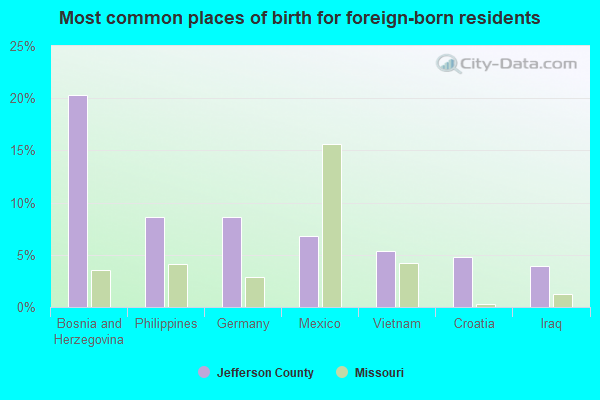
- Bosnia and Herzegovina (15%)
- Germany (9%)
- Philippines (7%)
- Mexico (6%)
- China, excluding Hong Kong and Taiwan (5%)
- Croatia (4%)
- Korea (4%)
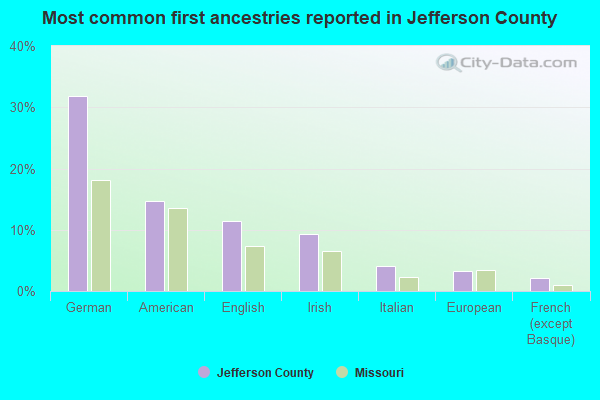
- German (30%)
- American (14%)
- English (11%)
- Irish (9%)
- Italian (5%)
- European (4%)
- French (except Basque) (2%)
People in group quarters in Jefferson County, Missouri in 2010:
- 1,155 people in nursing facilities/skilled-nursing facilities
- 254 people in local jails and other municipal confinement facilities
- 189 people in college/university student housing
- 143 people in residential treatment centers for adults
- 105 people in other noninstitutional facilities
- 68 people in group homes intended for adults
- 49 people in residential treatment centers for juveniles (non-correctional)
- 9 people in emergency and transitional shelters (with sleeping facilities) for people experiencing homelessness
- 9 people in workers' group living quarters and job corps centers
- 2 people in group homes for juveniles (non-correctional)
People in group quarters in Jefferson County, Missouri in 2000:
- 1,259 people in nursing homes
- 352 people in other noninstitutional group quarters
- 132 people in local jails and other confinement facilities (including police lockups)
- 108 people in other nonhousehold living situations
- 89 people in religious group quarters
- 31 people in training schools for juvenile delinquents
- 23 people in homes or halfway houses for drug/alcohol abuse
- 22 people in homes for the mentally ill
- 12 people in homes for the mentally retarded
- 2 people in hospitals/wards and hospices for chronically ill
- 2 people in other hospitals or wards for chronically ill
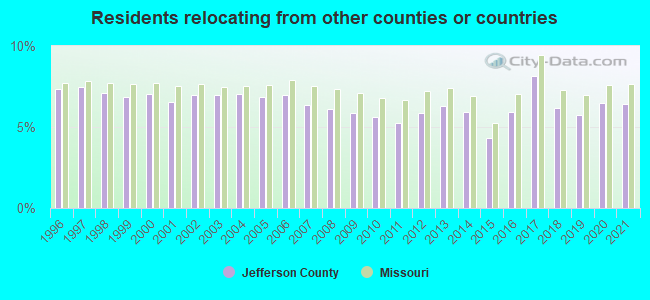
6.41% of this county's 2021 resident taxpayers lived in other counties in 2020 ($55,181 average adjusted gross income)
| Here: | 6.41% |
| Missouri average: | 7.67% |
10 or fewer of this county's residents moved from foreign countries.
4.88% relocated from other counties in Missouri ($40,885 average AGI)
1.53% relocated from other states ($14,296 average AGI)
Jefferson County: 1.53% Missouri average: 3.04%
Top counties from which taxpayers relocated into this county between 2020 and 2021:
| from St. Louis County, MO | |
| from St. Louis city, MO | |
| from St. Charles County, MO | |
| from Franklin County, MO | |
| from St. Francois County, MO | |
| from St. Clair County, IL | |
| from Ste. Genevieve County, MO |
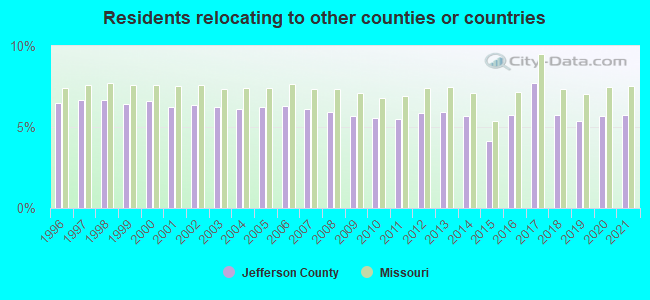
5.74% of this county's 2020 resident taxpayers moved to other counties in 2021 ($54,437 average adjusted gross income)
| Here: | 5.74% |
| Missouri average: | 7.51% |
10 or fewer of this county's residents moved to foreign countries.
4.37% relocated to other counties in Missouri ($39,807 average AGI)
1.37% relocated to other states ($14,631 average AGI)
Jefferson County: 1.37% Missouri average: 2.88%
Top counties to which taxpayers relocated from this county between 2020 and 2021:
| to St. Louis County, MO | |
| to St. Louis city, MO | |
| to St. Francois County, MO | |
| to Franklin County, MO | |
| to St. Charles County, MO | |
| to Ste. Genevieve County, MO | |
| to Washington County, MO |
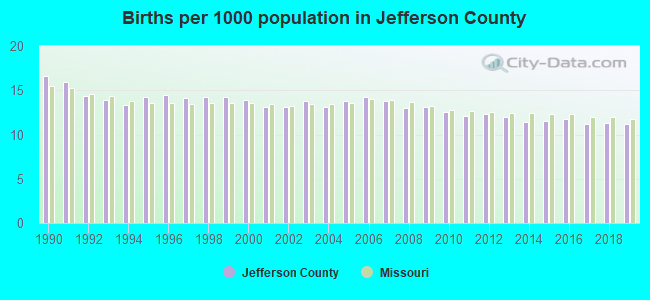
Births per 1000 population from 1990 to 1999: 14.5
Births per 1000 population from 2000 to 2009: 13.5
Births per 1000 population from 2010 to 2022: 9.8
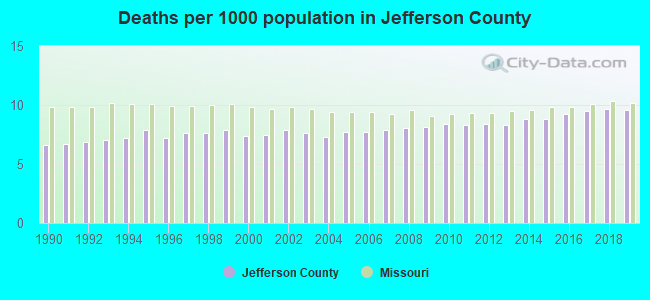
Deaths per 1000 population from 1990 to 1999: 7.3
Deaths per 1000 population from 2000 to 2009: 7.7
Deaths per 1000 population from 2010 to 2020: 9.1
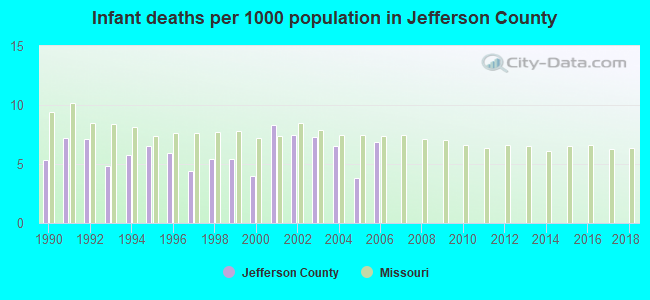
Infant deaths per 1000 live births from 1990 to 1999: 5.8
Infant deaths per 1000 live births from 2000 to 2006: 6.3
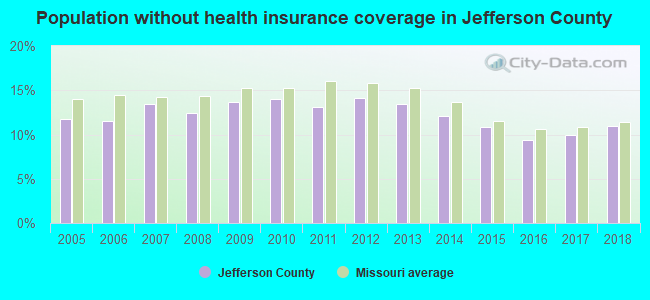
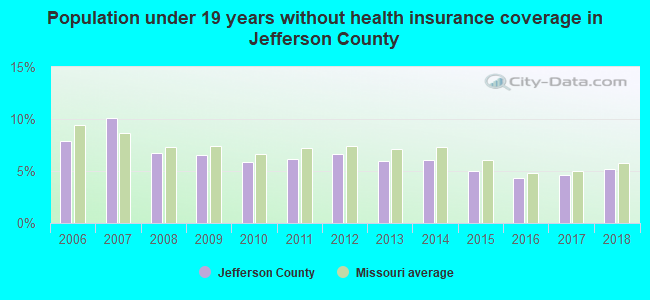
Persons under 19 years old without health insurance coverage in 2018: 5.2%
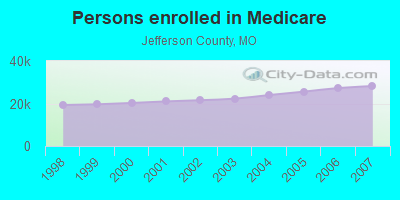
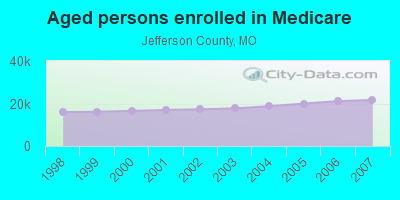
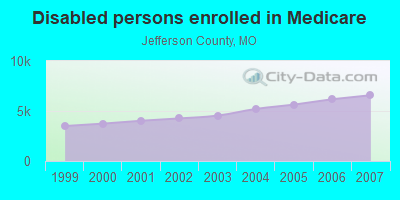
Persons enrolled in hospital insurance and/or supplemental medical insurance (Medicare) in July 1, 2007: 28,205 (21,625 aged, 6,580 disabled)
Children under 18 without health insurance coverage in 2007: 5,570 (10%)
Most common underlying causes of death in Jefferson County, Missouri in 1999 - 2019:
- Atherosclerotic heart disease (3,757)
- Bronchus or lung, unspecified - Malignant neoplasms (3,046)
- Acute myocardial infarction, unspecified (2,065)
- Chronic obstructive pulmonary disease, unspecified (1,828)
- Alzheimer disease, unspecified (1,080)
- Unspecified dementia (1,004)
- Stroke, not specified as haemorrhage or infarction (950)
- Congestive heart failure (890)
- Pneumonia, unspecified (727)
- Unspecified fall (593)
Population without health insurance coverage in 2000: 10%
Children under 18 without health insurance coverage in 2000: 7%
Short term general hospital admissions per 100,000 population in 2004: 4,438
Short term general hospital beds per 100,000 population in 2004: 108
Emergency room visits per 100,000 population in 2004: 14,675
General practice office based MDs per 100,000 population in 2005: 1,350
Medical specialist MDs per 100,000 population in 2005: 714
Dentists per 100,000 population in 1998: 2
Total births per 100,000 population, July 2005 - July 2006 : 23
Total deaths per 100,000 population, July 2005 - July 2006: 58
Limited-service eating places per 100,000 population in 2005 : 8
Beer, wine & liquor stores per 100,000 population in 2005: 1
Homicides per 1,000,000 population from 2000 to 2006: 24.3. This is less than state average.
Suicides per 1,000,000 population from 2000 to 2006: 132.7. This is more than state average.
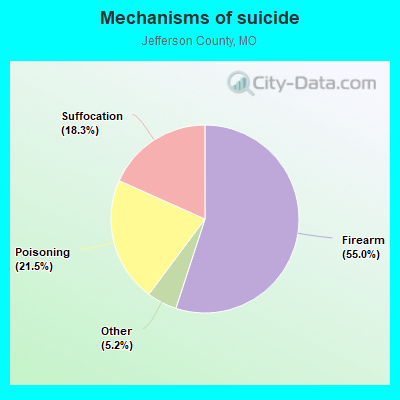
- Firearm - 73.0
- Poisoning - 28.5
- Suffocation - 24.3
- Other - 6.9
Household type by relationship:
Households: 229,336- Male householders: 43,417 (10,438 living alone), Female householders: 45,061 (12,320 living alone)
46,911 spouses (46,589 opposite-sex spouses), 6,599 unmarried partners, (6,445 opposite-sex unmarried partners), 67,239 children (60,062 natural, 1,573 adopted, 5,604 stepchildren), 6,245 grandchildren, 1,571 brothers or sisters, 2,942 parents, 821 foster children, 2,113 other relatives, 4,514 non-relatives
- In group quarters: 1,903
Size of family households: 28,018 2-persons, 12,470 3-persons, 11,283 4-persons, 4,752 5-persons, 2,589 6-persons, 660 7-or-more-persons.
Size of nonfamily households: 22,758 1-person, 5,739 2-persons, 164 3-persons, 45 4-persons.
34,373 married couples with children.
10,226 single-parent households (2,452 men, 7,774 women).
96.4% of residents of Jefferson speak English at home.
1.3% of residents speak Spanish at home (83% speak English very well, 8% speak English well, 7% speak English not well, 2% don't speak English at all).
1.6% of residents speak other Indo-European language at home (68% speak English very well, 24% speak English well, 6% speak English not well, 2% don't speak English at all).
0.5% of residents speak Asian or Pacific Island language at home (53% speak English very well, 30% speak English well, 10% speak English not well, 8% don't speak English at all).
0.2% of residents speak other language at home (79% speak English very well, 21% speak English well).
In fiscal year 2004:
Federal Government expenditure: $705,182,000 ($3,352 per capita)
Department of Defense expenditure: $36,425,000
Federal direct payments to individuals for retirement and disability: $394,017,000
Federal other direct payments to individuals: $166,196,000
Federal direct payments not to individuals: $609,000
Federal grants: $88,156,000
Federal procurement contracts: $34,350,000 ($23,807,000 Department of Defense)
Federal salaries and wages: $21,854,000 ($1,448,000 Department of Defense)
Federal Government direct loans: $1,818,000
Federal guaranteed/insured loans: $173,424,000
Federal Government insurance: $131,212,000
Population change from April 1, 2000 to July 1, 2005:
Births: 14,360| Here: | 67 per 1000 residents |
| State: | 69 per 1000 residents |
Deaths: 8,082
| Here: | 38 per 1000 residents |
| State: | 49 per 1000 residents |
Net international migration: +380
| Here: | +2 per 1000 residents |
| State: | +7 per 1000 residents |
Net internal migration: +9,190
| Here: | +43 per 1000 residents |
| State: | +5 per 1000 residents |
Total withdrawal of fresh water for public supply: 10.47 millions of gallons per day (88% from ground, 12% from surface)
| Here: | 6.1 |
| State: | 6.4 |
| Here: | 4.6 |
| State: | 4.4 |
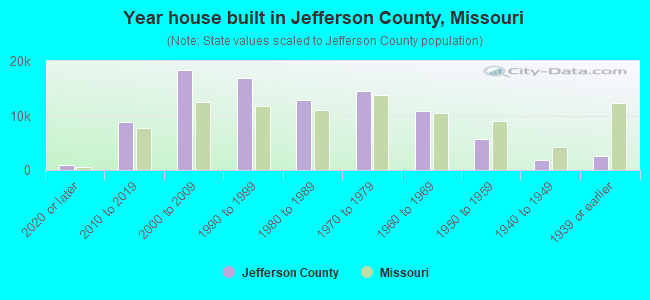
- Year house built in Jefferson County, Missouri
- 9932020 or later
- 8,5582010 to 2019
- 19,2502000 to 2009
- 13,0201990 to 1999
- 13,2741980 to 1989
- 13,5331970 to 1979
- 10,0771960 to 1969
- 9,5811950 to 1959
- 2,5441940 to 1949
- 3,2531939 or earlier
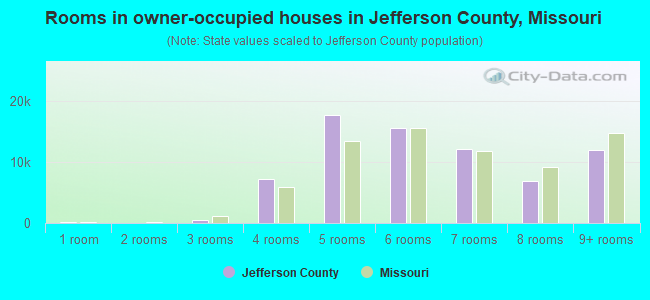
- Rooms in owner-occupied houses in Jefferson County, Missouri
- 1111 room
- 1032 rooms
- 6623 rooms
- 8,1084 rooms
- 16,8835 rooms
- 17,9996 rooms
- 10,7507 rooms
- 8,1638 rooms
- 11,1579+ rooms
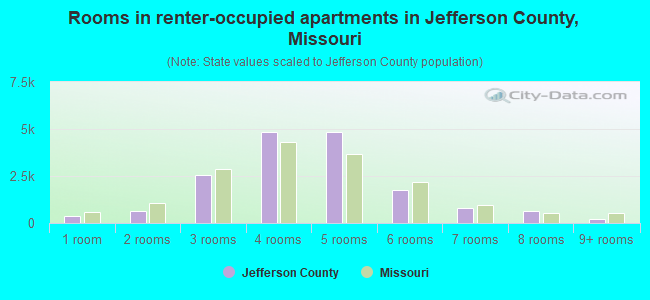
- Rooms in renter-occupied apartments in Jefferson County, Missouri
- 6391 room
- 3742 rooms
- 1,5533 rooms
- 4,4824 rooms
- 4,0805 rooms
- 2,0626 rooms
- 1827 rooms
- 5628 rooms
- 6089+ rooms
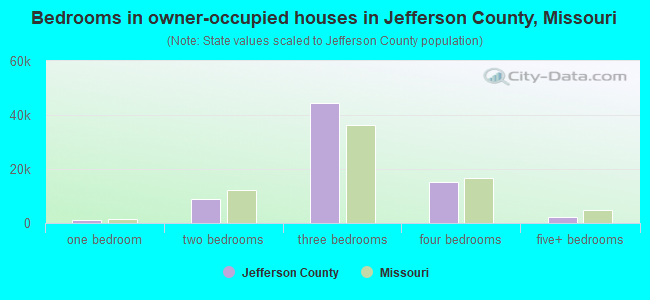
- Bedrooms in owner-occupied houses in Jefferson County, Missouri
- 162no bedroom
- 7931 bedroom
- 11,1752 bedrooms
- 44,0163 bedrooms
- 14,7304 bedrooms
- 3,0605+ bedrooms
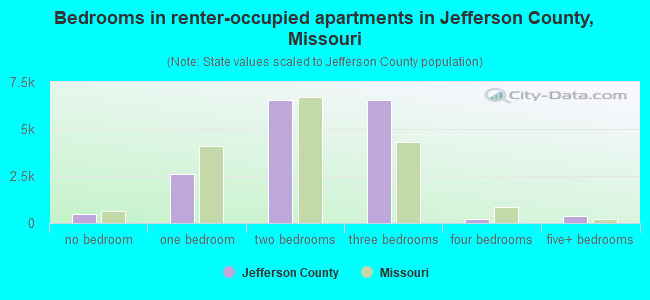
- Bedrooms in renter-occupied apartments in Jefferson County, Missouri
- 639no bedroom
- 2,0811 bedroom
- 6,8492 bedrooms
- 4,2193 bedrooms
- 5504 bedrooms
- 2045+ bedrooms
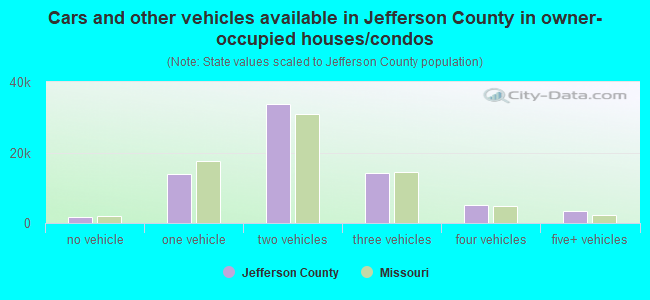
- Cars and other vehicles available in Jefferson County in owner-occupied houses/condos
- 1,162no vehicle
- 15,2561 vehicle
- 34,2092 vehicles
- 15,3183 vehicles
- 5,5634 vehicles
- 2,4285+ vehicles
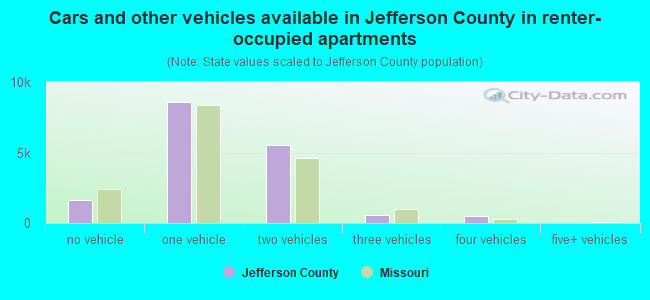
- Cars and other vehicles available in Jefferson County in renter-occupied apartments
- 1,917no vehicle
- 7,2031 vehicle
- 4,4072 vehicles
- 5983 vehicles
- 4174 vehicles
- 05+ vehicles
89.0% of Jefferson County residents lived in the same house 1 years ago.
Out of people who lived in different houses, 37% lived in this county.
Out of people who lived in different counties, 78% lived in Missouri.
| Jefferson County: | 89.0% |
| State average: | 87.1% |
Place of birth for U.S.-born residents:
- This state: 182,691
- Other state: 41,319
- Northeast: 3,237
- Midwest: 19,082
- South: 11,413
- West: 7,587

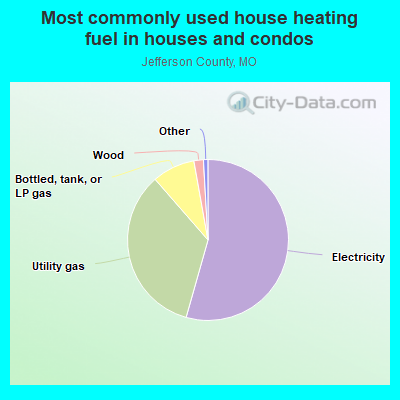
- 53.7%Electricity
- 34.8%Utility gas
- 8.5%Bottled, tank, or LP gas
- 1.9%Wood
- 0.6%Fuel oil, kerosene, etc.
- 0.3%No fuel used
- 0.1%Other fuel
- 0.1%Solar energy
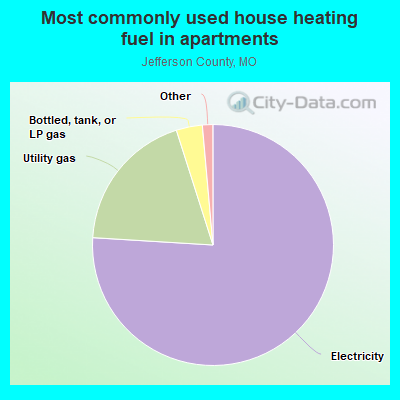
- 74.8%Electricity
- 19.8%Utility gas
- 3.8%Bottled, tank, or LP gas
- 0.7%Wood
- 0.6%No fuel used
- 0.2%Fuel oil, kerosene, etc.
- 0.1%Other fuel
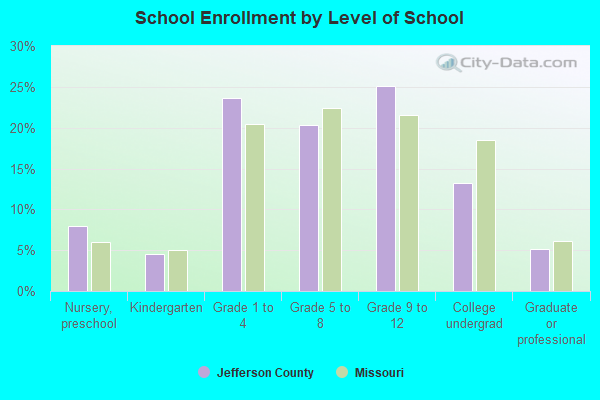
Private vs. public school enrollment:
| Here: | 14.8% |
| Missouri: | 15.4% |
| Here: | 17.0% |
| Missouri: | 13.9% |
| Here: | 22.5% |
| Missouri: | 22.6% |

Jefferson County government finances - Expenditure in 2018:
- Bond Funds - Cash and Securities: $5,547,000
Cash and Securities: $4,551,000
- Charges - Sewerage: $10,117,000
Other: $2,569,000
Parks and Recreation: $1,847,000
Air Transportation: $181,000
Parks and Recreation: $135,000
- Construction - Regular Highways: $8,850,000
General - Other: $5,581,000
Air Transportation: $5,391,000
Sewerage: $4,375,000
General - Other: $1,365,000
Parks and Recreation: $489,000
- Current Operations - Police Protection: $20,975,000
Police Protection: $11,073,000
Regular Highways: $10,014,000
Local Fire Protection: $7,543,000
Judicial and Legal Services: $7,170,000
Parks and Recreation: $6,272,000
Sewerage: $6,072,000
Regular Highways: $5,770,000
Central Staff Services: $5,362,000
General - Other: $5,349,000
Central Staff Services: $4,069,000
Financial Administration: $3,226,000
Health - Other: $3,100,000
Transit Utilities: $2,375,000
General Public Buildings: $1,765,000
General - Other: $1,710,000
Financial Administration: $964,000
Parks and Recreation: $851,000
Housing and Community Development: $823,000
Protective Inspection and Regulation - Other: $663,000
Judicial and Legal Services: $645,000
Protective Inspection and Regulation - Other: $627,000
Natural Resources - Other: $539,000
Air Transportation: $452,000
Solid Waste Management: $207,000
Correctional Institutions: $58,000
Miscellaneous Commercial Activities - Other: $5,000
- General - Interest on Debt: $2,062,000
Interest on Debt: $510,000
- Long Term Debt - Beginning Outstanding - Public Debt for Private Purpose: $57,187,000
Outstanding Nonguaranteed - Industrial Revenue: $53,212,000
Beginning Outstanding - Unspecified Public Purpose: $51,944,000
Outstanding Unspecified Public Purpose: $48,960,000
Outstanding Nonguaranteed - Industrial Revenue: $24,709,000
Beginning Outstanding - Public Debt for Private Purpose: $24,709,000
Beginning Outstanding - Unspecified Public Purpose: $16,744,000
Outstanding Unspecified Public Purpose: $14,820,000
Retired Nonguaranteed - Public Debt for Private Purpose: $3,975,000
Retired Unspecified Public Purpose: $2,984,000
Retired Unspecified Public Purpose: $1,924,000
- Miscellaneous - Fines and Forfeits: $1,240,000
Interest Earnings: $1,003,000
Interest Earnings: $515,000
General Revenue - Other: $471,000
Donations From Private Sources: $214,000
General Revenue - Other: $107,000
Sale of Property: $94,000
Sale of Property: $91,000
- Other Capital Outlay - Police Protection: $1,787,000
Regular Highways: $1,588,000
General - Other: $822,000
General - Other: $327,000
Parks and Recreation: $138,000
Financial Administration: $84,000
- Other Funds - Cash and Securities: $44,414,000
Cash and Securities: $40,127,000
- Revenue - Transit Utilities: $255,000
- Sinking Funds - Cash and Securities: $53,764,000
Cash and Securities: $25,169,000
- State Intergovernmental - General Local Government Support: $3,464,000
Other: $3,448,000
Highways: $1,241,000
General Local Government Support: $1,239,000
Transit Utilities: $1,086,000
Other: $1,082,000
- Tax - General Sales and Gross Receipts: $33,714,000
General Sales and Gross Receipts: $24,076,000
Property: $18,973,000
Other License: $10,804,000
Public Utilities Sales: $7,763,000
Property: $5,599,000
Other: $4,399,000
Other License: $810,000
- Total Salaries and Wages: $25,363,000
Jefferson County government finances - Revenue in 2018:
- Bond Funds - Cash and Securities: $5,547,000
Cash and Securities: $4,551,000
- Charges - Sewerage: $10,117,000
Other: $2,569,000
Parks and Recreation: $1,847,000
Air Transportation: $181,000
Parks and Recreation: $135,000
- Construction - Regular Highways: $8,850,000
General - Other: $5,581,000
Air Transportation: $5,391,000
Sewerage: $4,375,000
General - Other: $1,365,000
Parks and Recreation: $489,000
- Current Operations - Police Protection: $20,975,000
Police Protection: $11,073,000
Regular Highways: $10,014,000
Local Fire Protection: $7,543,000
Judicial and Legal Services: $7,170,000
Parks and Recreation: $6,272,000
Sewerage: $6,072,000
Regular Highways: $5,770,000
Central Staff Services: $5,362,000
General - Other: $5,349,000
Central Staff Services: $4,069,000
Financial Administration: $3,226,000
Health - Other: $3,100,000
Transit Utilities: $2,375,000
General Public Buildings: $1,765,000
General - Other: $1,710,000
Financial Administration: $964,000
Parks and Recreation: $851,000
Housing and Community Development: $823,000
Protective Inspection and Regulation - Other: $663,000
Judicial and Legal Services: $645,000
Protective Inspection and Regulation - Other: $627,000
Natural Resources - Other: $539,000
Air Transportation: $452,000
Solid Waste Management: $207,000
Correctional Institutions: $58,000
Miscellaneous Commercial Activities - Other: $5,000
- General - Interest on Debt: $2,062,000
Interest on Debt: $510,000
- Long Term Debt - Beginning Outstanding - Public Debt for Private Purpose: $57,187,000
Outstanding Nonguaranteed - Industrial Revenue: $53,212,000
Beginning Outstanding - Unspecified Public Purpose: $51,944,000
Outstanding Unspecified Public Purpose: $48,960,000
Outstanding Nonguaranteed - Industrial Revenue: $24,709,000
Beginning Outstanding - Public Debt for Private Purpose: $24,709,000
Beginning Outstanding - Unspecified Public Purpose: $16,744,000
Outstanding Unspecified Public Purpose: $14,820,000
Retired Nonguaranteed - Public Debt for Private Purpose: $3,975,000
Retired Unspecified Public Purpose: $2,984,000
Retired Unspecified Public Purpose: $1,924,000
- Miscellaneous - Fines and Forfeits: $1,240,000
Interest Earnings: $1,003,000
Interest Earnings: $515,000
General Revenue - Other: $471,000
Donations From Private Sources: $214,000
General Revenue - Other: $107,000
Sale of Property: $94,000
Sale of Property: $91,000
- Other Capital Outlay - Police Protection: $1,787,000
Regular Highways: $1,588,000
General - Other: $822,000
General - Other: $327,000
Parks and Recreation: $138,000
Financial Administration: $84,000
- Other Funds - Cash and Securities: $44,414,000
Cash and Securities: $40,127,000
- Revenue - Transit Utilities: $255,000
- Sinking Funds - Cash and Securities: $53,764,000
Cash and Securities: $25,169,000
- State Intergovernmental - General Local Government Support: $3,464,000
Other: $3,448,000
Highways: $1,241,000
General Local Government Support: $1,239,000
Transit Utilities: $1,086,000
Other: $1,082,000
- Tax - General Sales and Gross Receipts: $33,714,000
General Sales and Gross Receipts: $24,076,000
Property: $18,973,000
Other License: $10,804,000
Public Utilities Sales: $7,763,000
Property: $5,599,000
Other: $4,399,000
Other License: $810,000
- Total Salaries and Wages: $25,363,000
Jefferson County government finances - Debt in 2018:
- Bond Funds - Cash and Securities: $5,547,000
Cash and Securities: $4,551,000
- Charges - Sewerage: $10,117,000
Other: $2,569,000
Parks and Recreation: $1,847,000
Air Transportation: $181,000
Parks and Recreation: $135,000
- Construction - Regular Highways: $8,850,000
General - Other: $5,581,000
Air Transportation: $5,391,000
Sewerage: $4,375,000
General - Other: $1,365,000
Parks and Recreation: $489,000
- Current Operations - Police Protection: $20,975,000
Police Protection: $11,073,000
Regular Highways: $10,014,000
Local Fire Protection: $7,543,000
Judicial and Legal Services: $7,170,000
Parks and Recreation: $6,272,000
Sewerage: $6,072,000
Regular Highways: $5,770,000
Central Staff Services: $5,362,000
General - Other: $5,349,000
Central Staff Services: $4,069,000
Financial Administration: $3,226,000
Health - Other: $3,100,000
Transit Utilities: $2,375,000
General Public Buildings: $1,765,000
General - Other: $1,710,000
Financial Administration: $964,000
Parks and Recreation: $851,000
Housing and Community Development: $823,000
Protective Inspection and Regulation - Other: $663,000
Judicial and Legal Services: $645,000
Protective Inspection and Regulation - Other: $627,000
Natural Resources - Other: $539,000
Air Transportation: $452,000
Solid Waste Management: $207,000
Correctional Institutions: $58,000
Miscellaneous Commercial Activities - Other: $5,000
- General - Interest on Debt: $2,062,000
Interest on Debt: $510,000
- Long Term Debt - Beginning Outstanding - Public Debt for Private Purpose: $57,187,000
Outstanding Nonguaranteed - Industrial Revenue: $53,212,000
Beginning Outstanding - Unspecified Public Purpose: $51,944,000
Outstanding Unspecified Public Purpose: $48,960,000
Outstanding Nonguaranteed - Industrial Revenue: $24,709,000
Beginning Outstanding - Public Debt for Private Purpose: $24,709,000
Beginning Outstanding - Unspecified Public Purpose: $16,744,000
Outstanding Unspecified Public Purpose: $14,820,000
Retired Nonguaranteed - Public Debt for Private Purpose: $3,975,000
Retired Unspecified Public Purpose: $2,984,000
Retired Unspecified Public Purpose: $1,924,000
- Miscellaneous - Fines and Forfeits: $1,240,000
Interest Earnings: $1,003,000
Interest Earnings: $515,000
General Revenue - Other: $471,000
Donations From Private Sources: $214,000
General Revenue - Other: $107,000
Sale of Property: $94,000
Sale of Property: $91,000
- Other Capital Outlay - Police Protection: $1,787,000
Regular Highways: $1,588,000
General - Other: $822,000
General - Other: $327,000
Parks and Recreation: $138,000
Financial Administration: $84,000
- Other Funds - Cash and Securities: $44,414,000
Cash and Securities: $40,127,000
- Revenue - Transit Utilities: $255,000
- Sinking Funds - Cash and Securities: $53,764,000
Cash and Securities: $25,169,000
- State Intergovernmental - General Local Government Support: $3,464,000
Other: $3,448,000
Highways: $1,241,000
General Local Government Support: $1,239,000
Transit Utilities: $1,086,000
Other: $1,082,000
- Tax - General Sales and Gross Receipts: $33,714,000
General Sales and Gross Receipts: $24,076,000
Property: $18,973,000
Other License: $10,804,000
Public Utilities Sales: $7,763,000
Property: $5,599,000
Other: $4,399,000
Other License: $810,000
- Total Salaries and Wages: $25,363,000
Jefferson County government finances - Cash and Securities in 2018:
- Bond Funds - Cash and Securities: $5,547,000
Cash and Securities: $4,551,000
- Charges - Sewerage: $10,117,000
Other: $2,569,000
Parks and Recreation: $1,847,000
Air Transportation: $181,000
Parks and Recreation: $135,000
- Construction - Regular Highways: $8,850,000
General - Other: $5,581,000
Air Transportation: $5,391,000
Sewerage: $4,375,000
General - Other: $1,365,000
Parks and Recreation: $489,000
- Current Operations - Police Protection: $20,975,000
Police Protection: $11,073,000
Regular Highways: $10,014,000
Local Fire Protection: $7,543,000
Judicial and Legal Services: $7,170,000
Parks and Recreation: $6,272,000
Sewerage: $6,072,000
Regular Highways: $5,770,000
Central Staff Services: $5,362,000
General - Other: $5,349,000
Central Staff Services: $4,069,000
Financial Administration: $3,226,000
Health - Other: $3,100,000
Transit Utilities: $2,375,000
General Public Buildings: $1,765,000
General - Other: $1,710,000
Financial Administration: $964,000
Parks and Recreation: $851,000
Housing and Community Development: $823,000
Protective Inspection and Regulation - Other: $663,000
Judicial and Legal Services: $645,000
Protective Inspection and Regulation - Other: $627,000
Natural Resources - Other: $539,000
Air Transportation: $452,000
Solid Waste Management: $207,000
Correctional Institutions: $58,000
Miscellaneous Commercial Activities - Other: $5,000
- General - Interest on Debt: $2,062,000
Interest on Debt: $510,000
- Long Term Debt - Beginning Outstanding - Public Debt for Private Purpose: $57,187,000
Outstanding Nonguaranteed - Industrial Revenue: $53,212,000
Beginning Outstanding - Unspecified Public Purpose: $51,944,000
Outstanding Unspecified Public Purpose: $48,960,000
Outstanding Nonguaranteed - Industrial Revenue: $24,709,000
Beginning Outstanding - Public Debt for Private Purpose: $24,709,000
Beginning Outstanding - Unspecified Public Purpose: $16,744,000
Outstanding Unspecified Public Purpose: $14,820,000
Retired Nonguaranteed - Public Debt for Private Purpose: $3,975,000
Retired Unspecified Public Purpose: $2,984,000
Retired Unspecified Public Purpose: $1,924,000
- Miscellaneous - Fines and Forfeits: $1,240,000
Interest Earnings: $1,003,000
Interest Earnings: $515,000
General Revenue - Other: $471,000
Donations From Private Sources: $214,000
General Revenue - Other: $107,000
Sale of Property: $94,000
Sale of Property: $91,000
- Other Capital Outlay - Police Protection: $1,787,000
Regular Highways: $1,588,000
General - Other: $822,000
General - Other: $327,000
Parks and Recreation: $138,000
Financial Administration: $84,000
- Other Funds - Cash and Securities: $44,414,000
Cash and Securities: $40,127,000
- Revenue - Transit Utilities: $255,000
- Sinking Funds - Cash and Securities: $53,764,000
Cash and Securities: $25,169,000
- State Intergovernmental - General Local Government Support: $3,464,000
Other: $3,448,000
Highways: $1,241,000
General Local Government Support: $1,239,000
Transit Utilities: $1,086,000
Other: $1,082,000
- Tax - General Sales and Gross Receipts: $33,714,000
General Sales and Gross Receipts: $24,076,000
Property: $18,973,000
Other License: $10,804,000
Public Utilities Sales: $7,763,000
Property: $5,599,000
Other: $4,399,000
Other License: $810,000
- Total Salaries and Wages: $25,363,000
Supplemental Security Income (SSI) in 2006:
- Total number of recipients: 2,519
- Number of aged recipients: 112
- Number of blind and disabled recipients: 2,407
- Number of recipients under 18: 388
- Number of recipients between 18 and 64: 1,866
- Number of recipients older than 64: 265
- Number of recipients also receiving OASDI: 909
- Amount of payments (thousands of dollars): 1,131
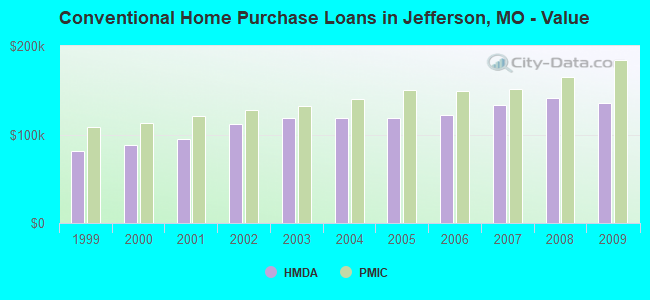
| Home Mortgage Disclosure Act Aggregated Statistics For Year 2009 (Based on 32 full tracts) | ||||||||||||||
| A) FHA, FSA/RHS & VA Home Purchase Loans | B) Conventional Home Purchase Loans | C) Refinancings | D) Home Improvement Loans | E) Loans on Dwellings For 5+ Families | F) Non-occupant Loans on < 5 Family Dwellings (A B C & D) | G) Loans On Manufactured Home Dwelling (A B C & D) | ||||||||
|---|---|---|---|---|---|---|---|---|---|---|---|---|---|---|
| Number | Average Value | Number | Average Value | Number | Average Value | Number | Average Value | Number | Average Value | Number | Average Value | Number | Average Value | |
| LOANS ORIGINATED | 1,326 | $143,255 | 919 | $136,014 | 7,446 | $152,865 | 279 | $56,939 | 10 | $332,200 | 320 | $101,053 | 173 | $75,919 |
| APPLICATIONS APPROVED, NOT ACCEPTED | 47 | $127,702 | 82 | $127,537 | 662 | $155,356 | 42 | $34,190 | 2 | $218,000 | 24 | $132,500 | 33 | $69,455 |
| APPLICATIONS DENIED | 150 | $129,793 | 193 | $101,617 | 2,242 | $153,935 | 264 | $35,591 | 0 | $0 | 87 | $98,747 | 138 | $63,638 |
| APPLICATIONS WITHDRAWN | 154 | $131,799 | 113 | $126,257 | 1,482 | $156,395 | 59 | $81,661 | 1 | $255,000 | 44 | $100,068 | 22 | $88,909 |
| FILES CLOSED FOR INCOMPLETENESS | 22 | $126,045 | 20 | $132,000 | 411 | $150,509 | 23 | $61,957 | 0 | $0 | 15 | $136,533 | 10 | $72,000 |
| Private Mortgage Insurance Companies Aggregated Statistics For Year 2009 (Based on 32 full tracts) | ||||||||
| A) Conventional Home Purchase Loans | B) Refinancings | C) Non-occupant Loans on < 5 Family Dwellings (A & B) | D) Loans On Manufactured Home Dwelling (A & B) | |||||
|---|---|---|---|---|---|---|---|---|
| Number | Average Value | Number | Average Value | Number | Average Value | Number | Average Value | |
| LOANS ORIGINATED | 168 | $184,685 | 317 | $185,347 | 2 | $111,000 | 0 | $0 |
| APPLICATIONS APPROVED, NOT ACCEPTED | 73 | $171,959 | 130 | $197,585 | 1 | $116,000 | 0 | $0 |
| APPLICATIONS DENIED | 27 | $184,333 | 73 | $197,370 | 1 | $179,000 | 1 | $124,000 |
| APPLICATIONS WITHDRAWN | 12 | $173,333 | 30 | $179,933 | 0 | $0 | 0 | $0 |
| FILES CLOSED FOR INCOMPLETENESS | 3 | $121,000 | 15 | $187,667 | 1 | $171,000 | 0 | $0 |

| Most common first names in Jefferson County, MO among deceased individuals | ||
| Name | Count | Lived (average) |
|---|---|---|
| William | 982 | 73.4 years |
| Mary | 851 | 77.6 years |
| John | 848 | 73.3 years |
| James | 737 | 68.9 years |
| Robert | 683 | 68.3 years |
| Charles | 603 | 73.3 years |
| George | 484 | 74.9 years |
| Joseph | 450 | 72.8 years |
| Dorothy | 412 | 75.9 years |
| Edward | 368 | 74.0 years |
| Most common last names in Jefferson County, MO among deceased individuals | ||
| Last name | Count | Lived (average) |
|---|---|---|
| Smith | 267 | 73.1 years |
| Williams | 234 | 73.0 years |
| Miller | 209 | 76.0 years |
| Johnson | 184 | 72.1 years |
| Brown | 176 | 73.1 years |
| Davis | 159 | 71.9 years |
| Jones | 154 | 72.6 years |
| Wilson | 154 | 72.1 years |
| Boyer | 153 | 72.7 years |
| White | 119 | 73.4 years |
| Businesses in Jefferson County, MO | ||||
| Name | Count | Name | Count | |
|---|---|---|---|---|
| 24 Hour Fitness | 1 | Maurices | 2 | |
| 7-Eleven | 4 | McDonald's | 13 | |
| ALDI | 1 | Motel 6 | 2 | |
| AT&T | 7 | Motherhood Maternity | 1 | |
| Ace Hardware | 2 | New Balance | 2 | |
| Advance Auto Parts | 3 | Nike | 6 | |
| Applebee's | 4 | Office Depot | 1 | |
| Arby's | 4 | OfficeMax | 2 | |
| AutoZone | 8 | Old Navy | 1 | |
| Barnes & Noble | 1 | Olive Garden | 1 | |
| Best Western | 1 | Panda Express | 1 | |
| Blockbuster | 5 | Panera Bread | 4 | |
| Burger King | 5 | Papa John's Pizza | 3 | |
| Chevrolet | 2 | Payless | 3 | |
| Chick-Fil-A | 1 | Penske | 2 | |
| Circle K | 15 | PetSmart | 1 | |
| Cold Stone Creamery | 2 | Pier 1 Imports | 1 | |
| Comfort Inn | 2 | Pizza Hut | 6 | |
| Cracker Barrel | 2 | Qdoba Mexican Grill | 2 | |
| Cricket Wireless | 4 | Quiznos | 1 | |
| Curves | 2 | RadioShack | 5 | |
| DHL | 1 | Red Robin | 1 | |
| Dairy Queen | 7 | Ruby Tuesday | 2 | |
| Decora Cabinetry | 7 | Rue21 | 1 | |
| Dennys | 3 | Ryan's Grill | 1 | |
| Domino's Pizza | 5 | Ryder Rental & Truck Leasing | 1 | |
| Dressbarn | 1 | SONIC Drive-In | 6 | |
| Famous Footwear | 3 | Sears | 6 | |
| Fashion Bug | 3 | Sephora | 1 | |
| FedEx | 19 | Shoe Carnival | 1 | |
| Firestone Complete Auto Care | 1 | Sprint Nextel | 4 | |
| Ford | 2 | Starbucks | 1 | |
| GNC | 4 | Steak 'n Shake | 5 | |
| GameStop | 2 | Subway | 10 | |
| Goodwill | 2 | Super 8 | 4 | |
| H&R Block | 11 | T-Mobile | 12 | |
| Hardee's | 5 | T.J.Maxx | 1 | |
| Hobby Lobby | 1 | Taco Bell | 6 | |
| Holiday Inn | 3 | Target | 2 | |
| Home Depot | 2 | The Room Place | 1 | |
| IHOP | 1 | Toyota | 1 | |
| JCPenney | 1 | True Value | 2 | |
| Jack In The Box | 5 | U-Haul | 23 | |
| Johnny Rockets | 1 | U.S. Cellular | 3 | |
| KFC | 4 | UPS | 35 | |
| Kmart | 2 | Vans | 1 | |
| Kohl's | 2 | Verizon Wireless | 1 | |
| La-Z-Boy | 2 | Waffle House | 2 | |
| Lane Furniture | 3 | Walgreens | 10 | |
| Little Caesars Pizza | 2 | Walmart | 6 | |
| Long John Silver's | 1 | Wendy's | 2 | |
| Lowe's | 3 | White Castle | 5 | |
| Marriott | 2 | YMCA | 1 | |
| MasterBrand Cabinets | 24 | |||
Jefferson County on our top lists:
- #35 on the list of "Top 101 counties with the lowest percentage of residents relocating from foreign countries between 2010 and 2011"
- #49 on the list of "Top 101 counties with the lowest percentage of residents relocating from foreign countries between 2010 and 2011 (pop. 50,000+)"
- #53 on the list of "Top 101 counties with the largest increase in the number of deaths per 1000 residents 2000-2006 to 2007-2013 (pop. 50,000+)"
- #63 on the list of "Top 101 counties with the lowest percentage of residents relocating to foreign countries in 2011"
- #73 on the list of "Top 101 counties with the lowest surface withdrawal of fresh water for public supply (pop. 50,000+)"
- #74 on the list of "Top 101 counties with the highest Ozone (1-hour) air pollution readings in 2012 (ppm)"
- #87 on the list of "Top 101 counties with the lowest percentage of residents relocating to foreign countries in 2011 (pop. 50,000+)"