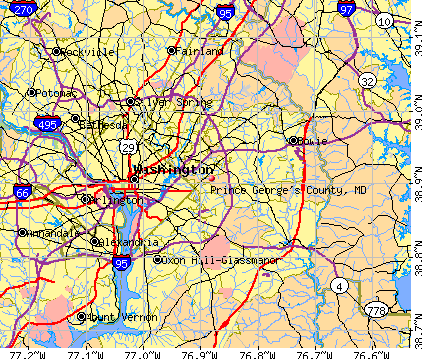
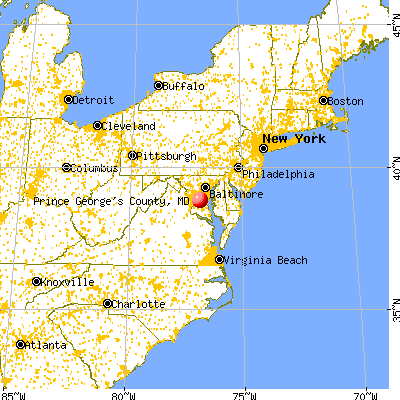
Prince George's County, Maryland (MD)
County owner-occupied free and clear houses and condos in 2010: 23,806
County owner-occupied houses and condos in 2000: 177,206
Renter-occupied apartments: 113,049 (it was 109,404 in 2000)
| % of renters here: | 38% |
| State: | 32% |
Land area: 485 sq. mi.
Water area: 13.0 sq. mi.
Population density: 1951 people per square mile (very high).
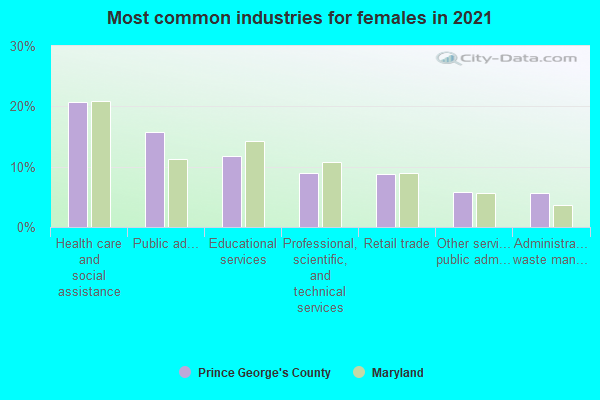
Industries providing employment: Educational, health and social services (21.3%), Professional, scientific, management, administrative, and waste management services (16.2%), Public administration (14.4%).
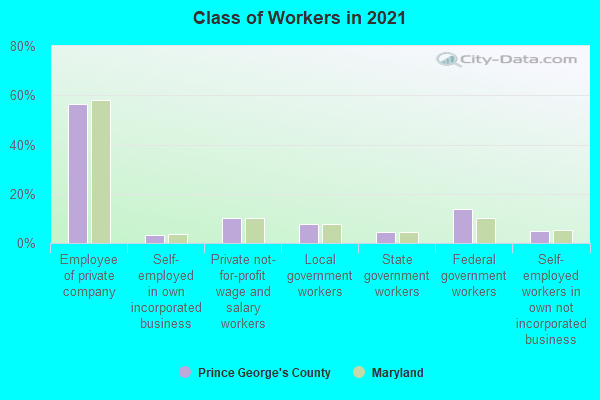
Type of workers:
- Private wage or salary: 67%
- Government: 28%
- Self-employed, not incorporated: 5%
- Unpaid family work: 0%
- OSM Map
- General Map
- Google Map
- MSN Map

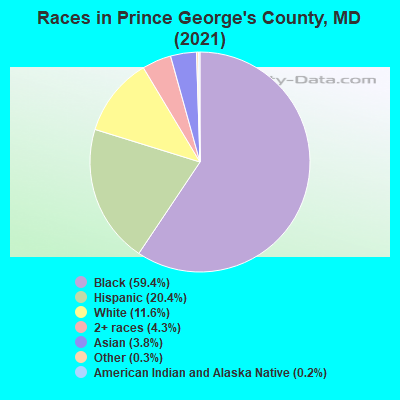
- 561,18859.3%Black Non-Hispanic Alone
- 198,31720.9%Hispanic or Latino
- 104,16611.0%White Non-Hispanic Alone
- 37,5454.0%Asian alone
- 36,5453.9%Two or more races
- 7,2270.8%Some other race alone
- 1,8790.2%American Indian and Alaska Native alone
- 1040.01%Native Hawaiian and Other
Pacific Islander alone
| Median resident age: | 39.0 years |
| Maryland median age: | 39.7 years |
| Males: 457,304 | |
| Females: 489,667 |


| Prince George's County: | 2.0 people |
| Maryland: | 3 people |
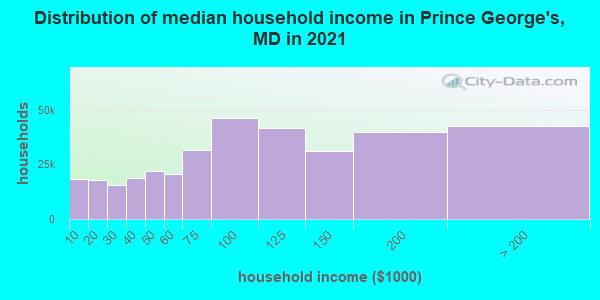
Estimated median household income in 2022: $94,441 ($55,256 in 1999)
| This county: | $94,441 |
| Maryland: | $94,991 |
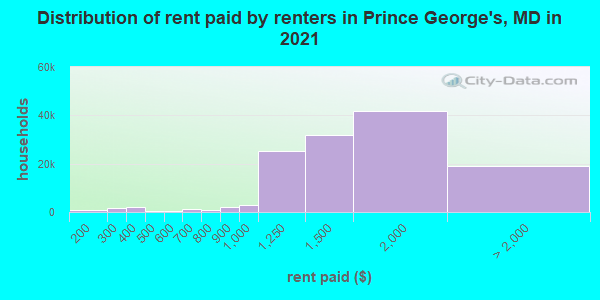
Median contract rent in 2022 for apartments: $1,501 (lower quartile is $1,236, upper quartile is $1,879)
| This county: | $1501 |
| State: | $1388 |
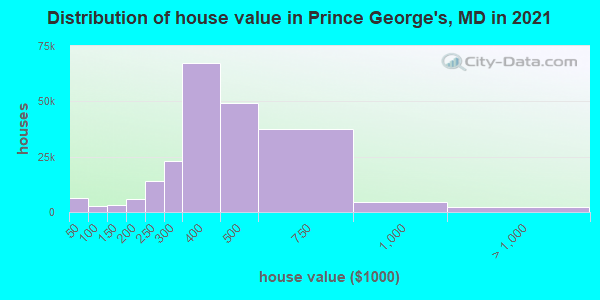
Estimated median house or condo value in 2022: $410,800 (it was $143,700 in 2000)
| Prince George's: | $410,800 |
| Maryland: | $398,100 |
Mean price in 2022:
Median monthly housing costs for homes and condos with a mortgage: $2,207Detached houses: $460,769
Here: $460,769 State: $526,819 Townhouses or other attached units: $335,894
Here: $335,894 State: $328,305 In 2-unit structures: $711,936
Here: $711,936 State: $346,599 In 3-to-4-unit structures: $270,628
Here: $270,628 State: $295,378 In 5-or-more-unit structures: $250,132
Here: $250,132 State: $350,378 Mobile homes: $129,345
Here: $129,345 State: $89,353 Occupied boats, RVs, vans, etc.: $551,726
Here: $551,726 State: $254,500
Median monthly housing costs for units without a mortgage: $746
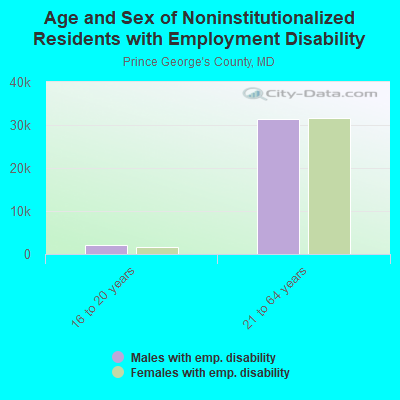
Institutionalized population: 4,283
Crime in 2021 (reported by the sheriff's office or county police, not the county total):
- Murders: 42
- Rapes: 73
- Robberies: 376
- Assaults: 431
- Burglaries: 385
- Thefts: 2718
- Auto thefts: 1181
Crime in 2020 (reported by the sheriff's office or county police, not the county total):
- Murders: 72
- Rapes: 153
- Robberies: 846
- Assaults: 912
- Burglaries: 1102
- Thefts: 6670
- Auto thefts: 2214
Health of residents in Prince George's County based on CDC Behavioral Risk Factor Surveillance System Survey Questionnaires from 2003 to 2012:
General health status score of residents in this county from 1 (poor) to 5 (excellent) is 3.6. This is better than average.74.2% of residents exercised in the past month. This is about average.
37.0% of residents smoked 100+ cigarettes in their lives. This is less than average.
68.2% of adult residents drank alcohol in the past 30 days. This is less than average.
72.1% of residents visited a dentist within the past year. This is about average.
Average weight of males is 198 pounds. This is about average.
Average weight of females is 172 pounds. This is more than average.
15.1% of residents keep firearms around their homes. This is less than average.
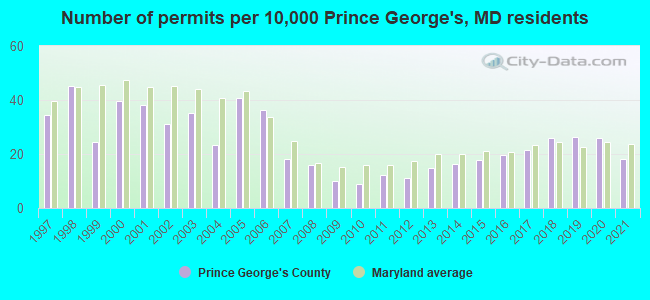
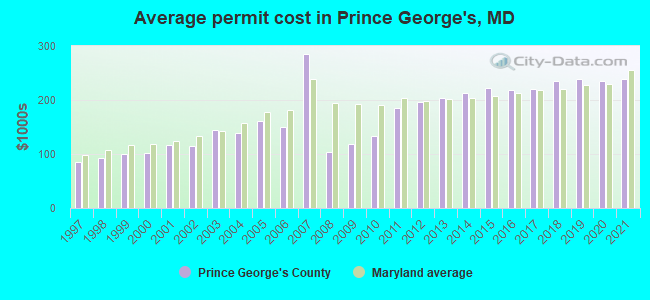
Single-family new house construction building permits:
- 2022: 1846 buildings, average cost: $209,900
- 2021: 1458 buildings, average cost: $237,800
- 2020: 2066 buildings, average cost: $234,600
- 2019: 2113 buildings, average cost: $237,800
- 2018: 2093 buildings, average cost: $235,600
- 2017: 1714 buildings, average cost: $220,700
- 2016: 1560 buildings, average cost: $218,100
- 2015: 1438 buildings, average cost: $223,300
- 2014: 1292 buildings, average cost: $212,900
- 2013: 1176 buildings, average cost: $204,200
- 2012: 878 buildings, average cost: $196,200
- 2011: 984 buildings, average cost: $184,500
- 2010: 702 buildings, average cost: $133,700
- 2009: 811 buildings, average cost: $118,100
- 2008: 1264 buildings, average cost: $103,300
- 2007: 1462 buildings, average cost: $284,900
- 2006: 2918 buildings, average cost: $149,800
- 2005: 3255 buildings, average cost: $162,300
- 2004: 1875 buildings, average cost: $138,100
- 2003: 2808 buildings, average cost: $144,900
- 2002: 2485 buildings, average cost: $114,300
- 2001: 3049 buildings, average cost: $116,000
- 2000: 3179 buildings, average cost: $101,300
- 1999: 1959 buildings, average cost: $100,300
- 1998: 3622 buildings, average cost: $91,700
- 1997: 2775 buildings, average cost: $85,500
Median real estate property taxes paid for housing units with mortgages in 2022: $4,432 (1.1%)
Median real estate property taxes paid for housing units with no mortgage in 2022: $4,182 (1.1%)
| Prince George's County: | 10.9% |
| Maryland: | 9.6% |
Median age of residents in 2022: 39.0 years old
(Males: 37.5 years old, Females: 40.4 years old)
(Median age for: White residents: 45.4 years old, Black residents: 42.5 years old, American Indian residents: 49.4 years old, Asian residents: 41.7 years old, Hispanic or Latino residents: 28.7 years old, Other race residents: 28.1 years old)
Area name: Washington-Arlington-Alexandria, DC-VA-MD HUD Metro FMR Area
Fair market rent in 2006 for a 1-bedroom apartment in Prince George's County is $1080 a month.
Fair market rent for a 2-bedroom apartment is $1225 a month.
Fair market rent for a 3-bedroom apartment is $1580 a month.
Cities in this county include: Bowie, Oxon Hill-Glassmanor, Chillum, Suitland-Silver Hill, Clinton, Suitland, College Park, Fort Washington, Landover, Greater Landover.
2023 air pollution in Prince George's County:
Carbon Monoxide: 0.176 ppm (standard limit: 9 ppm). Near U.S. average.
Nitrogen Dioxide: 0.01 ppm (standard limit: 0.053 ppm). Above U.S. average.
Ozone (1-hour): 0.031 ppm (standard limit: 0.12 ppm). Near U.S. average.
Particulate Matter (PM2.5) Annual: 8.1 µg/m3(standard limit: 15.0 µg/m3). Near U.S. average.
Sulfur Oxides Annual: 0.000 ppm (standard limit: 0.03 ppm). Near U.S. average.
Neighboring counties: El Paso County, Colorado  , Culpeper County, Virginia
  , Lincoln County, Colorado , Pottawatomie County, Kansas , Rice County, Kansas , Riley County, Kansas , Oldham County, Kentucky .
| Here: | 2.1% |
| Maryland: | 2.0% |
Current college students: 72,662
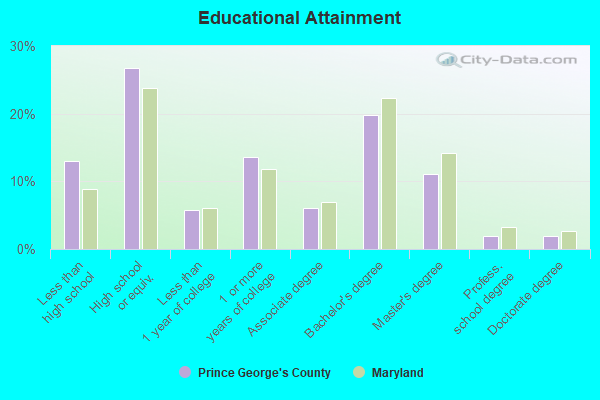
People 25 years of age or older with a high school degree or higher: 87.1%
People 25 years of age or older with a bachelor's degree or higher: 36.9%
Number of foreign born residents: 249,424 (48.5% naturalized citizens)
| Prince George's County: | 26.3% |
| Whole state: | 16.7% |
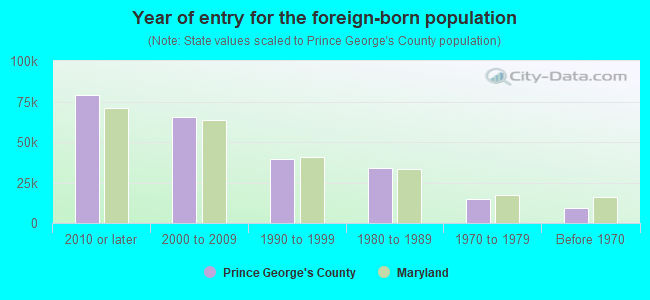
- Year of entry for the foreign-born population
- 92,0212010 or later
- 71,7022000 to 2009
- 41,2191990 to 1999
- 34,1851980 to 1989
- 14,7771970 to 1979
- 9,059Before 1970
Mean travel time to work (commute): # minutes
Percentage of county residents living and working in this county: 69.4%
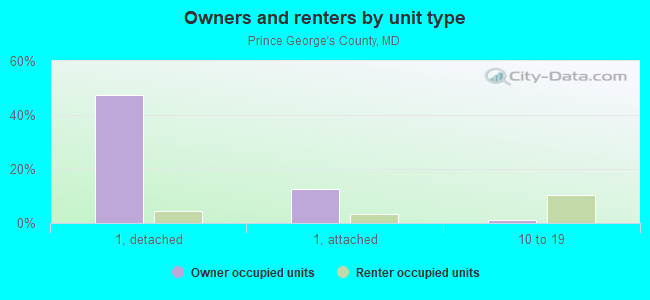
Housing units in structures:
- One, detached: 180,723
- One, attached: 62,206
- Two: 2,931
- 3 or 4: 7,838
- 5 to 9: 26,587
- 10 to 19: 38,851
- 20 to 49: 9,666
- 50 or more: 32,734
- Mobile homes: 2,213
- Boats, RVs, vans, etc.: 237
Housing units in Prince George's County with a mortgage: 168,995 (14,877 second mortgage, 539 home equity loan, 11,204 both second mortgage and home equity loan)
Houses without a mortgage: 3,284
| Here: | 98.2% with mortgage |
| State: | 97.5% with mortgage |
Religion statistics for Prince George's County
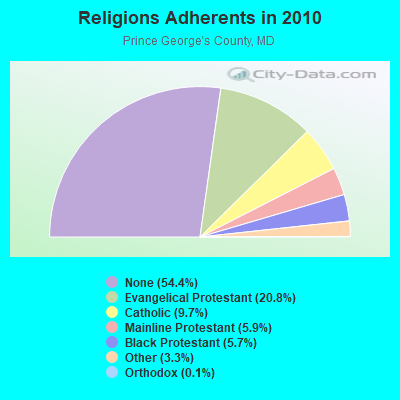
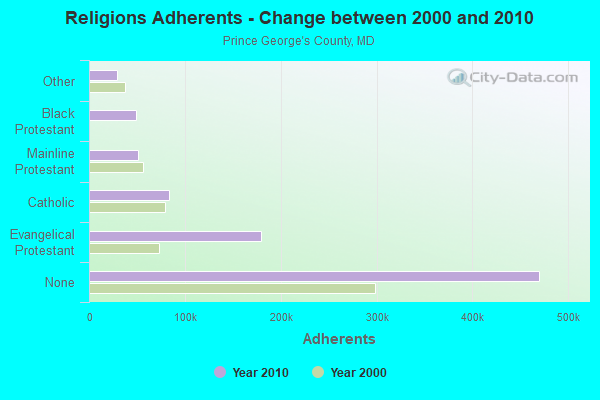
| Religion | Adherents | Congregations |
|---|---|---|
| Evangelical Protestant | 179,374 | 430 |
| Catholic | 83,959 | 35 |
| Mainline Protestant | 51,153 | 156 |
| Black Protestant | 48,984 | 66 |
| Other | 28,743 | 57 |
| Orthodox | 1,218 | 6 |
| None | 469,989 | - |
Source: Clifford Grammich, Kirk Hadaway, Richard Houseal, Dale E.Jones, Alexei Krindatch, Richie Stanley and Richard H.Taylor. 2012. 2010 U.S.Religion Census: Religious Congregations & Membership Study. Association of Statisticians of American Religious Bodies. Jones, Dale E., et al. 2002. Congregations and Membership in the United States 2000. Nashville, TN: Glenmary Research Center.
Food Environment Statistics:
| Prince George's County: | 1.70 / 10,000 pop. |
| State: | 1.96 / 10,000 pop. |
| Here: | 0.02 / 10,000 pop. |
| Maryland: | 0.07 / 10,000 pop. |
| This county: | 1.60 / 10,000 pop. |
| Maryland: | 1.22 / 10,000 pop. |
| Prince George's County: | 1.66 / 10,000 pop. |
| Maryland: | 2.05 / 10,000 pop. |
| This county: | 3.24 / 10,000 pop. |
| State: | 5.40 / 10,000 pop. |
| Prince George's County: | 10.5% |
| Maryland: | 9.1% |
| Prince George's County: | 30.7% |
| State: | 26.7% |
| Here: | 16.7% |
| State: | 15.5% |
Agriculture in Prince George's County:
Average size of farms: 101 acresAverage value of agricultural products sold per farm: $27,009
Average value of crops sold per acre for harvested cropland: $609.63
The value of livestock, poultry, and their products as a percentage of the total market value of agricultural products sold: 13.78%
Average total farm production expenses per farm: $36,601
Harvested cropland as a percentage of land in farms: 37.98%
Irrigated harvested cropland as a percentage of land in farms: 2.58%
Average market value of all machinery and equipment per farm: $50,922
The percentage of farms operated by a family or individual: 86.06%
Average age of principal farm operators: 59 years
Average number of cattle and calves per 100 acres of all land in farms: 5.32
Milk cows as a percentage of all cattle and calves: 5.95%
Corn for grain: 4811 harvested acres
All wheat for grain: 1587 harvested acres
Soybeans for beans: 5233 harvested acres
Vegetables: 1,177 harvested acres
Land in orchards: 45 acres
Earthquake activity:
Prince George's County-area historical earthquake activity is significantly above Maryland state average. It is 58% smaller than the overall U.S. average.On 8/23/2011 at 17:51:04, a magnitude 5.8 (5.8 MW, Depth: 3.7 mi, Class: Moderate, Intensity: VI - VII) earthquake occurred 89.5 miles away from Prince George's County center
On 1/16/1994 at 01:49:16, a magnitude 4.6 (4.6 MB, 4.6 LG, Depth: 3.1 mi, Class: Light, Intensity: IV - V) earthquake occurred 108.3 miles away from the county center
On 8/25/2011 at 05:07:52, a magnitude 4.5 (4.5 ML, Depth: 4.2 mi) earthquake occurred 88.7 miles away from the county center
On 12/9/2003 at 20:59:18, a magnitude 4.5 (4.5 ML, Depth: 6.2 mi) earthquake occurred 102.5 miles away from the county center
On 12/9/2003 at 20:59:14, a magnitude 4.5 (4.5 MB, 4.5 LG) earthquake occurred 106.8 miles away from Prince George's County center
On 9/25/1998 at 19:52:52, a magnitude 5.2 (4.8 MB, 4.3 MS, 5.2 LG, 4.5 MW, Depth: 3.1 mi) earthquake occurred 257.7 miles away from the county center
Magnitude types: regional Lg-wave magnitude (LG), body-wave magnitude (MB), local magnitude (ML), surface-wave magnitude (MS), moment magnitude (MW)
Most recent natural disasters:
- Maryland Severe Winter Storm and Snowstorm, Incident Period: January 22, 2016 to January 23, 2016, Major Disaster (Presidential) Declared DR-4261: March 04, 2016, FEMA Id: 4261, Natural disaster type: Snowstorm, Winter Storm
- Maryland Hurricane Sandy, Incident Period: October 26, 2012 to November 08, 2012, Emergency Declared EM-3349: October 28, 2012, FEMA Id: 3349, Natural disaster type: Hurricane
- Maryland Hurricane Sandy, Incident Period: October 26, 2012 to November 04, 2012, Major Disaster (Presidential) Declared DR-4091: November 20, 2012, FEMA Id: 4091, Natural disaster type: Hurricane
- Maryland Remnants of Tropical Storm Lee, Incident Period: September 06, 2011 to September 09, 2011, Major Disaster (Presidential) Declared DR-4038: October 05, 2011, FEMA Id: 4038, Natural disaster type: Tropical Storm
- Maryland Hurricane Irene, Incident Period: August 26, 2011 to September 05, 2011, Emergency Declared EM-3335: August 27, 2011, FEMA Id: 3335, Natural disaster type: Hurricane
- Maryland Severe Winter Storms and Snowstorms, Incident Period: February 05, 2010 to February 11, 2010, Major Disaster (Presidential) Declared DR-1910: May 06, 2010, FEMA Id: 1910, Natural disaster type: Snowstorm, Winter Storm
- Maryland Hurricane Katrina Evacuation, Incident Period: August 29, 2005 to October 01, 2005, Emergency Declared EM-3251: September 13, 2005, FEMA Id: 3251, Natural disaster type: Hurricane
- Maryland Hurricane Isabel, Incident Period: September 18, 2003 to September 29, 2003, Major Disaster (Presidential) Declared DR-1492: September 19, 2003, FEMA Id: 1492, Natural disaster type: Hurricane
- Maryland Snowstorm, Incident Period: February 14, 2003 to February 23, 2003, Emergency Declared EM-3179: March 14, 2003, FEMA Id: 3179, Natural disaster type: Snowstorm
- Maryland Winter Storm, Incident Period: January 25, 2000 to January 30, 2000, Major Disaster (Presidential) Declared DR-1324: April 10, 2000, FEMA Id: 1324, Natural disaster type: Winter Storm
- 6 other natural disasters have been reported since 1953.
The number of natural disasters in Prince George's County (16) is near the US average (15).
Major Disasters (Presidential) Declared: 11
Emergencies Declared: 5
Causes of natural disasters: Hurricanes: 5, Winter Storms: 5, Snowstorms: 3, Floods: 2, Storms: 2, Tropical Storms: 2, Blizzard: 1, Heavy Rain: 1, Ice Storm: 1, Snowfall: 1 (Note: some incidents may be assigned to more than one category).
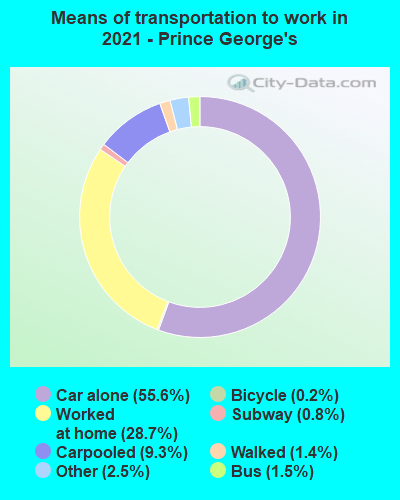
Means of transportation to work:
- Drove a car alone: 232,534 (61.2%)
- Carpooled: 28,400 (7.5%)
- Bus: 6,764 (1.8%)
- Subway or elevated rail: 3,596 (0.9%)
- Long-distance train or commuter rail: 248 (0.1%)
- Taxicab, motorcycle, or other means: 11,154 (2.9%)
- Bicycle: 1,659 (0.4%)
- Walked: 8,087 (2.1%)
- Worked at home: 87,338 (23.0%)

- Health care and social assistance (19%)
- Public administration (17%)
- Educational services (13%)
- Professional, scientific, and technical services (10%)
- Retail trade (8%)
- Other services, except public administration (6%)
- Administrative and support and waste management services (6%)
- Health care and social assistance (18%)
- Public administration (17%)
- Educational services (13%)
- Professional, scientific, and technical services (10%)
- Retail trade (8%)
- Other services, except public administration (6%)
- Administrative and support and waste management services (6%)
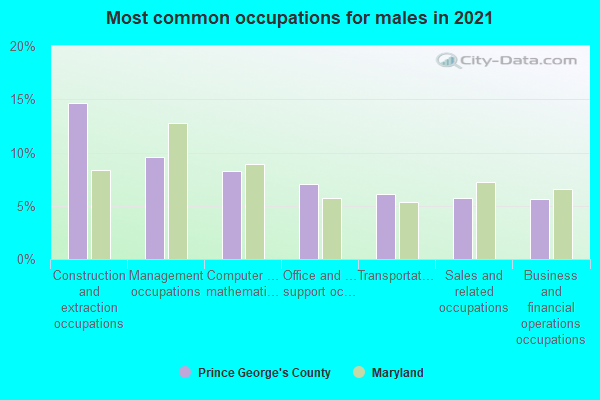
- Construction and extraction occupations (15%)
- Management occupations (8%)
- Office and administrative support occupations (8%)
- Transportation occupations (7%)
- Computer and mathematical occupations (7%)
- Business and financial operations occupations (6%)
- Sales and related occupations (6%)
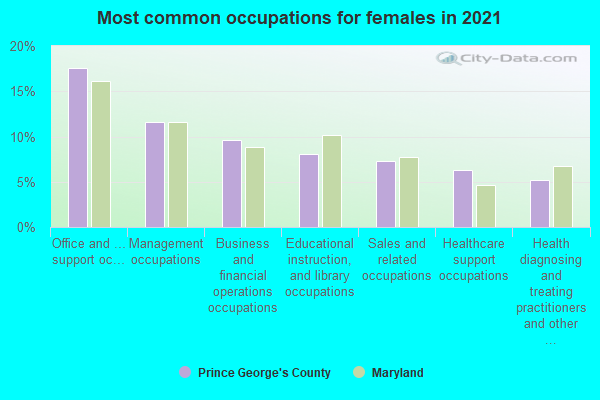
- Office and administrative support occupations (14%)
- Management occupations (12%)
- Business and financial operations occupations (10%)
- Educational instruction, and library occupations (9%)
- Sales and related occupations (7%)
- Healthcare support occupations (6%)
- Health diagnosing and treating practitioners and other technical occupations (6%)
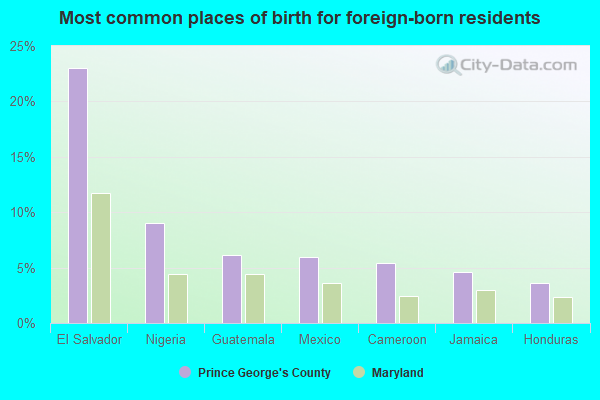
- El Salvador (23%)
- Nigeria (9%)
- Guatemala (7%)
- Mexico (6%)
- Cameroon (5%)
- Jamaica (5%)
- Honduras (5%)
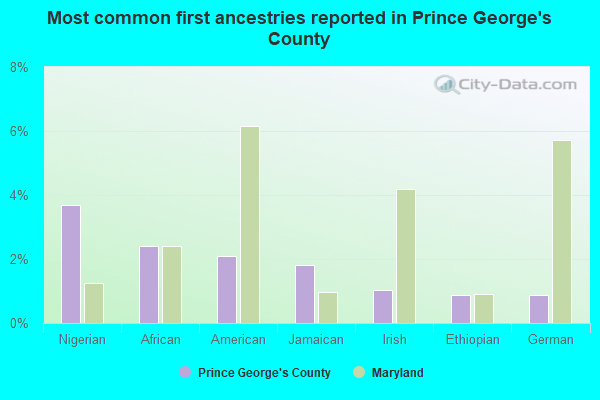
- Nigerian (4%)
- African (3%)
- American (2%)
- Jamaican (2%)
- Ethiopian (1%)
- Irish (1%)
- Ghanaian (1%)
People in group quarters in Prince George's County, Maryland in 2010:
- 13,394 people in college/university student housing
- 2,848 people in nursing facilities/skilled-nursing facilities
- 1,141 people in local jails and other municipal confinement facilities
- 407 people in workers' group living quarters and job corps centers
- 321 people in group homes intended for adults
- 311 people in emergency and transitional shelters (with sleeping facilities) for people experiencing homelessness
- 296 people in residential treatment centers for adults
- 201 people in other noninstitutional facilities
- 115 people in military barracks and dormitories (nondisciplinary)
- 88 people in hospitals with patients who have no usual home elsewhere
- 76 people in correctional facilities intended for juveniles
- 63 people in group homes for juveniles (non-correctional)
- 49 people in residential treatment centers for juveniles (non-correctional)
- 15 people in correctional residential facilities
- 3 people in mental (psychiatric) hospitals and psychiatric units in other hospitals
People in group quarters in Prince George's County, Maryland in 2000:
- 9,507 people in college dormitories (includes college quarters off campus)
- 2,581 people in nursing homes
- 1,283 people in other types of correctional institutions
- 976 people in other noninstitutional group quarters
- 558 people in military barracks, etc.
- 482 people in wards in military hospitals for patients who have no usual home elsewhere
- 381 people in other group homes
- 334 people in military transient quarters for temporary residents
- 326 people in short-term care, detention or diagnostic centers for delinquent children
- 280 people in homes for the mentally retarded
- 167 people in homes or halfway houses for drug/alcohol abuse
- 142 people in religious group quarters
- 114 people in orthopedic wards and institutions for the physically handicapped
- 57 people in homes for the mentally ill
- 52 people in wards in general hospitals for patients who have no usual home elsewhere
- 28 people in other workers' dormitories
- 27 people in hospitals/wards and hospices for chronically ill
- 25 people in mental (psychiatric) hospitals or wards
- 18 people in other nonhousehold living situations
- 16 people in other hospitals or wards for chronically ill
- 11 people in hospices or homes for chronically ill
- 9 people in homes for the physically handicapped
- 7 people in hospitals or wards for drug/alcohol abuse
- 3 people in agriculture workers' dormitories on farms
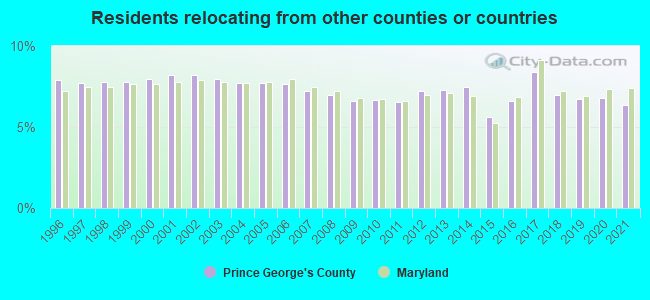
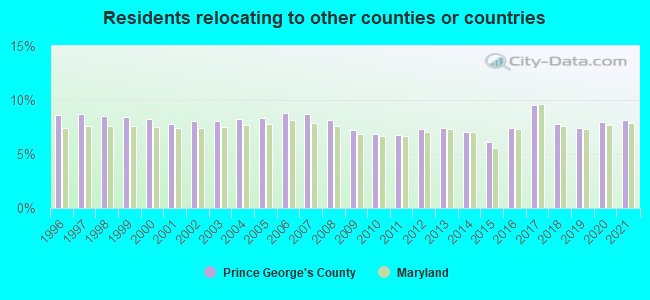
6.37% of this county's 2021 resident taxpayers lived in other counties in 2020 ($55,200 average adjusted gross income)
| Here: | 6.37% |
| Maryland average: | 7.42% |
0.04% of residents moved from foreign countries ($466 average AGI)
Prince George's County: 0.04% Maryland average: 0.05%
2.43% relocated from other counties in Maryland ($20,937 average AGI)
3.90% relocated from other states ($33,797 average AGI)
Prince George's County: 3.90% Maryland average: 3.41%
Top counties from which taxpayers relocated into this county between 2020 and 2021:
| from District of Columbia, DC | |
| from Montgomery County, MD | |
| from Anne Arundel County, MD | |
| from Charles County, MD | |
| from Fairfax County, VA | |
| from Howard County, MD | |
| from Alexandria city, VA |
8.15% of this county's 2020 resident taxpayers moved to other counties in 2021 ($59,145 average adjusted gross income)
| Here: | 8.15% |
| Maryland average: | 7.91% |
0.05% of residents moved to foreign countries ($401 average AGI)
Prince George's County: 0.05% Maryland average: 0.04%
3.98% relocated to other counties in Maryland ($29,634 average AGI)
4.12% relocated to other states ($29,110 average AGI)
Prince George's County: 4.12% Maryland average: 3.93%
Top counties to which taxpayers relocated from this county between 2020 and 2021:
| to Montgomery County, MD | |
| to Anne Arundel County, MD | |
| to District of Columbia, DC | |
| to Charles County, MD | |
| to Howard County, MD | |
| to Fairfax County, VA | |
| to Baltimore city, MD |
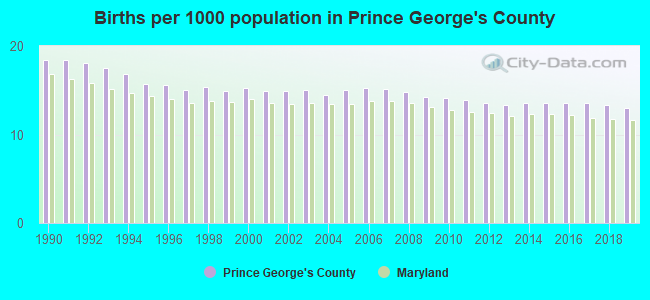
Births per 1000 population from 1990 to 1999: 16.6
Births per 1000 population from 2000 to 2009: 14.9
Births per 1000 population from 2010 to 2022: 11.4
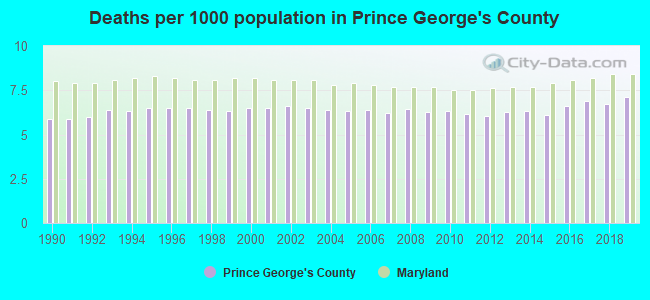
Deaths per 1000 population from 1990 to 1999: 6.3
Deaths per 1000 population from 2000 to 2009: 6.4
Deaths per 1000 population from 2010 to 2020: 6.7
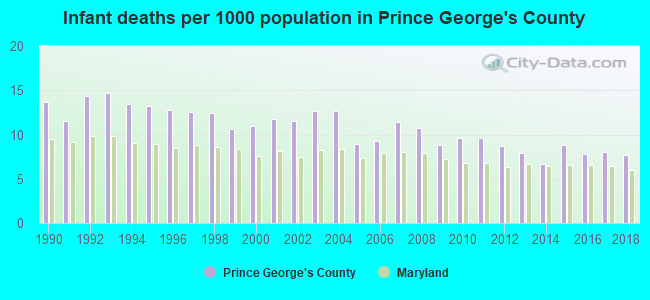
Infant deaths per 1000 live births from 1990 to 1999: 12.9
Infant deaths per 1000 live births from 2000 to 2009: 10.9
Infant deaths per 1000 live births from 2010 to 2021: 7.8
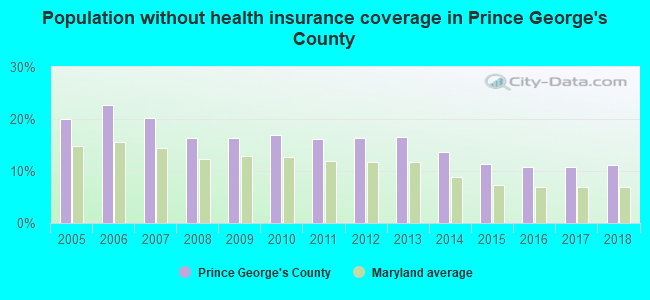
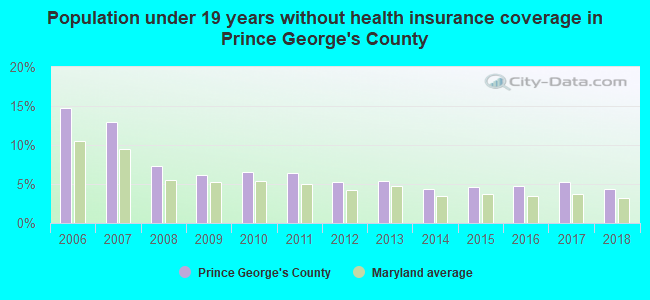
Persons under 19 years old without health insurance coverage in 2018: 4.3%
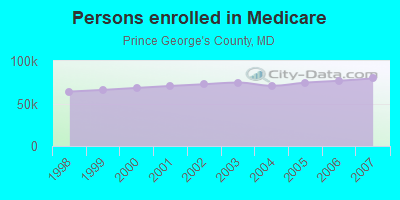
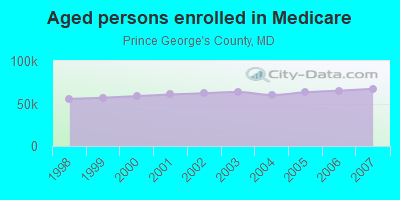
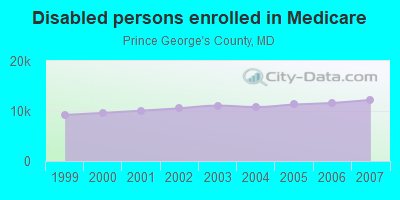
Persons enrolled in hospital insurance and/or supplemental medical insurance (Medicare) in July 1, 2007: 79,512 (67,274 aged, 12,238 disabled)
Children under 18 without health insurance coverage in 2007: 31,526 (15%)
Most common underlying causes of death in Prince George's County, Maryland in 1999 - 2019:
- Atherosclerotic cardiovascular disease, so described (6,603)
- Bronchus or lung, unspecified - Malignant neoplasms (6,338)
- Atherosclerotic heart disease (6,245)
- Acute myocardial infarction, unspecified (5,071)
- Unspecified dementia (3,297)
- Stroke, not specified as haemorrhage or infarction (2,641)
- Breast, unspecified - Malignant neoplasms (2,639)
- Unspecified diabetes mellitus, without complications (2,545)
- Hypertensive heart disease without (congestive) heart failure (2,476)
- Septicaemia, unspecified (2,413)
Population without health insurance coverage in 2000: 15%
Children under 18 without health insurance coverage in 2000: 14%
Short term general hospital admissions per 100,000 population in 2004: 6,833
Short term general hospital beds per 100,000 population in 2004: 130
Emergency room visits per 100,000 population in 2004: 34,895
General practice office based MDs per 100,000 population in 2005: 1,477
Medical specialist MDs per 100,000 population in 2005: 657
Dentists per 100,000 population in 1998: 17
Total births per 100,000 population, July 2005 - July 2006 : 50
Total deaths per 100,000 population, July 2005 - July 2006: 81
Limited-service eating places per 100,000 population in 2005 : 8
Beer, wine & liquor stores per 100,000 population in 2005: 1
Fitness & recreation sports centers per 100,000 population in 2005: 7,873
EPA green book nonattainment status in 2004-2006: 1
Homicides per 1,000,000 population from 2000 to 2006: 182.7. This is more than state average.
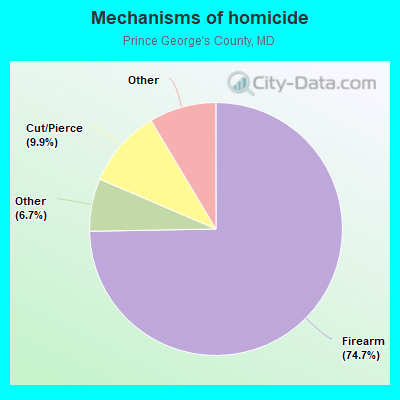
- Firearm - 136.6
- Cut/Pierce - 18.2
- Transportation-Related, Overall - 4.3
- Terrorism - 4.0
- Struck by/against - 3.8
- Suffocation - 3.6
- Other - 12.3
Suicides per 1,000,000 population from 2000 to 2006: 69.0. This is less than state average.
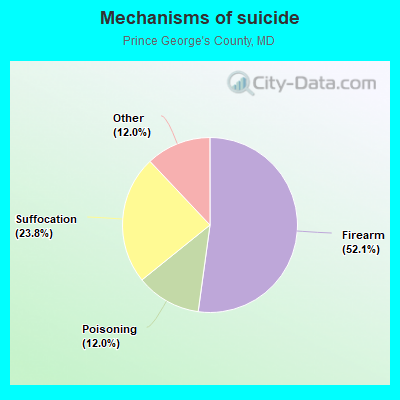
- Firearm - 36.0
- Suffocation - 16.4
- Poisoning - 8.3
- Other - 8.3
Household type by relationship:
Households: 946,971- Male householders: 155,754 (37,289 living alone), Female householders: 191,453 (61,564 living alone)
136,801 spouses (133,579 opposite-sex spouses), 23,594 unmarried partners, (22,202 opposite-sex unmarried partners), 272,451 children (257,863 natural, 3,894 adopted, 10,694 stepchildren), 32,652 grandchildren, 20,316 brothers or sisters, 21,176 parents, 309 foster children, 33,721 other relatives, 37,678 non-relatives
- In group quarters: 21,066
Size of family households: 86,342 2-persons, 53,720 3-persons, 44,845 4-persons, 23,857 5-persons, 8,673 6-persons, 9,857 7-or-more-persons.
Size of nonfamily households: 98,853 1-person, 15,069 2-persons, 3,230 3-persons, 1,499 4-persons, 836 5-persons, 161 6-persons, 265 7-or-more-persons.
102,407 married couples with children.
64,547 single-parent households (19,682 men, 44,865 women).
68.6% of residents of Prince George's speak English at home.
18.4% of residents speak Spanish at home (42% speak English very well, 22% speak English well, 25% speak English not well, 11% don't speak English at all).
4.5% of residents speak other Indo-European language at home (70% speak English very well, 18% speak English well, 10% speak English not well, 2% don't speak English at all).
2.5% of residents speak Asian or Pacific Island language at home (63% speak English very well, 22% speak English well, 11% speak English not well, 4% don't speak English at all).
6.0% of residents speak other language at home (85% speak English very well, 11% speak English well, 3% speak English not well, 1% don't speak English at all).
In fiscal year 2004:
Federal Government expenditure: $10,372,468,000 ($12,305 per capita)
Department of Defense expenditure: $1,969,988,000
Federal direct payments to individuals for retirement and disability: $2,190,784,000
Federal other direct payments to individuals: $662,440,000
Federal direct payments not to individuals: $3,292,000
Federal grants: $801,235,000
Federal procurement contracts: $4,450,116,000 ($1,203,925,000 Department of Defense)
Federal salaries and wages: $2,264,601,000 ($549,253,000 Department of Defense)
Federal Government direct loans: $166,061,000
Federal guaranteed/insured loans: $1,801,322,000
Federal Government insurance: $241,254,000
Population change from April 1, 2000 to July 1, 2005:
Births: 69,706| Here: | 82 per 1000 residents |
| State: | 71 per 1000 residents |
Deaths: 27,222
| Here: | 32 per 1000 residents |
| State: | 41 per 1000 residents |
Net international migration: +24,816
| Here: | +29 per 1000 residents |
| State: | +19 per 1000 residents |
Net internal migration: -20,578
| Here: | |
| State: |
Total withdrawal of fresh water for public supply: 52.15 millions of gallons per day (5% from ground, 95% from surface)
| Here: | 7.3 |
| State: | 7.3 |
| Here: | 4.1 |
| State: | 4.2 |
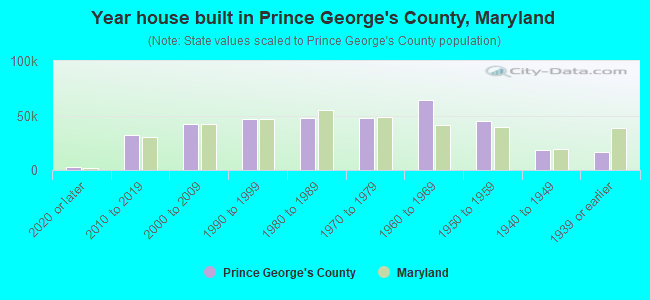
- Year house built in Prince George's County, Maryland
- 3,5262020 or later
- 27,6872010 to 2019
- 40,4512000 to 2009
- 44,9741990 to 1999
- 48,9491980 to 1989
- 53,6771970 to 1979
- 69,3711960 to 1969
- 40,7791950 to 1959
- 17,4991940 to 1949
- 17,0731939 or earlier
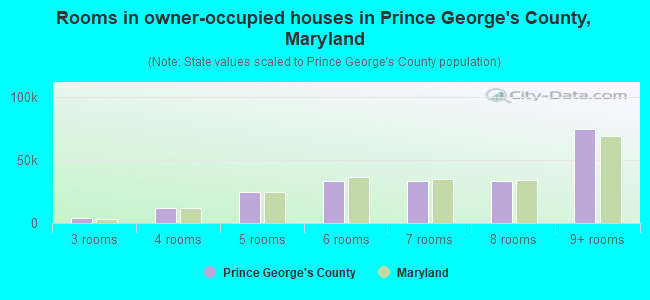
- Rooms in owner-occupied houses in Prince George's County, Maryland
- 5321 room
- 1,0192 rooms
- 3,1323 rooms
- 11,3514 rooms
- 25,1785 rooms
- 36,6596 rooms
- 36,3677 rooms
- 34,2878 rooms
- 67,2859+ rooms
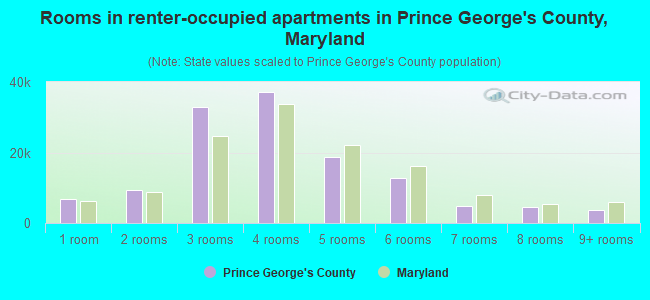
- Rooms in renter-occupied apartments in Prince George's County, Maryland
- 8,9521 room
- 8,7382 rooms
- 25,0353 rooms
- 38,4314 rooms
- 19,6995 rooms
- 12,3306 rooms
- 6,8517 rooms
- 5,6488 rooms
- 5,7139+ rooms
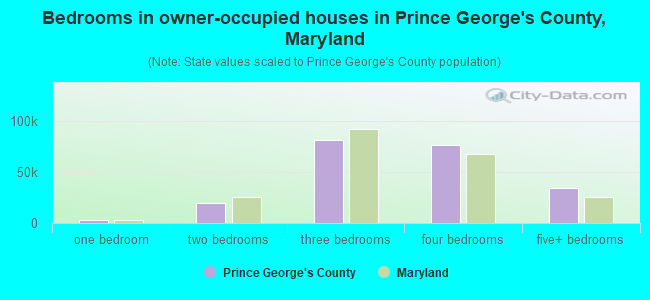
- Bedrooms in owner-occupied houses in Prince George's County, Maryland
- 710no bedroom
- 3,5071 bedroom
- 20,2002 bedrooms
- 81,0443 bedrooms
- 76,1584 bedrooms
- 34,1915+ bedrooms
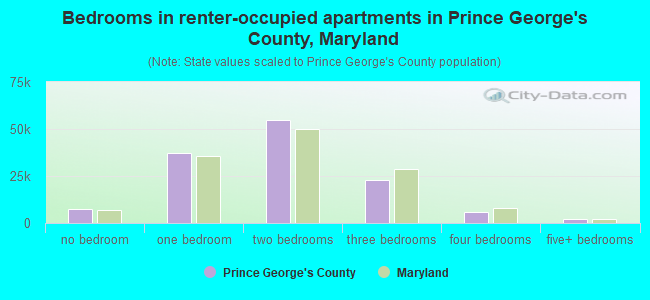
- Bedrooms in renter-occupied apartments in Prince George's County, Maryland
- 9,567no bedroom
- 37,6021 bedroom
- 50,3272 bedrooms
- 20,8753 bedrooms
- 9,1794 bedrooms
- 3,8475+ bedrooms
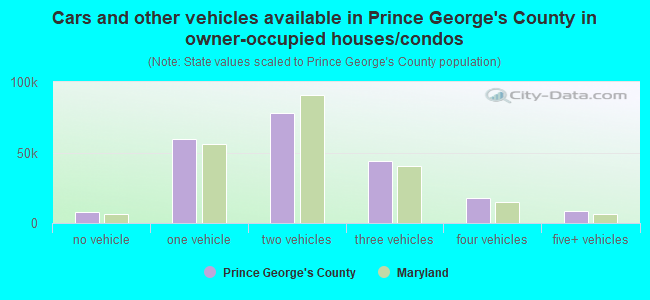
- Cars and other vehicles available in Prince George's County in owner-occupied houses/condos
- 6,765no vehicle
- 62,2021 vehicle
- 80,0272 vehicles
- 45,5613 vehicles
- 14,5394 vehicles
- 6,7165+ vehicles
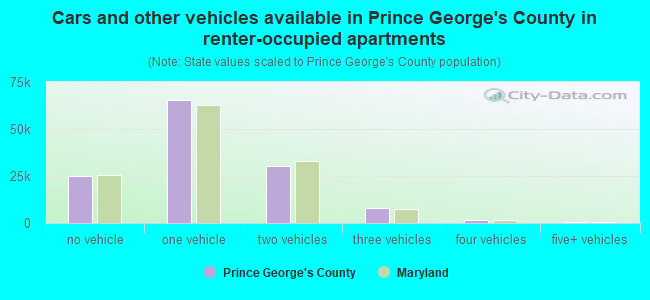
- Cars and other vehicles available in Prince George's County in renter-occupied apartments
- 22,873no vehicle
- 67,1791 vehicle
- 30,8742 vehicles
- 7,0793 vehicles
- 2,5894 vehicles
- 8035+ vehicles
89.2% of Prince George's County residents lived in the same house 1 years ago.
Out of people who lived in different houses, 37% lived in this county.
Out of people who lived in different counties, 53% lived in Maryland.
| Prince George's County: | 89.2% |
| State average: | 88.5% |
Place of birth for U.S.-born residents:
- This state: 252,489
- Other state: 427,738
- Northeast: 65,113
- Midwest: 29,996
- South: 309,458
- West: 23,171
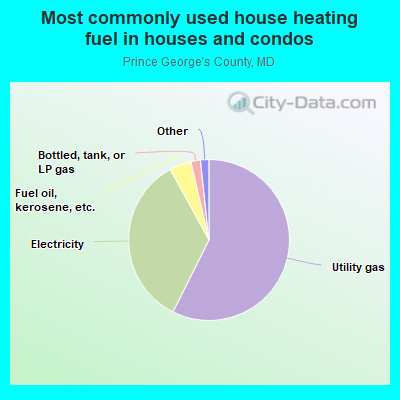
- 59.2%Utility gas
- 33.9%Electricity
- 4.2%Fuel oil, kerosene, etc.
- 1.2%Bottled, tank, or LP gas
- 0.7%Solar energy
- 0.5%Other fuel
- 0.2%No fuel used
- 0.1%Coal or coke
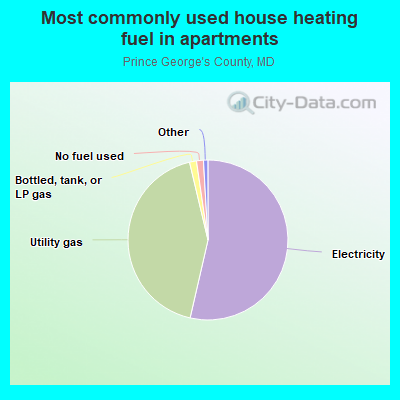
- 49.1%Electricity
- 46.6%Utility gas
- 1.6%No fuel used
- 1.2%Bottled, tank, or LP gas
- 0.6%Fuel oil, kerosene, etc.
- 0.5%Other fuel
- 0.3%Coal or coke
- 0.1%Wood
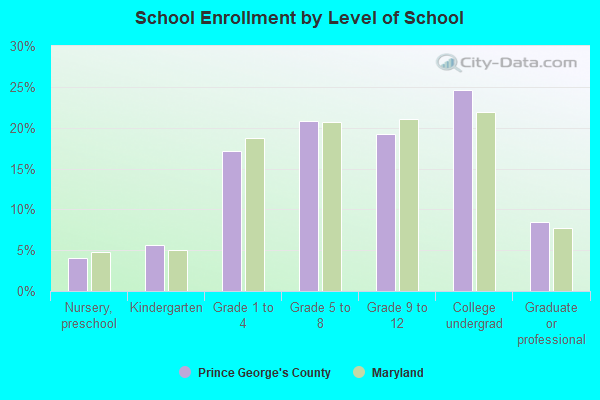
Private vs. public school enrollment:
| Here: | 13.6% |
| Maryland: | 15.2% |
| Here: | 13.2% |
| Maryland: | 14.4% |
| Here: | 14.1% |
| Maryland: | 20.2% |
Prince George's County government finances - Expenditure in 2020:
- Bond Funds - Cash and Securities: $747,789,000
Cash and Securities: $501,683,000
- Charges - Other: $99,785,000
Solid Waste Management: $98,522,000
Solid Waste Management: $97,969,000
Other: $95,998,000
Higher Education - Other: $26,549,000
Higher Education - Other: $25,735,000
Elementary and Secondary Education School Lunch: $12,214,000
Elementary and Secondary Education School Lunch: $8,885,000
Parks and Recreation: $3,414,000
Parks and Recreation: $3,406,000
Elementary and Secondary Education School Tuition and Transportation: $2,389,000
Elementary and Secondary Education School Tuition and Transportation: $1,974,000
Higher Education Auxiliary Enterprises: $1,053,000
Higher Education Auxiliary Enterprises: $819,000
Elementary and Secondary Education - Other: $401,000
- Construction - Elementary and Secondary Education: $112,289,000
Elementary and Secondary Education: $97,822,000
Other Higher Education: $34,926,000
Other Higher Education: $1,561,000
- Current Operations - Elementary and Secondary Education: $2,051,564,000
Elementary and Secondary Education: $1,921,615,000
General - Other: $505,620,000
Police Protection: $412,106,000
General - Other: $349,380,000
Police Protection: $334,450,000
Local Fire Protection: $221,881,000
Local Fire Protection: $199,072,000
Other Higher Education: $112,515,000
Other Higher Education: $108,911,000
Housing and Community Development: $108,350,000
Housing and Community Development: $105,697,000
Correctional Institutions: $98,172,000
Solid Waste Management: $93,938,000
Solid Waste Management: $89,657,000
Central Staff Services: $85,941,000
Correctional Institutions: $84,474,000
Regular Highways: $82,899,000
Health - Other: $80,240,000
Water Utilities: $76,390,000
Regular Highways: $72,275,000
Central Staff Services: $66,924,000
Health - Other: $64,725,000
Water Utilities: $58,728,000
Sewerage: $45,897,000
Judicial and Legal Services: $41,527,000
Public Welfare - Other: $33,328,000
General Public Buildings: $28,088,000
General Public Buildings: $23,175,000
Judicial and Legal Services: $21,673,000
Public Welfare - Other: $19,419,000
Financial Administration: $13,760,000
Financial Administration: $12,626,000
Protective Inspection and Regulation - Other: $4,704,000
Protective Inspection and Regulation - Other: $3,966,000
Natural Resources - Other: $1,568,000
Natural Resources - Other: $1,352,000
Higher Education Auxiliary Enterprises: $74,000
- Federal Intergovernmental - Housing and Community Development: $101,069,000
Housing and Community Development: $98,144,000
Other: $43,600,000
Other: $24,463,000
Health and Hospitals: $22,399,000
Health and Hospitals: $20,312,000
Education: $18,467,000
Education: $14,468,000
Highways: $8,909,000
Highways: $617,000
Natural Resources: $147,000
Natural Resources: $146,000
General Local Government Support: $11,000
General Local Government Support: $11,000
- General - Interest on Debt: $126,228,000
Interest on Debt: $85,214,000
- Intergovernmental to Local - Other - Elementary and Secondary Education: $65,683,000
Other - Elementary and Secondary Education: $58,310,000
Other - Libraries: $24,128,000
Other - Libraries: $21,525,000
- Local Intergovernmental - Education: $44,622,000
Education: $40,566,000
Other: $8,604,000
Other: $5,540,000
- Long Term Debt - Outstanding Unspecified Public Purpose: $2,856,203,000
Beginning Outstanding - Unspecified Public Purpose: $2,682,850,000
Outstanding Unspecified Public Purpose: $2,218,767,000
Beginning Outstanding - Unspecified Public Purpose: $1,755,546,000
Issue, Unspecified Public Purpose: $1,005,915,000
Retired Unspecified Public Purpose: $542,694,000
Issue, Unspecified Public Purpose: $531,789,000
Retired Unspecified Public Purpose: $358,435,000
Beginning Outstanding - Public Debt for Private Purpose: $12,242,000
Retired Nonguaranteed - Public Debt for Private Purpose: $7,093,000
Outstanding Nonguaranteed - Industrial Revenue: $5,149,000
- Miscellaneous - Interest Earnings: $88,942,000
General Revenue - Other: $73,078,000
General Revenue - Other: $67,239,000
Fines and Forfeits: $15,394,000
Interest Earnings: $14,829,000
Fines and Forfeits: $10,016,000
Donations From Private Sources: $3,912,000
Donations From Private Sources: $3,734,000
Rents: $1,614,000
Rents: $324,000
- Other Capital Outlay - Elementary and Secondary Education: $37,308,000
Elementary and Secondary Education: $33,810,000
General - Other: $14,042,000
Other Higher Education: $9,152,000
Other Higher Education: $973,000
Regular Highways: $647,000
Local Fire Protection: $525,000
Regular Highways: $518,000
Police Protection: $497,000
Police Protection: $441,000
Local Fire Protection: $256,000
Financial Administration: $67,000
Correctional Institutions: $28,000
Health - Other: $19,000
Judicial and Legal Services: $19,000
General - Other: $10,000
Judicial and Legal Services: $3,000
- Other Funds - Cash and Securities: $964,828,000
Cash and Securities: $719,106,000
- Revenue - Water Utilities: $14,607,000
Water Utilities: $14,531,000
- Short Term Debt Outstanding - Beginning: $75,807,000
End of Fiscal Year: $75,644,000
End of Fiscal Year: $289,000
Beginning: $264,000
- Sinking Funds - Cash and Securities: $52,501,000
Cash and Securities: $51,086,000
- State Intergovernmental - Education: $1,405,523,000
Education: $1,357,647,000
Other: $102,750,000
Other: $99,584,000
Health and Hospitals: $22,618,000
Health and Hospitals: $14,516,000
Highways: $6,297,000
Highways: $5,495,000
- Tax - Property: $1,107,844,000
Property: $912,793,000
Individual Income: $644,874,000
Individual Income: $567,886,000
Death and Gift: $138,539,000
Public Utilities Sales: $100,403,000
Public Utilities Sales: $88,789,000
Documentary and Stock Transfer: $56,819,000
Documentary and Stock Transfer: $50,750,000
Other License: $39,820,000
Other License: $37,395,000
Amusements Sales: $15,069,000
Other Selective Sales: $13,666,000
Public Utility License: $12,664,000
Public Utility License: $12,176,000
Other Selective Sales: $12,170,000
Amusements Sales: $11,235,000
Alcoholic Beverage License: $2,155,000
Occupation and Business License - Other: $1,541,000
Alcoholic Beverage License: $1,469,000
Occupation and Business License - Other: $611,000
- Total Salaries and Wages: $1,407,548,000
: $1,389,079,000
Prince George's County government finances - Revenue in 2020:
- Bond Funds - Cash and Securities: $747,789,000
Cash and Securities: $501,683,000
- Charges - Other: $99,785,000
Solid Waste Management: $98,522,000
Solid Waste Management: $97,969,000
Other: $95,998,000
Higher Education - Other: $26,549,000
Higher Education - Other: $25,735,000
Elementary and Secondary Education School Lunch: $12,214,000
Elementary and Secondary Education School Lunch: $8,885,000
Parks and Recreation: $3,414,000
Parks and Recreation: $3,406,000
Elementary and Secondary Education School Tuition and Transportation: $2,389,000
Elementary and Secondary Education School Tuition and Transportation: $1,974,000
Higher Education Auxiliary Enterprises: $1,053,000
Higher Education Auxiliary Enterprises: $819,000
Elementary and Secondary Education - Other: $401,000
- Construction - Elementary and Secondary Education: $112,289,000
Elementary and Secondary Education: $97,822,000
Other Higher Education: $34,926,000
Other Higher Education: $1,561,000
- Current Operations - Elementary and Secondary Education: $2,051,564,000
Elementary and Secondary Education: $1,921,615,000
General - Other: $505,620,000
Police Protection: $412,106,000
General - Other: $349,380,000
Police Protection: $334,450,000
Local Fire Protection: $221,881,000
Local Fire Protection: $199,072,000
Other Higher Education: $112,515,000
Other Higher Education: $108,911,000
Housing and Community Development: $108,350,000
Housing and Community Development: $105,697,000
Correctional Institutions: $98,172,000
Solid Waste Management: $93,938,000
Solid Waste Management: $89,657,000
Central Staff Services: $85,941,000
Correctional Institutions: $84,474,000
Regular Highways: $82,899,000
Health - Other: $80,240,000
Water Utilities: $76,390,000
Regular Highways: $72,275,000
Central Staff Services: $66,924,000
Health - Other: $64,725,000
Water Utilities: $58,728,000
Sewerage: $45,897,000
Judicial and Legal Services: $41,527,000
Public Welfare - Other: $33,328,000
General Public Buildings: $28,088,000
General Public Buildings: $23,175,000
Judicial and Legal Services: $21,673,000
Public Welfare - Other: $19,419,000
Financial Administration: $13,760,000
Financial Administration: $12,626,000
Protective Inspection and Regulation - Other: $4,704,000
Protective Inspection and Regulation - Other: $3,966,000
Natural Resources - Other: $1,568,000
Natural Resources - Other: $1,352,000
Higher Education Auxiliary Enterprises: $74,000
- Federal Intergovernmental - Housing and Community Development: $101,069,000
Housing and Community Development: $98,144,000
Other: $43,600,000
Other: $24,463,000
Health and Hospitals: $22,399,000
Health and Hospitals: $20,312,000
Education: $18,467,000
Education: $14,468,000
Highways: $8,909,000
Highways: $617,000
Natural Resources: $147,000
Natural Resources: $146,000
General Local Government Support: $11,000
General Local Government Support: $11,000
- General - Interest on Debt: $126,228,000
Interest on Debt: $85,214,000
- Intergovernmental to Local - Other - Elementary and Secondary Education: $65,683,000
Other - Elementary and Secondary Education: $58,310,000
Other - Libraries: $24,128,000
Other - Libraries: $21,525,000
- Local Intergovernmental - Education: $44,622,000
Education: $40,566,000
Other: $8,604,000
Other: $5,540,000
- Long Term Debt - Outstanding Unspecified Public Purpose: $2,856,203,000
Beginning Outstanding - Unspecified Public Purpose: $2,682,850,000
Outstanding Unspecified Public Purpose: $2,218,767,000
Beginning Outstanding - Unspecified Public Purpose: $1,755,546,000
Issue, Unspecified Public Purpose: $1,005,915,000
Retired Unspecified Public Purpose: $542,694,000
Issue, Unspecified Public Purpose: $531,789,000
Retired Unspecified Public Purpose: $358,435,000
Beginning Outstanding - Public Debt for Private Purpose: $12,242,000
Retired Nonguaranteed - Public Debt for Private Purpose: $7,093,000
Outstanding Nonguaranteed - Industrial Revenue: $5,149,000
- Miscellaneous - Interest Earnings: $88,942,000
General Revenue - Other: $73,078,000
General Revenue - Other: $67,239,000
Fines and Forfeits: $15,394,000
Interest Earnings: $14,829,000
Fines and Forfeits: $10,016,000
Donations From Private Sources: $3,912,000
Donations From Private Sources: $3,734,000
Rents: $1,614,000
Rents: $324,000
- Other Capital Outlay - Elementary and Secondary Education: $37,308,000
Elementary and Secondary Education: $33,810,000
General - Other: $14,042,000
Other Higher Education: $9,152,000
Other Higher Education: $973,000
Regular Highways: $647,000
Local Fire Protection: $525,000
Regular Highways: $518,000
Police Protection: $497,000
Police Protection: $441,000
Local Fire Protection: $256,000
Financial Administration: $67,000
Correctional Institutions: $28,000
Health - Other: $19,000
Judicial and Legal Services: $19,000
General - Other: $10,000
Judicial and Legal Services: $3,000
- Other Funds - Cash and Securities: $964,828,000
Cash and Securities: $719,106,000
- Revenue - Water Utilities: $14,607,000
Water Utilities: $14,531,000
- Short Term Debt Outstanding - Beginning: $75,807,000
End of Fiscal Year: $75,644,000
End of Fiscal Year: $289,000
Beginning: $264,000
- Sinking Funds - Cash and Securities: $52,501,000
Cash and Securities: $51,086,000
- State Intergovernmental - Education: $1,405,523,000
Education: $1,357,647,000
Other: $102,750,000
Other: $99,584,000
Health and Hospitals: $22,618,000
Health and Hospitals: $14,516,000
Highways: $6,297,000
Highways: $5,495,000
- Tax - Property: $1,107,844,000
Property: $912,793,000
Individual Income: $644,874,000
Individual Income: $567,886,000
Death and Gift: $138,539,000
Public Utilities Sales: $100,403,000
Public Utilities Sales: $88,789,000
Documentary and Stock Transfer: $56,819,000
Documentary and Stock Transfer: $50,750,000
Other License: $39,820,000
Other License: $37,395,000
Amusements Sales: $15,069,000
Other Selective Sales: $13,666,000
Public Utility License: $12,664,000
Public Utility License: $12,176,000
Other Selective Sales: $12,170,000
Amusements Sales: $11,235,000
Alcoholic Beverage License: $2,155,000
Occupation and Business License - Other: $1,541,000
Alcoholic Beverage License: $1,469,000
Occupation and Business License - Other: $611,000
- Total Salaries and Wages: $1,407,548,000
: $1,389,079,000
Prince George's County government finances - Debt in 2020:
- Bond Funds - Cash and Securities: $747,789,000
Cash and Securities: $501,683,000
- Charges - Other: $99,785,000
Solid Waste Management: $98,522,000
Solid Waste Management: $97,969,000
Other: $95,998,000
Higher Education - Other: $26,549,000
Higher Education - Other: $25,735,000
Elementary and Secondary Education School Lunch: $12,214,000
Elementary and Secondary Education School Lunch: $8,885,000
Parks and Recreation: $3,414,000
Parks and Recreation: $3,406,000
Elementary and Secondary Education School Tuition and Transportation: $2,389,000
Elementary and Secondary Education School Tuition and Transportation: $1,974,000
Higher Education Auxiliary Enterprises: $1,053,000
Higher Education Auxiliary Enterprises: $819,000
Elementary and Secondary Education - Other: $401,000
- Construction - Elementary and Secondary Education: $112,289,000
Elementary and Secondary Education: $97,822,000
Other Higher Education: $34,926,000
Other Higher Education: $1,561,000
- Current Operations - Elementary and Secondary Education: $2,051,564,000
Elementary and Secondary Education: $1,921,615,000
General - Other: $505,620,000
Police Protection: $412,106,000
General - Other: $349,380,000
Police Protection: $334,450,000
Local Fire Protection: $221,881,000
Local Fire Protection: $199,072,000
Other Higher Education: $112,515,000
Other Higher Education: $108,911,000
Housing and Community Development: $108,350,000
Housing and Community Development: $105,697,000
Correctional Institutions: $98,172,000
Solid Waste Management: $93,938,000
Solid Waste Management: $89,657,000
Central Staff Services: $85,941,000
Correctional Institutions: $84,474,000
Regular Highways: $82,899,000
Health - Other: $80,240,000
Water Utilities: $76,390,000
Regular Highways: $72,275,000
Central Staff Services: $66,924,000
Health - Other: $64,725,000
Water Utilities: $58,728,000
Sewerage: $45,897,000
Judicial and Legal Services: $41,527,000
Public Welfare - Other: $33,328,000
General Public Buildings: $28,088,000
General Public Buildings: $23,175,000
Judicial and Legal Services: $21,673,000
Public Welfare - Other: $19,419,000
Financial Administration: $13,760,000
Financial Administration: $12,626,000
Protective Inspection and Regulation - Other: $4,704,000
Protective Inspection and Regulation - Other: $3,966,000
Natural Resources - Other: $1,568,000
Natural Resources - Other: $1,352,000
Higher Education Auxiliary Enterprises: $74,000
- Federal Intergovernmental - Housing and Community Development: $101,069,000
Housing and Community Development: $98,144,000
Other: $43,600,000
Other: $24,463,000
Health and Hospitals: $22,399,000
Health and Hospitals: $20,312,000
Education: $18,467,000
Education: $14,468,000
Highways: $8,909,000
Highways: $617,000
Natural Resources: $147,000
Natural Resources: $146,000
General Local Government Support: $11,000
General Local Government Support: $11,000
- General - Interest on Debt: $126,228,000
Interest on Debt: $85,214,000
- Intergovernmental to Local - Other - Elementary and Secondary Education: $65,683,000
Other - Elementary and Secondary Education: $58,310,000
Other - Libraries: $24,128,000
Other - Libraries: $21,525,000
- Local Intergovernmental - Education: $44,622,000
Education: $40,566,000
Other: $8,604,000
Other: $5,540,000
- Long Term Debt - Outstanding Unspecified Public Purpose: $2,856,203,000
Beginning Outstanding - Unspecified Public Purpose: $2,682,850,000
Outstanding Unspecified Public Purpose: $2,218,767,000
Beginning Outstanding - Unspecified Public Purpose: $1,755,546,000
Issue, Unspecified Public Purpose: $1,005,915,000
Retired Unspecified Public Purpose: $542,694,000
Issue, Unspecified Public Purpose: $531,789,000
Retired Unspecified Public Purpose: $358,435,000
Beginning Outstanding - Public Debt for Private Purpose: $12,242,000
Retired Nonguaranteed - Public Debt for Private Purpose: $7,093,000
Outstanding Nonguaranteed - Industrial Revenue: $5,149,000
- Miscellaneous - Interest Earnings: $88,942,000
General Revenue - Other: $73,078,000
General Revenue - Other: $67,239,000
Fines and Forfeits: $15,394,000
Interest Earnings: $14,829,000
Fines and Forfeits: $10,016,000
Donations From Private Sources: $3,912,000
Donations From Private Sources: $3,734,000
Rents: $1,614,000
Rents: $324,000
- Other Capital Outlay - Elementary and Secondary Education: $37,308,000
Elementary and Secondary Education: $33,810,000
General - Other: $14,042,000
Other Higher Education: $9,152,000
Other Higher Education: $973,000
Regular Highways: $647,000
Local Fire Protection: $525,000
Regular Highways: $518,000
Police Protection: $497,000
Police Protection: $441,000
Local Fire Protection: $256,000
Financial Administration: $67,000
Correctional Institutions: $28,000
Health - Other: $19,000
Judicial and Legal Services: $19,000
General - Other: $10,000
Judicial and Legal Services: $3,000
- Other Funds - Cash and Securities: $964,828,000
Cash and Securities: $719,106,000
- Revenue - Water Utilities: $14,607,000
Water Utilities: $14,531,000
- Short Term Debt Outstanding - Beginning: $75,807,000
End of Fiscal Year: $75,644,000
End of Fiscal Year: $289,000
Beginning: $264,000
- Sinking Funds - Cash and Securities: $52,501,000
Cash and Securities: $51,086,000
- State Intergovernmental - Education: $1,405,523,000
Education: $1,357,647,000
Other: $102,750,000
Other: $99,584,000
Health and Hospitals: $22,618,000
Health and Hospitals: $14,516,000
Highways: $6,297,000
Highways: $5,495,000
- Tax - Property: $1,107,844,000
Property: $912,793,000
Individual Income: $644,874,000
Individual Income: $567,886,000
Death and Gift: $138,539,000
Public Utilities Sales: $100,403,000
Public Utilities Sales: $88,789,000
Documentary and Stock Transfer: $56,819,000
Documentary and Stock Transfer: $50,750,000
Other License: $39,820,000
Other License: $37,395,000
Amusements Sales: $15,069,000
Other Selective Sales: $13,666,000
Public Utility License: $12,664,000
Public Utility License: $12,176,000
Other Selective Sales: $12,170,000
Amusements Sales: $11,235,000
Alcoholic Beverage License: $2,155,000
Occupation and Business License - Other: $1,541,000
Alcoholic Beverage License: $1,469,000
Occupation and Business License - Other: $611,000
- Total Salaries and Wages: $1,407,548,000
: $1,389,079,000
Prince George's County government finances - Cash and Securities in 2020:
- Bond Funds - Cash and Securities: $747,789,000
Cash and Securities: $501,683,000
- Charges - Other: $99,785,000
Solid Waste Management: $98,522,000
Solid Waste Management: $97,969,000
Other: $95,998,000
Higher Education - Other: $26,549,000
Higher Education - Other: $25,735,000
Elementary and Secondary Education School Lunch: $12,214,000
Elementary and Secondary Education School Lunch: $8,885,000
Parks and Recreation: $3,414,000
Parks and Recreation: $3,406,000
Elementary and Secondary Education School Tuition and Transportation: $2,389,000
Elementary and Secondary Education School Tuition and Transportation: $1,974,000
Higher Education Auxiliary Enterprises: $1,053,000
Higher Education Auxiliary Enterprises: $819,000
Elementary and Secondary Education - Other: $401,000
- Construction - Elementary and Secondary Education: $112,289,000
Elementary and Secondary Education: $97,822,000
Other Higher Education: $34,926,000
Other Higher Education: $1,561,000
- Current Operations - Elementary and Secondary Education: $2,051,564,000
Elementary and Secondary Education: $1,921,615,000
General - Other: $505,620,000
Police Protection: $412,106,000
General - Other: $349,380,000
Police Protection: $334,450,000
Local Fire Protection: $221,881,000
Local Fire Protection: $199,072,000
Other Higher Education: $112,515,000
Other Higher Education: $108,911,000
Housing and Community Development: $108,350,000
Housing and Community Development: $105,697,000
Correctional Institutions: $98,172,000
Solid Waste Management: $93,938,000
Solid Waste Management: $89,657,000
Central Staff Services: $85,941,000
Correctional Institutions: $84,474,000
Regular Highways: $82,899,000
Health - Other: $80,240,000
Water Utilities: $76,390,000
Regular Highways: $72,275,000
Central Staff Services: $66,924,000
Health - Other: $64,725,000
Water Utilities: $58,728,000
Sewerage: $45,897,000
Judicial and Legal Services: $41,527,000
Public Welfare - Other: $33,328,000
General Public Buildings: $28,088,000
General Public Buildings: $23,175,000
Judicial and Legal Services: $21,673,000
Public Welfare - Other: $19,419,000
Financial Administration: $13,760,000
Financial Administration: $12,626,000
Protective Inspection and Regulation - Other: $4,704,000
Protective Inspection and Regulation - Other: $3,966,000
Natural Resources - Other: $1,568,000
Natural Resources - Other: $1,352,000
Higher Education Auxiliary Enterprises: $74,000
- Federal Intergovernmental - Housing and Community Development: $101,069,000
Housing and Community Development: $98,144,000
Other: $43,600,000
Other: $24,463,000
Health and Hospitals: $22,399,000
Health and Hospitals: $20,312,000
Education: $18,467,000
Education: $14,468,000
Highways: $8,909,000
Highways: $617,000
Natural Resources: $147,000
Natural Resources: $146,000
General Local Government Support: $11,000
General Local Government Support: $11,000
- General - Interest on Debt: $126,228,000
Interest on Debt: $85,214,000
- Intergovernmental to Local - Other - Elementary and Secondary Education: $65,683,000
Other - Elementary and Secondary Education: $58,310,000
Other - Libraries: $24,128,000
Other - Libraries: $21,525,000
- Local Intergovernmental - Education: $44,622,000
Education: $40,566,000
Other: $8,604,000
Other: $5,540,000
- Long Term Debt - Outstanding Unspecified Public Purpose: $2,856,203,000
Beginning Outstanding - Unspecified Public Purpose: $2,682,850,000
Outstanding Unspecified Public Purpose: $2,218,767,000
Beginning Outstanding - Unspecified Public Purpose: $1,755,546,000
Issue, Unspecified Public Purpose: $1,005,915,000
Retired Unspecified Public Purpose: $542,694,000
Issue, Unspecified Public Purpose: $531,789,000
Retired Unspecified Public Purpose: $358,435,000
Beginning Outstanding - Public Debt for Private Purpose: $12,242,000
Retired Nonguaranteed - Public Debt for Private Purpose: $7,093,000
Outstanding Nonguaranteed - Industrial Revenue: $5,149,000
- Miscellaneous - Interest Earnings: $88,942,000
General Revenue - Other: $73,078,000
General Revenue - Other: $67,239,000
Fines and Forfeits: $15,394,000
Interest Earnings: $14,829,000
Fines and Forfeits: $10,016,000
Donations From Private Sources: $3,912,000
Donations From Private Sources: $3,734,000
Rents: $1,614,000
Rents: $324,000
- Other Capital Outlay - Elementary and Secondary Education: $37,308,000
Elementary and Secondary Education: $33,810,000
General - Other: $14,042,000
Other Higher Education: $9,152,000
Other Higher Education: $973,000
Regular Highways: $647,000
Local Fire Protection: $525,000
Regular Highways: $518,000
Police Protection: $497,000
Police Protection: $441,000
Local Fire Protection: $256,000
Financial Administration: $67,000
Correctional Institutions: $28,000
Health - Other: $19,000
Judicial and Legal Services: $19,000
General - Other: $10,000
Judicial and Legal Services: $3,000
- Other Funds - Cash and Securities: $964,828,000
Cash and Securities: $719,106,000
- Revenue - Water Utilities: $14,607,000
Water Utilities: $14,531,000
- Short Term Debt Outstanding - Beginning: $75,807,000
End of Fiscal Year: $75,644,000
End of Fiscal Year: $289,000
Beginning: $264,000
- Sinking Funds - Cash and Securities: $52,501,000
Cash and Securities: $51,086,000
- State Intergovernmental - Education: $1,405,523,000
Education: $1,357,647,000
Other: $102,750,000
Other: $99,584,000
Health and Hospitals: $22,618,000
Health and Hospitals: $14,516,000
Highways: $6,297,000
Highways: $5,495,000
- Tax - Property: $1,107,844,000
Property: $912,793,000
Individual Income: $644,874,000
Individual Income: $567,886,000
Death and Gift: $138,539,000
Public Utilities Sales: $100,403,000
Public Utilities Sales: $88,789,000
Documentary and Stock Transfer: $56,819,000
Documentary and Stock Transfer: $50,750,000
Other License: $39,820,000
Other License: $37,395,000
Amusements Sales: $15,069,000
Other Selective Sales: $13,666,000
Public Utility License: $12,664,000
Public Utility License: $12,176,000
Other Selective Sales: $12,170,000
Amusements Sales: $11,235,000
Alcoholic Beverage License: $2,155,000
Occupation and Business License - Other: $1,541,000
Alcoholic Beverage License: $1,469,000
Occupation and Business License - Other: $611,000
- Total Salaries and Wages: $1,407,548,000
: $1,389,079,000
Supplemental Security Income (SSI) in 2006:
- Total number of recipients: 11,613
- Number of aged recipients: 1,877
- Number of blind and disabled recipients: 9,736
- Number of recipients under 18: 2,538
- Number of recipients between 18 and 64: 6,301
- Number of recipients older than 64: 2,774
- Number of recipients also receiving OASDI: 2,856
- Amount of payments (thousands of dollars): 5,441
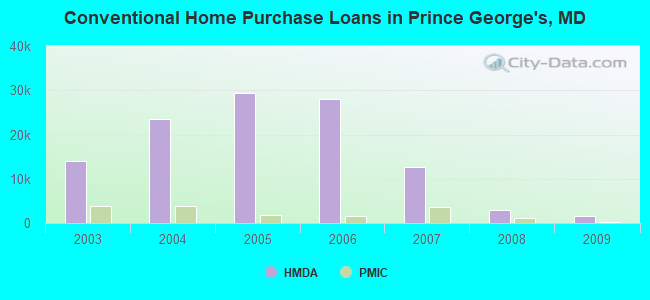
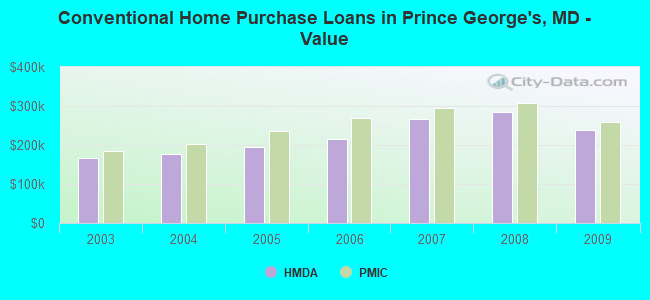
| Home Mortgage Disclosure Act Aggregated Statistics For Year 2009 (Based on 183 full tracts) | ||||||||||||||
| A) FHA, FSA/RHS & VA Home Purchase Loans | B) Conventional Home Purchase Loans | C) Refinancings | D) Home Improvement Loans | E) Loans on Dwellings For 5+ Families | F) Non-occupant Loans on < 5 Family Dwellings (A B C & D) | G) Loans On Manufactured Home Dwelling (A B C & D) | ||||||||
|---|---|---|---|---|---|---|---|---|---|---|---|---|---|---|
| Number | Average Value | Number | Average Value | Number | Average Value | Number | Average Value | Number | Average Value | Number | Average Value | Number | Average Value | |
| LOANS ORIGINATED | 5,597 | $271,240 | 1,494 | $238,918 | 13,363 | $242,306 | 774 | $84,097 | 17 | $10,370,412 | 757 | $179,646 | 13 | $137,000 |
| APPLICATIONS APPROVED, NOT ACCEPTED | 390 | $261,818 | 220 | $270,355 | 1,647 | $249,249 | 201 | $45,005 | 1 | $99,999,000 | 135 | $196,852 | 13 | $63,308 |
| APPLICATIONS DENIED | 1,211 | $265,841 | 519 | $219,882 | 8,856 | $264,578 | 897 | $68,528 | 0 | $0 | 621 | $175,151 | 51 | $66,059 |
| APPLICATIONS WITHDRAWN | 1,199 | $259,949 | 366 | $244,743 | 4,954 | $263,773 | 214 | $117,491 | 9 | $8,565,333 | 299 | $178,946 | 2 | $278,500 |
| FILES CLOSED FOR INCOMPLETENESS | 204 | $239,049 | 111 | $266,270 | 1,660 | $262,314 | 88 | $142,534 | 1 | $300,000 | 135 | $214,904 | 1 | $36,000 |
| Private Mortgage Insurance Companies Aggregated Statistics For Year 2009 (Based on 160 full tracts) | ||||||||
| A) Conventional Home Purchase Loans | B) Refinancings | C) Non-occupant Loans on < 5 Family Dwellings (A & B) | D) Loans On Manufactured Home Dwelling (A & B) | |||||
|---|---|---|---|---|---|---|---|---|
| Number | Average Value | Number | Average Value | Number | Average Value | Number | Average Value | |
| LOANS ORIGINATED | 236 | $259,119 | 185 | $279,768 | 4 | $290,000 | 0 | $0 |
| APPLICATIONS APPROVED, NOT ACCEPTED | 150 | $340,720 | 173 | $322,642 | 9 | $331,667 | 1 | $350,000 |
| APPLICATIONS DENIED | 64 | $317,703 | 74 | $263,959 | 1 | $197,000 | 0 | $0 |
| APPLICATIONS WITHDRAWN | 24 | $251,833 | 29 | $283,828 | 0 | $0 | 0 | $0 |
| FILES CLOSED FOR INCOMPLETENESS | 23 | $327,478 | 23 | $344,087 | 2 | $234,000 | 0 | $0 |
| Most common first names in Prince George's County, MD among deceased individuals | ||
| Name | Count | Lived (average) |
|---|---|---|
| Mary | 3,336 | 78.7 years |
| John | 3,023 | 72.2 years |
| James | 2,914 | 69.5 years |
| William | 2,802 | 72.1 years |
| Robert | 1,915 | 69.2 years |
| Charles | 1,774 | 71.5 years |
| Joseph | 1,542 | 72.0 years |
| George | 1,446 | 72.7 years |
| Margaret | 1,327 | 77.6 years |
| Helen | 1,203 | 79.1 years |
| Most common last names in Prince George's County, MD among deceased individuals | ||
| Last name | Count | Lived (average) |
|---|---|---|
| Smith | 1,304 | 72.1 years |
| Johnson | 1,102 | 71.0 years |
| Brown | 990 | 72.6 years |
| Williams | 951 | 70.4 years |
| Jones | 895 | 71.9 years |
| Davis | 672 | 71.0 years |
| Thomas | 622 | 70.8 years |
| Jackson | 581 | 71.2 years |
| Miller | 482 | 74.3 years |
| Taylor | 459 | 71.9 years |
| Businesses in Prince George's County, MD | ||||
| Name | Count | Name | Count | |
|---|---|---|---|---|
| 7-Eleven | 71 | Kmart | 4 | |
| ALDI | 6 | Kohl's | 2 | |
| AMF Bowling | 4 | LA Fitness | 3 | |
| AT&T | 7 | La Quinta | 1 | |
| Advance Auto Parts | 17 | La-Z-Boy | 1 | |
| American Eagle Outfitters | 1 | Lane Bryant | 4 | |
| Ann Taylor | 1 | Lane Furniture | 4 | |
| Applebee's | 4 | LensCrafters | 3 | |
| Arby's | 6 | Little Caesars Pizza | 3 | |
| Audi | 1 | Long John Silver's | 2 | |
| AutoZone | 14 | Lowe's | 5 | |
| Avenue | 2 | Macy's | 3 | |
| BMW | 2 | Marriott | 8 | |
| Baja Fresh Mexican Grill | 1 | Marshalls | 5 | |
| Bakers | 1 | MasterBrand Cabinets | 42 | |
| Bally Total Fitness | 3 | Mazda | 2 | |
| Barnes & Noble | 1 | McDonald's | 47 | |
| Baskin-Robbins | 10 | Men's Wearhouse | 5 | |
| Bath & Body Works | 5 | Motel 6 | 2 | |
| Bed Bath & Beyond | 1 | Motherhood Maternity | 4 | |
| Ben & Jerry's | 4 | New York & Co | 1 | |
| Best Western | 1 | Nike | 53 | |
| Blockbuster | 5 | Nissan | 5 | |
| Budget Car Rental | 3 | Office Depot | 3 | |
| Buffalo Wild Wings | 2 | Old Country Buffet | 2 | |
| Burger King | 4 | Old Navy | 4 | |
| CVS | 34 | Olive Garden | 2 | |
| Casual Male XL | 3 | On The Border | 1 | |
| Catherines | 3 | Outback | 5 | |
| Chevrolet | 5 | Outback Steakhouse | 5 | |
| Chick-Fil-A | 7 | Panda Express | 8 | |
| Chipotle | 7 | Panera Bread | 4 | |
| Chuck E. Cheese's | 3 | Papa John's Pizza | 13 | |
| Cinnabon | 1 | Payless | 18 | |
| Circle K | 1 | Penske | 4 | |
| Clarion | 2 | PetSmart | 6 | |
| Cold Stone Creamery | 4 | Pier 1 Imports | 2 | |
| ColorTyme | 3 | Pizza Hut | 21 | |
| Comfort Inn | 6 | Popeyes | 20 | |
| Comfort Suites | 1 | Qdoba Mexican Grill | 2 | |
| Costco | 2 | Quality | 2 | |
| Cricket Wireless | 30 | Quiznos | 11 | |
| Curves | 3 | RadioShack | 18 | |
| DHL | 9 | Ramada | 1 | |
| Dairy Queen | 1 | Red Lobster | 2 | |
| Days Inn | 2 | Red Robin | 1 | |
| Deb | 1 | Red Roof Inn | 3 | |
| Decora Cabinetry | 8 | Rite Aid | 16 | |
| Dennys | 2 | Ruby Tuesday | 4 | |
| Domino's Pizza | 8 | Ryder Rental & Truck Leasing | 1 | |
| DressBarn | 7 | Safeway | 16 | |
| Dressbarn | 5 | Sam's Club | 1 | |
| Dunkin Donuts | 13 | Sears | 12 | |
| Econo Lodge | 2 | Sephora | 2 | |
| Extended Stay America | 1 | Sheraton | 1 | |
| Famous Footwear | 2 | Sleep Inn | 1 | |
| Fashion Bug | 4 | Sprint Nextel | 11 | |
| FedEx | 128 | Staples | 11 | |
| Finish Line | 1 | Starbucks | 30 | |
| Firestone Complete Auto Care | 3 | Subaru | 2 | |
| Foot Locker | 9 | Subway | 53 | |
| Ford | 6 | Super 8 | 2 | |
| GNC | 19 | T-Mobile | 28 | |
| GameStop | 15 | T.G.I. Driday's | 5 | |
| Gap | 2 | T.J.Maxx | 1 | |
| Giant | 18 | Taco Bell | 19 | |
| Goodwill | 7 | Target | 8 | |
| H&R Block | 23 | The Athlete's Foot | 2 | |
| Havertys Furniture | 1 | The Room Place | 3 | |
| Haworth | 1 | Toyota | 3 | |
| Hilton | 5 | Toys"R"Us | 6 | |
| Holiday Inn | 5 | True Value | 1 | |
| Home Depot | 9 | U-Haul | 27 | |
| Honda | 5 | UPS | 94 | |
| Howard Johnson | 2 | Value City Furniture | 1 | |
| Hyundai | 4 | Vans | 1 | |
| IHOP | 11 | Verizon Wireless | 10 | |
| IKEA | 1 | Victoria's Secret | 2 | |
| JCPenney | 2 | Volkswagen | 3 | |
| Jimmy John's | 2 | Vons | 13 | |
| JoS. A. Bank | 2 | Walgreens | 2 | |
| Johnny Rockets | 2 | Walmart | 4 | |
| Jones New York | 5 | Wendy's | 23 | |
| Just Tires | 3 | Westin | 1 | |
| Justice | 1 | World Gym | 2 | |
| KFC | 21 | YMCA | 1 | |
Prince George's County on our top lists:
- #4 on the list of "Top 101 counties with highest percentage of residents voting for Obama (Democrat) in the 2012 Presidential Election (pop. 50,000+)"
- #5 on the list of "Top 101 counties with highest percentage of residents voting for Obama (Democrat) in the 2012 Presidential Election"
- #12 on the list of "Top 101 counties with the highest number of infant deaths per 1000 residents 2007-2013 (pop. 50,000+)"
- #13 on the list of "Top 101 counties with the highest average weight of females"
- #14 on the list of "Top 101 counties with the highest Nitrogen Dioxide air pollution readings in 2012 (ppm)"
- #14 on the list of "Top 101 counties with the most Black Protestant adherents"
- #14 on the list of "Top 101 counties with the most Black Protestant adherents (pop. 50,000+)"
- #22 on the list of "Top 101 counties with the lowest percentage of residents that smoked 100+ cigarettes in their lives"
- #32 on the list of "Top 101 counties with the most Evangelical Protestant adherents"
- #32 on the list of "Top 101 counties with the most Evangelical Protestant adherents (pop. 50,000+)"
- #35 on the list of "Top 101 counties with the lowest Particulate Matter (PM10) Annual air pollution readings in 2012 (µg/m3)"
- #37 on the list of "Top 101 counties with the most Black Protestant congregations"
- #37 on the list of "Top 101 counties with the most Black Protestant congregations (pop. 50,000+)"
- #41 on the list of "Top 101 counties with the most Evangelical Protestant congregations"
- #41 on the list of "Top 101 counties with the most Evangelical Protestant congregations (pop. 50,000+)"
- #43 on the list of "Top 101 counties with the lowest percentage of residents that keep firearms around their homes"
- #47 on the list of "Top 101 counties with the most Mainline Protestant congregations (pop. 50,000+)"
- #48 on the list of "Top 101 counties with the most Mainline Protestant congregations"
- #50 on the list of "Top 101 counties with the highest Particulate Matter (PM2.5) Annual air pollution readings in 2012 (µg/m3)"
- #57 on the list of "Top 101 counties with the highest carbon monoxide air pollution readings in 2012 (ppm)"