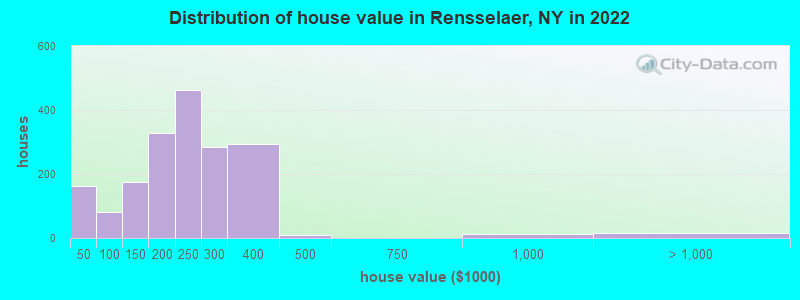
Estimated median house or condo value in 2022: $224,972 (it was $83,300 in 2000)
Rensselaer:
$224,972
NY:
$400,400
Mean prices in 2022:all housing units: $206,413; detached houses: $198,946; townhouses or other attached units: $231,668; in 2-unit structures: $199,662; in 3-to-4-unit structures: $389,237; in 5-or-more-unit structures: $219,863
Median gross rent in 2022: $1,148.
March 2022 cost of living index in Rensselaer: 106.4 (more than average, U.S. average is 100)
Percentage of residents living in poverty in 2022: 19.9%
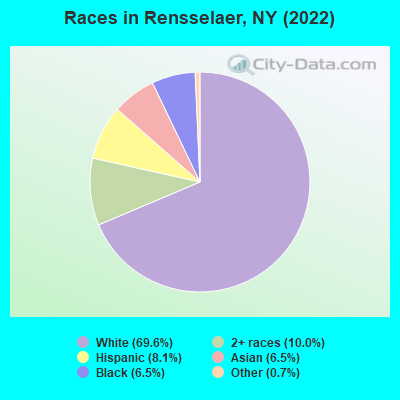
(18.5% for White Non-Hispanic residents, 16.0% for Black residents, 14.2% for Hispanic or Latino residents, 38.0% for two or more races residents)
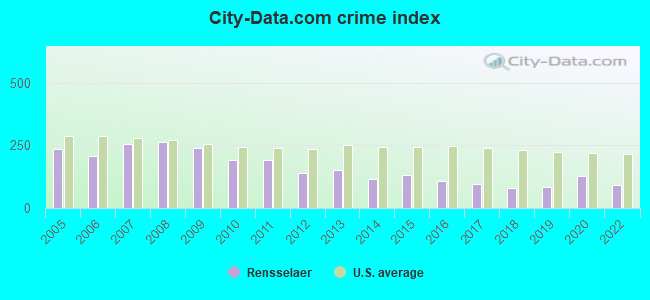
The City-Data.com crime index weighs serious crimes and violent crimes more heavily. Higher means more crime, U.S. average is 246.1. It adjusts for the number of visitors and daily workers commuting into cities.
Latest news from Rensselaer, NY collected exclusively by city-data.com from local newspapers, TV, and radio stations
Ancestries: Irish (16.2%), Italian (11.3%), American (7.6%), Polish (6.6%), German (6.1%), Jamaican (2.9%).
Current Local Time: EST time zone
Incorporated in 1815
Elevation: 10 feet
Land area: 3.01 square miles.
Population density: 3,073 people per square mile (average).
714 residents are foreign born (4.7% Asia, 1.1% Europe, 0.9% Africa).
This city:
7.8%
New York:
22.6%
Median real estate property taxes paid for housing units with mortgages in 2022: $4,174 (1.8%) Median real estate property taxes paid for housing units with no mortgage in 2022: $4,620 (2.0%)
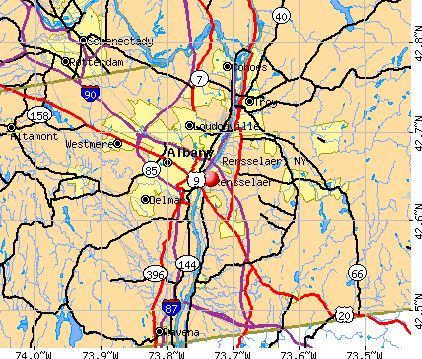
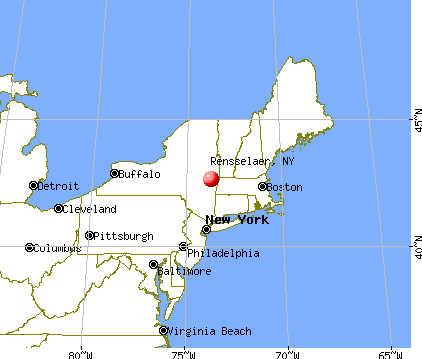
Nearest city with pop. 50,000+: Albany, NY (2.6 miles , pop. 95,658).
Nearest city with pop. 200,000+: Bronx, NY (124.7 miles , pop. 1,332,650).
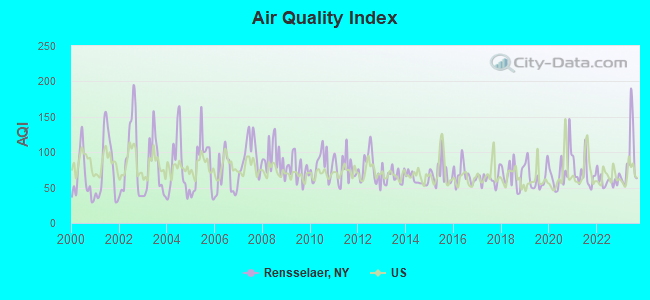
Air Quality Index (AQI) level in 2023 was 89.2. This is worse than average.
City:
89.2
U.S.:
72.6
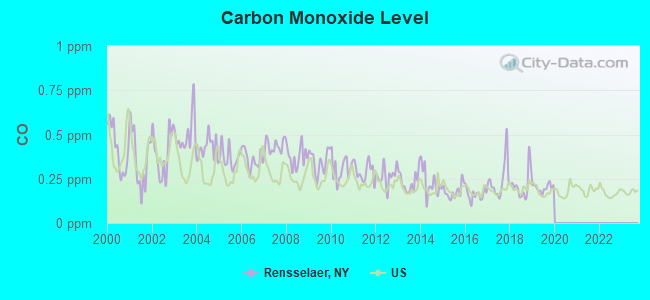
Carbon Monoxide (CO) [ppm] level in 2019 was 0.199. This is better than average.Closest monitor was 1.6 miles away from the city center.
City:
0.199
U.S.:
0.251
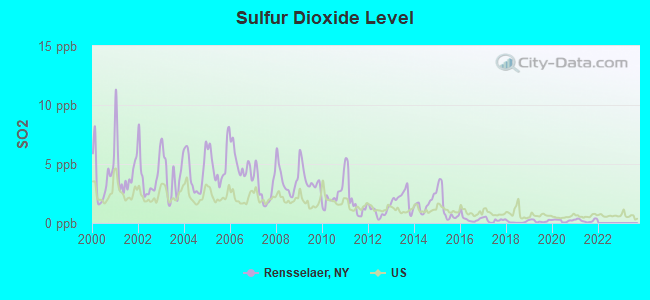
Sulfur Dioxide (SO2) [ppb] level in 2021 was 0.213. This is significantly better than average.Closest monitor was 1.1 miles away from the city center.
City:
0.213
U.S.:
1.515
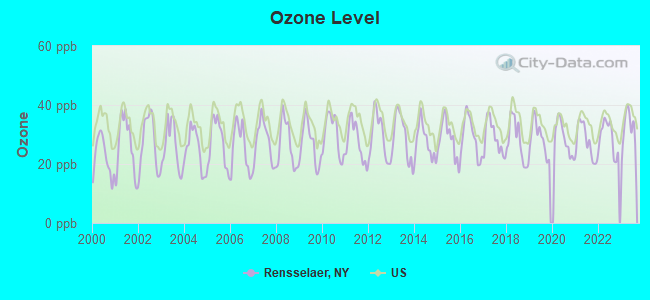
Ozone [ppb] level in 2023 was 32.1. This is about average.Closest monitor was 1.6 miles away from the city center.
City:
32.1
U.S.:
33.3
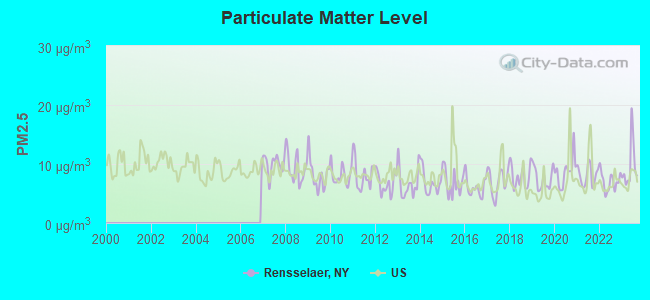
Particulate Matter (PM2.5) [µg/m3] level in 2023 was 9.66. This is about average.Closest monitor was 1.1 miles away from the city center.
City:
9.66
U.S.:
8.11
Tornado activity:
Rensselaer-area historical tornado activity is above New York state average. It is 40% smaller than the overall U.S. average.
On 8/28/1973, a category F4 (max. wind speeds 207-260 mph) tornado 22.4 miles away from the Rensselaer city center killed 4 peopleand injured 36 peopleand causedbetween $5,000,000 and $50,000,000 in damages.
On 7/10/1989, a category F4 tornado 23.8 miles away from the city center injured 20 peopleand causedbetween $5,000,000 and $50,000,000 in damages.
Earthquake activity:
Rensselaer-area historical earthquake activity is significantly above New York state average. It is 68% smaller than the overall U.S. average.
On 10/7/1983 at 10:18:46, a magnitude 5.3 (5.1 MB, 5.3 LG, 5.1 ML, Class: Moderate, Intensity: VI - VII) earthquake occurred 95.4 miles away from the city center On 4/20/2002 at 10:50:47, a magnitude 5.3 (5.3 ML, Depth: 3.0 mi) earthquake occurred 129.1 miles away from Rensselaer center On 4/20/2002 at 10:50:47, a magnitude 5.2 (5.2 MB, 4.2 MS, 5.2 MW, 5.0 MW) earthquake occurred 127.3 miles away from the city center On 1/19/1982 at 00:14:42, a magnitude 4.7 (4.5 MB, 4.7 MD, 4.5 LG, Class: Light, Intensity: IV - V) earthquake occurred 122.9 miles away from Rensselaer center On 10/16/2012 at 23:12:25, a magnitude 4.7 (4.7 ML, Depth: 10.0 mi) earthquake occurred 168.7 miles away from Rensselaer center On 6/17/1991 at 08:53:16, a magnitude 4.1 (4.0 MB, 4.0 LG, Depth: 3.1 mi) earthquake occurred 48.1 miles away from the city center Magnitude types: regional Lg-wave magnitude (LG), body-wave magnitude (MB), duration magnitude (MD), local magnitude (ML), surface-wave magnitude (MS), moment magnitude (MW)
Natural disasters:
The number of natural disasters in Rensselaer County (24) is greater than the US average (15). Major Disasters (Presidential) Declared: 14 Emergencies Declared: 9
Causes of natural disasters: Storms: 7, Floods: 5, Hurricanes: 5, Winter Storms: 4, Blizzards: 2, Snowstorms: 2, Tornadoes: 2, Chemical Waste: 1, Power Outage: 1, Tropical Storm: 1, Other: 2 (Note: some incidents may be assigned to more than one category).
Hospitals and medical centers in Rensselaer:
COMMUNITY HOSPICE, INC, THE (295 VALLEY VIEW BOULEVARD)
LIVING RESOURCES CORPORATION, INC (19 JEFFERSON AVE)
ROSEWOOD REHABILITATION AND NURSING CENTER (284 TROY ROAD)
Amtrak station:
ALBANY-RENSSELAER (555 EAST ST.) . Services: ticket office, partially wheelchair accessible, enclosed waiting area, public restrooms, public payphones, snack bar, ATM, free short-term parking, free long-term parking, call for car rental service, taxi stand, public transit connection.
Colleges/universities with over 2000 students nearest to Rensselaer:
The College of Saint Rose (about 3 miles; Albany, NY; Full-time enrollment: 4,085)
Hudson Valley Community College (about 5 miles; Troy, NY; FT enrollment: 9,346)
Siena College (about 6 miles; Loudonville, NY; FT enrollment: 3,153)
SUNY at Albany (about 6 miles; Albany, NY; FT enrollment: 15,490)
The Sage Colleges (about 6 miles; Troy, NY; FT enrollment: 2,499)
Rensselaer Polytechnic Institute (about 7 miles; Troy, NY; FT enrollment: 6,940)
Excelsior College (about 8 miles; Albany, NY; FT enrollment: 4,723)
Notable locations in Rensselaer: Niagara-Mohawk Power Corporation Rensselaer Sub-Station (A), Rensselaer Fire Station Number 4 (B), City of Rensselaer Department of Water Pumping Station (C), Rensselaer Engine Company Number 1 (D), Rensselaer Fire Department Station Number 2 (E), E F Hart Hose Company (F), Rensselaer Fire Department North Station (G). Display/hide their locations on the map
Churches in Rensselaer include: First Baptist Church of Rensselaer (A), Episcopal Church of the Redeemer (B), Church of God (C), Broadway United Methodist Church (D), Saint Josephs Roman Catholic Church (E), First Presbyterian Church (F), First United Methodist Church of Rensselaer (G), Saint John's Roman Catholic Church (H), First Congregational Church (I). Display/hide their locations on the map
Birthplace of: Robert Van Rensselaer - Politician.
Rensselaer County has a predicted average indoor radon screening level greater than 4 pCi/L (pico curies per liter) - Highest Potential
Drinking water stations with addresses in Rensselaer and their reported violations in the past:
COUNTRY ACRES ESTATES, LLC (Population served: 100, Groundwater):
Past health violations:
MCL, Single Sample - In MAR-2010, Contaminant: Fluoride. Follow-up actions: St Other (APR-08-2010), St Compliance achieved (APR-08-2010), St Formal NOV issued (APR-08-2010)
MCL, Single Sample - Between JAN-2008 and DEC-2008, Contaminant: Fluoride. Follow-up actions: St Public Notif issued (JUL-01-2008), St Formal NOV issued (JUL-01-2008)
Past monitoring violations:
Non-Acute MRDL - Between APR-2008 and JUN-2008, Contaminant: Chlorine. Follow-up actions: St Formal NOV issued (MAY-27-2008), St Compliance achieved (MAY-27-2008), St Public Notif issued (MAY-27-2008)
Treatment Technique No Certif. Operator - In JUL-14-2006, Contaminant: DBP Stage 1. Follow-up actions: St Public Notif requested (JUL-18-2006), St Compliance achieved (JUL-18-2006), St Formal NOV issued (JUL-18-2006)
Average household size:
This city:
2.1 people
New York:
2.6 people
Percentage of family households:
This city:
49.7%
Whole state:
63.5%
Percentage of households with unmarried partners:
This city:
11.2%
Whole state:
6.8%
Likely homosexual households (counted as self-reported same-sex unmarried-partner households)
Lesbian couples: 0.7% of all households
Gay men: 0.3% of all households
9 people in other noninstitutional facilities in 2010
24 people in religious group quarters in 2000
Banks with branches in Rensselaer (2011 data):
KeyBank National Association: Rensselear County Plaza Branch at 281 Troy Road, branch established on 1993/02/25; Rensselaer Branch at 16 Second Avenue, branch established on 1825/04/01. Info updated 2008/03/03: Bank assets: $86,198.8 mil, Deposits: $64,214.8 mil, headquarters in Cleveland, OH, positive income, Commercial Lending Specialization, 1067 total offices, Holding Company: Keycorp
TrustCo Bank: East Greenbush Branch at 501 Columbia Turnpike, branch established on 1981/01/20. Info updated 2011/07/21: Bank assets: $4,250.1 mil, Deposits: $3,736.0 mil, headquarters in Glenville, NY, positive income, Mortgage Lending Specialization, 135 total offices
Bank of America, National Association: East Greenbush Branch at 501 Columbia Turnpike, branch established on 1966/03/28. Info updated 2009/11/18: Bank assets: $1,451,969.3 mil, Deposits: $1,077,176.8 mil, headquarters in Charlotte, NC, positive income, 5782 total offices, Holding Company: Bank Of America Corporation
NBT Bank, National Association: East Greenbush at 425 Columbia Turnpike, branch established on 2008/03/03. Info updated 2012/02/02: Bank assets: $5,558.5 mil, Deposits: $4,381.4 mil, headquarters in Norwich, NY, positive income, Commercial Lending Specialization, 133 total offices, Holding Company: Nbt Bancorp Inc.
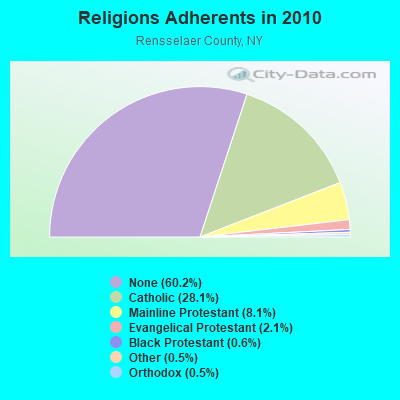
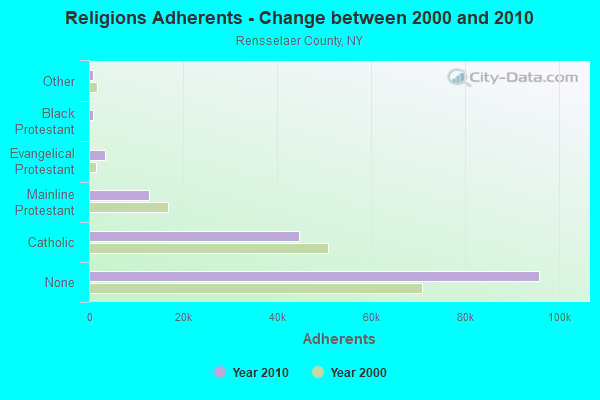
Religion statistics for Rensselaer, NY (based on Rensselaer County data)
Religion
Adherents
Congregations
Catholic
44,756
21
Mainline Protestant
12,867
70
Evangelical Protestant
3,424
37
Black Protestant
882
3
Other
847
12
Orthodox
740
3
None
95,913
-
Source: Clifford Grammich, Kirk Hadaway, Richard Houseal, Dale E.Jones, Alexei Krindatch, Richie Stanley and Richard H.Taylor. 2012. 2010 U.S.Religion Census: Religious Congregations & Membership Study. Association of Statisticians of American Religious Bodies. Jones, Dale E., et al. 2002. Congregations and Membership in the United States 2000. Nashville, TN: Glenmary Research Center. Graphs represent county-level data
FAA Registered Aircraft Manufacturers and Dealers:
1
MORAN MARK H, 47 Patroon Pointe, Rensselaer, NY 12144 Certificate: D002426 (Individual), Certificate Issue Date: 07/11/2007, Expiration Date: 07/10/2008
FAA Registered Aircraft:
6
Aircraft: CESSNA 150L (Category: Land, Seats: 2, Weight: Up to 12,499 Pounds, Speed: 90 mph), Engine: CONT MOTOR 0-200 SERIES (100 HP) (Reciprocating) N-Number: 11599, N11599, N-11599, Serial Number: 15075555, Year manufactured: 1973, Airworthiness Date: 12/22/1973, Certificate Issue Date: 03/16/1993 Registrant (Corporation): Castle Aero Inc, C/O Robert Cook / 105 Aiken Ave, Rensselaer, NY 12144
Aircraft: CESSNA 182K (Category: Land, Seats: 4, Weight: Up to 12,499 Pounds, Speed: 119 mph), Engine: CONT MOTOR O-470 SERIES (230 HP) (Reciprocating) N-Number: 2851R, N2851R, N-2851R, Serial Number: 18258451, Year manufactured: 1967, Airworthiness Date: 08/23/1967, Certificate Issue Date: 08/21/2002 Registrant (Individual): Linda M Cioffi, Po Box 9, Rensselaer, NY 12144
Aircraft: STINSON 10A (Category: Land, Seats: 3, Weight: Up to 12,499 Pounds, Speed: 90 mph), Engine: FRANKLIN 4AC199D&E SER (90 HP) (Reciprocating) N-Number: 32203, N32203, N-32203, Serial Number: 7852, Year manufactured: 1941, Airworthiness Date: 06/24/1956, Certificate Issue Date: 04/02/2010 Registrant (Individual): Robert G Cook, 105 Aiken Ave, Rensselaer, NY 12144
Aircraft: GAVITT STEPHEN M RV-9A (Category: Land, Seats: 2, Weight: Up to 12,499 Pounds), Engine: LYCOMING IO-320-D1A (160 HP) (4 Cycle) N-Number: 456SG, N456SG, N-456SG, Serial Number: 91307, Year manufactured: 2010, Airworthiness Date: 02/19/2010, Certificate Issue Date: 10/29/2009 Registrant (Individual): Stephen M Gavitt, 23 Van Dyke Dr S, Rensselaer, NY 12144
Aircraft: DJI PHANTOM 3 PROFESSION (Category: Land, Engines: 4), Engine: Electric N-Number: 7283D, N7283D, N-7283D, Serial Number: P76DCF28050695, Certificate Issue Date: 05/12/2016 Registrant (Corporation): Castle Photography Inc, 48 Rose Ln, Rensselaer, NY 12144 Deregistered:Cancel Date: 09/06/2019
Aircraft: ZARZYCKI FRANK JR BENSEN (Category: Land, Weight: Up to 12,499 Pounds), Engine: BOMBARDIER ROTAX (ALL) (Reciprocating) N-Number: 54FZ, N54FZ, N-54FZ, Serial Number: 001FZ, Year manufactured: 1990, Airworthiness Date: 09/03/1997, Certificate Issue Date: 10/24/1995 Registrant (Individual): Frank Jr Zarzycki, 1009 Washington Ave, Rensselaer, NY 12144
Home Mortgage Disclosure Act Aggregated Statistics For Year 2009 (Based on 2 full tracts)
A) FHA, FSA/RHS & VA Home Purchase Loans
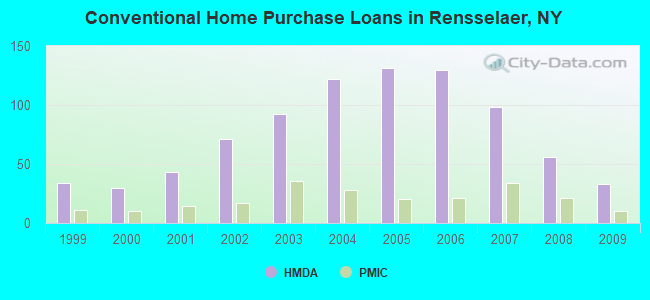
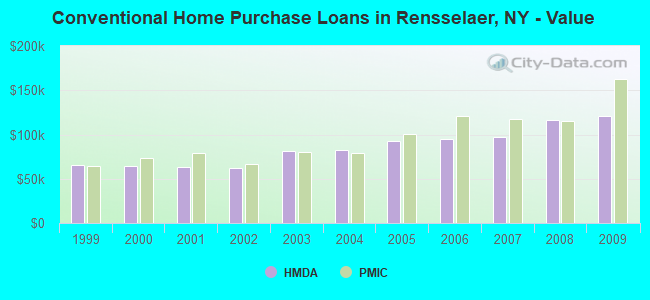
B) Conventional Home Purchase Loans
C) Refinancings
D) Home Improvement Loans
E) Loans on Dwellings For 5+ Families
F) Non-occupant Loans on < 5 Family Dwellings (A B C & D)
G) Loans On Manufactured Home Dwelling (A B C & D)
Number
Average Value
Number
Average Value
Number
Average Value
Number
Average Value
Number
Average Value
Number
Average Value
Number
Average Value
LOANS ORIGINATED
49
$135,673
33
$120,758
95
$131,379
6
$23,833
1
$266,000
10
$88,500
0
$0
APPLICATIONS APPROVED, NOT ACCEPTED
4
$170,250
3
$182,000
11
$102,727
2
$16,500
0
$0
1
$162,000
0
$0
APPLICATIONS DENIED
8
$124,500
13
$79,923
48
$104,958
21
$42,619
0
$0
13
$55,846
1
$10,000
APPLICATIONS WITHDRAWN
4
$160,250
0
$0
38
$136,421
2
$32,000
0
$0
5
$108,400
0
$0
FILES CLOSED FOR INCOMPLETENESS
0
$0
1
$120,000
4
$102,000
1
$59,000
0
$0
0
$0
0
$0
Aggregated Statistics For Year 2008 (Based on 2 full tracts)
A) FHA, FSA/RHS & VA Home Purchase Loans
B) Conventional Home Purchase Loans
C) Refinancings
D) Home Improvement Loans
F) Non-occupant Loans on < 5 Family Dwellings (A B C & D)
G) Loans On Manufactured Home Dwelling (A B C & D)
Number
Average Value
Number
Average Value
Number
Average Value
Number
Average Value
Number
Average Value
Number
Average Value
LOANS ORIGINATED
48
$130,354
56
$116,625
72
$100,833
18
$33,889
14
$89,429
1
$43,000
APPLICATIONS APPROVED, NOT ACCEPTED
2
$88,500
7
$96,571
15
$105,400
5
$32,200
0
$0
0
$0
APPLICATIONS DENIED
7
$124,429
10
$95,800
75
$108,867
55
$34,691
7
$69,143
0
$0
APPLICATIONS WITHDRAWN
4
$86,000
10
$95,900
20
$111,050
6
$60,333
6
$86,667
0
$0
FILES CLOSED FOR INCOMPLETENESS
2
$128,500
5
$97,000
12
$116,917
3
$43,333
4
$96,500
0
$0
Aggregated Statistics For Year 2007 (Based on 2 full tracts)
A) FHA, FSA/RHS & VA Home Purchase Loans
B) Conventional Home Purchase Loans
C) Refinancings
D) Home Improvement Loans
F) Non-occupant Loans on < 5 Family Dwellings (A B C & D)
G) Loans On Manufactured Home Dwelling (A B C & D)
Number
Average Value
Number
Average Value
Number
Average Value
Number
Average Value
Number
Average Value
Number
Average Value
LOANS ORIGINATED
28
$120,143
98
$96,969
99
$98,778
21
$25,714
24
$90,917
0
$0
APPLICATIONS APPROVED, NOT ACCEPTED
2
$117,000
9
$115,444
25
$91,440
8
$49,000
1
$98,000
1
$36,000
APPLICATIONS DENIED
1
$142,000
34
$89,176
114
$94,930
36
$31,417
21
$86,524
0
$0
APPLICATIONS WITHDRAWN
4
$113,750
14
$98,000
43
$93,000
5
$66,400
11
$89,636
0
$0
FILES CLOSED FOR INCOMPLETENESS
0
$0
10
$100,300
8
$96,375
1
$20,000
1
$117,000
0
$0
Aggregated Statistics For Year 2006 (Based on 2 full tracts)
A) FHA, FSA/RHS & VA Home Purchase Loans
B) Conventional Home Purchase Loans
C) Refinancings
D) Home Improvement Loans
E) Loans on Dwellings For 5+ Families
F) Non-occupant Loans on < 5 Family Dwellings (A B C & D)
G) Loans On Manufactured Home Dwelling (A B C & D)
Number
Average Value
Number
Average Value
Number
Average Value
Number
Average Value
Number
Average Value
Number
Average Value
Number
Average Value
LOANS ORIGINATED
22
$123,000
130
$95,238
108
$89,231
28
$44,107
2
$20,559,000
42
$75,143
1
$24,000
APPLICATIONS APPROVED, NOT ACCEPTED
3
$163,000
20
$92,150
33
$92,485
6
$34,500
0
$0
12
$54,500
0
$0
APPLICATIONS DENIED
3
$88,333
35
$77,257
111
$84,270
46
$33,957
0
$0
22
$65,545
1
$130,000
APPLICATIONS WITHDRAWN
3
$110,000
12
$68,250
41
$82,927
8
$50,875
0
$0
7
$50,714
0
$0
FILES CLOSED FOR INCOMPLETENESS
1
$211,000
4
$105,000
17
$97,353
0
$0
0
$0
1
$77,000
0
$0
Aggregated Statistics For Year 2005 (Based on 2 full tracts)
A) FHA, FSA/RHS & VA Home Purchase Loans
B) Conventional Home Purchase Loans
C) Refinancings
D) Home Improvement Loans
E) Loans on Dwellings For 5+ Families
F) Non-occupant Loans on < 5 Family Dwellings (A B C & D)
G) Loans On Manufactured Home Dwelling (A B C & D)
Number
Average Value
Number
Average Value
Number
Average Value
Number
Average Value
Number
Average Value
Number
Average Value
Number
Average Value
LOANS ORIGINATED
18
$103,389
131
$92,924
136
$80,199
30
$36,667
2
$215,000
54
$66,889
1
$14,000
APPLICATIONS APPROVED, NOT ACCEPTED
3
$84,333
10
$107,200
39
$73,795
4
$15,500
0
$0
7
$79,286
0
$0
APPLICATIONS DENIED
2
$131,500
23
$90,652
118
$74,093
32
$35,719
1
$350,000
21
$80,238
1
$15,000
APPLICATIONS WITHDRAWN
1
$69,000
23
$78,565
86
$93,930
13
$84,385
1
$329,000
14
$83,571
0
$0
FILES CLOSED FOR INCOMPLETENESS
1
$81,000
6
$96,000
21
$87,905
1
$153,000
0
$0
3
$66,667
0
$0
Aggregated Statistics For Year 2004 (Based on 2 full tracts)
A) FHA, FSA/RHS & VA Home Purchase Loans
B) Conventional Home Purchase Loans
C) Refinancings
D) Home Improvement Loans
F) Non-occupant Loans on < 5 Family Dwellings (A B C & D)
G) Loans On Manufactured Home Dwelling (A B C & D)
Number
Average Value
Number
Average Value
Number
Average Value
Number
Average Value
Number
Average Value
Number
Average Value
LOANS ORIGINATED
22
$94,091
122
$82,205
137
$84,438
15
$53,467
53
$67,491
1
$42,000
APPLICATIONS APPROVED, NOT ACCEPTED
0
$0
11
$76,909
38
$68,711
4
$58,250
4
$47,000
0
$0
APPLICATIONS DENIED
4
$74,000
21
$76,524
122
$68,328
25
$27,960
19
$60,895
1
$55,000
APPLICATIONS WITHDRAWN
2
$85,000
25
$69,080
111
$82,919
5
$49,000
12
$59,417
0
$0
FILES CLOSED FOR INCOMPLETENESS
0
$0
7
$93,143
17
$99,706
7
$39,429
6
$60,833
0
$0
Aggregated Statistics For Year 2003 (Based on 2 full tracts)
A) FHA, FSA/RHS & VA Home Purchase Loans
B) Conventional Home Purchase Loans
C) Refinancings
D) Home Improvement Loans
E) Loans on Dwellings For 5+ Families
F) Non-occupant Loans on < 5 Family Dwellings (A B C & D)
Number
Average Value
Number
Average Value
Number
Average Value
Number
Average Value
Number
Average Value
Number
Average Value
LOANS ORIGINATED
23
$100,174
92
$80,870
176
$80,369
8
$19,625
2
$957,500
30
$58,367
APPLICATIONS APPROVED, NOT ACCEPTED
4
$75,000
15
$80,933
27
$68,889
4
$30,000
0
$0
4
$101,500
APPLICATIONS DENIED
10
$80,600
11
$74,455
85
$69,471
16
$20,938
0
$0
10
$66,100
APPLICATIONS WITHDRAWN
2
$74,500
11
$82,364
80
$81,625
1
$15,000
0
$0
3
$73,000
FILES CLOSED FOR INCOMPLETENESS
0
$0
3
$64,333
9
$95,667
0
$0
0
$0
0
$0
Aggregated Statistics For Year 2002 (Based on 2 full tracts)
A) FHA, FSA/RHS & VA Home Purchase Loans
B) Conventional Home Purchase Loans
C) Refinancings
D) Home Improvement Loans
E) Loans on Dwellings For 5+ Families
F) Non-occupant Loans on < 5 Family Dwellings (A B C & D)
Number
Average Value
Number
Average Value
Number
Average Value
Number
Average Value
Number
Average Value
Number
Average Value
LOANS ORIGINATED
28
$72,929
71
$61,803
83
$68,711
19
$13,737
1
$205,000
29
$50,862
APPLICATIONS APPROVED, NOT ACCEPTED
0
$0
7
$65,429
28
$63,714
4
$18,750
0
$0
9
$54,111
APPLICATIONS DENIED
6
$74,500
13
$64,000
84
$57,274
15
$18,267
0
$0
10
$57,700
APPLICATIONS WITHDRAWN
6
$89,500
2
$89,500
47
$67,426
2
$17,500
0
$0
2
$72,000
FILES CLOSED FOR INCOMPLETENESS
1
$52,000
1
$67,000
9
$69,333
0
$0
0
$0
2
$61,000
Aggregated Statistics For Year 2001 (Based on 2 full tracts)
A) FHA, FSA/RHS & VA Home Purchase Loans
B) Conventional Home Purchase Loans
C) Refinancings
D) Home Improvement Loans
F) Non-occupant Loans on < 5 Family Dwellings (A B C & D)
Number
Average Value
Number
Average Value
Number
Average Value
Number
Average Value
Number
Average Value
LOANS ORIGINATED
22
$83,500
43
$63,465
71
$69,437
16
$9,750
10
$59,300
APPLICATIONS APPROVED, NOT ACCEPTED
3
$82,000
5
$65,600
14
$60,929
2
$14,000
4
$54,500
APPLICATIONS DENIED
3
$71,667
6
$62,333
84
$56,179
21
$16,429
7
$49,714
APPLICATIONS WITHDRAWN
3
$62,000
5
$58,200
50
$55,020
3
$13,000
4
$41,750
FILES CLOSED FOR INCOMPLETENESS
0
$0
3
$43,333
10
$65,900
0
$0
5
$53,200
Aggregated Statistics For Year 2000 (Based on 2 full tracts)
A) FHA, FSA/RHS & VA Home Purchase Loans
B) Conventional Home Purchase Loans
C) Refinancings
D) Home Improvement Loans
F) Non-occupant Loans on < 5 Family Dwellings (A B C & D)
Number
Average Value
Number
Average Value
Number
Average Value
Number
Average Value
Number
Average Value
LOANS ORIGINATED
33
$74,788
30
$64,433
49
$51,163
22
$16,091
8
$39,500
APPLICATIONS APPROVED, NOT ACCEPTED
0
$0
7
$48,571
6
$47,167
7
$18,714
3
$32,667
APPLICATIONS DENIED
3
$75,000
16
$41,875
72
$53,375
19
$16,000
11
$49,909
APPLICATIONS WITHDRAWN
1
$58,000
2
$56,500
43
$50,698
1
$45,000
4
$68,250
FILES CLOSED FOR INCOMPLETENESS
0
$0
0
$0
10
$70,500
0
$0
0
$0
Aggregated Statistics For Year 1999 (Based on 2 full tracts)
A) FHA, FSA/RHS & VA Home Purchase Loans
B) Conventional Home Purchase Loans
C) Refinancings
D) Home Improvement Loans
E) Loans on Dwellings For 5+ Families
F) Non-occupant Loans on < 5 Family Dwellings (A B C & D)
Detailed PMIC statistics for the following Tracts:0515.00
, 0516.00
2002 - 2018 National Fire Incident Reporting System (NFIRS) incidents
According to the data from the years 2002 - 2018 the average number of fire incidents per year is 75. The highest number of fires - 146 took place in 2015, and the least - 1 in 2010. The data has a growing trend.
When looking into fire subcategories, the most incidents belonged to: Structure Fires (64.4%), and Outside Fires (25.6%).
Fire incident types reported to NFIRS in Rensselaer, NY


 Recent articles from our blog. Our writers, many of them Ph.D. graduates or candidates, create easy-to-read articles on a wide variety of topics.

 (2.6 miles

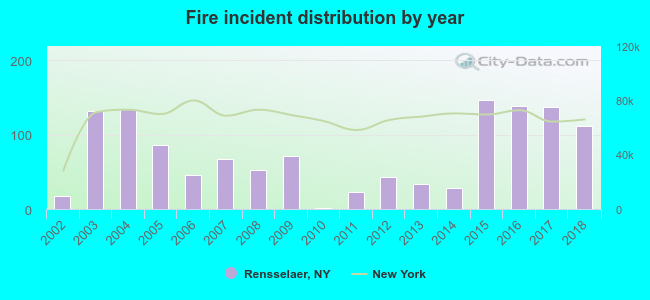 According to the data from the years 2002 - 2018 the average number of fire incidents per year is 75. The highest number of fires - 146 took place in 2015, and the least - 1 in 2010. The data has a growing trend.
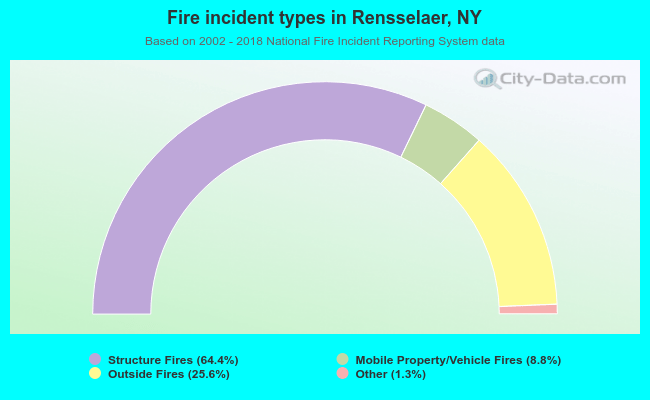 When looking into fire subcategories, the most incidents belonged to: Structure Fires (64.4%), and Outside Fires (25.6%).