Races in Rensselaer, New York (NY) Detailed Stats
Data:
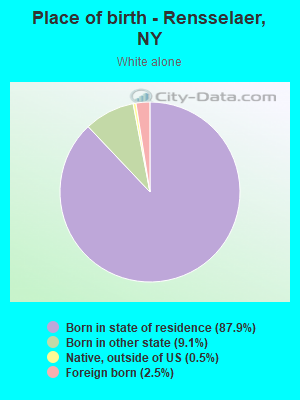
Races - White alone (%)
Races - White alone (% change since 2000)
Races - Black alone (%)
Races - Black alone (% change since 2000)
Races - American Indian alone (%)
Races - American Indian alone (% change since 2000)
Races - Asian alone (%)
Races - Asian alone (% change since 2000)
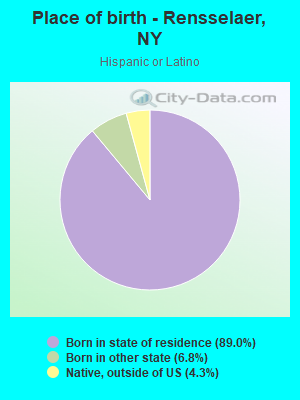
Races - Hispanic (%)
Races - Hispanic (% change since 2000)
Races - Native Hawaiian and Other Pacific Islander alone (%)
Races - Native Hawaiian and Other Pacific Islander alone (% change since 2000)
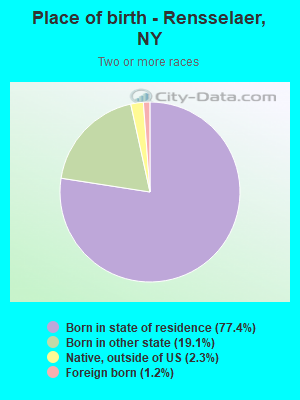
Races - Two or more races(%)
Races - Two or more races(% change since 2000)
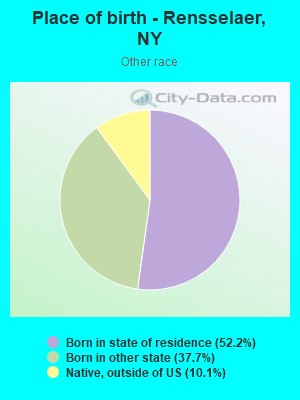
Races - Other race alone (%)
Races - Other race alone (% change since 2000)
Racial diversity
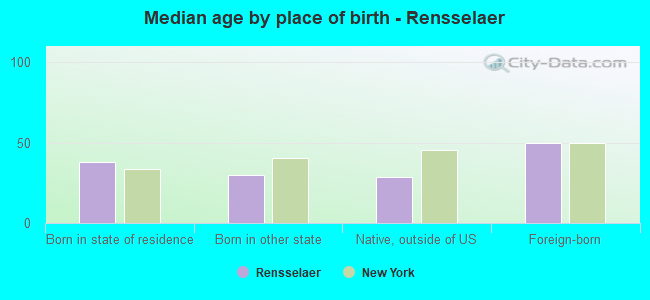
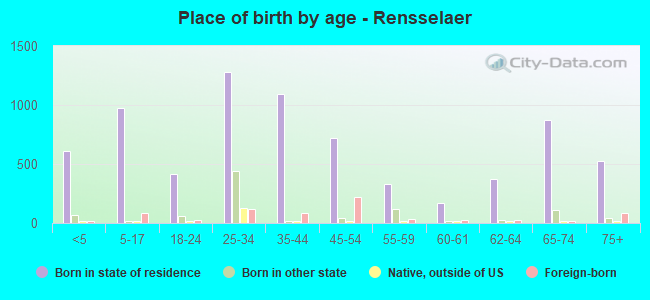
Place of birth - Born in state of residence (%)
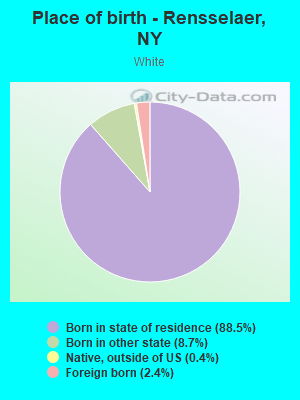
Place of birth - Born in state of residence (%) - White
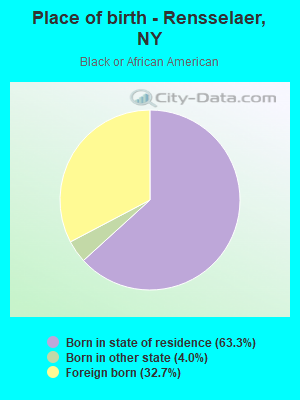
Place of birth - Born in state of residence (%) - Black or African American
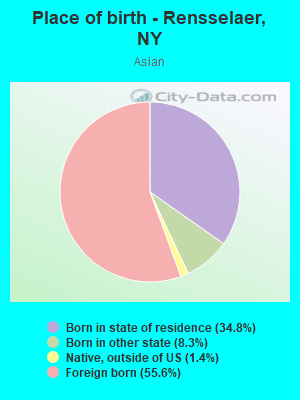
Place of birth - Born in state of residence (%) - Asian
Place of birth - Born in state of residence (%) - Hispanic or Latino
Place of birth - Born in state of residence (%) - American Indian and Alaska Native
Place of birth - Born in state of residence (%) - Multirace
Place of birth - Born in state of residence (%) - Other Race
Place of birth - Born in other state (%)
Place of birth - Born in other state (%) - White
Place of birth - Born in other state (%) - Black or African American
Place of birth - Born in other state (%) - Asian
Place of birth - Born in other state (%) - Hispanic or Latino
Place of birth - Born in other state (%) - American Indian and Alaska Native
Place of birth - Born in other state (%) - Multirace
Place of birth - Born in other state (%) - Other Race
Place of birth - Native, outside of US (%)
Place of birth - Native, outside of US (%) - White
Place of birth - Native, outside of US (%) - Black or African American
Place of birth - Native, outside of US (%) - Asian
Place of birth - Native, outside of US (%) - Hispanic or Latino
Place of birth - Native, outside of US (%) - American Indian and Alaska Native
Place of birth - Native, outside of US (%) - Multirace
Place of birth - Native, outside of US (%) - Other Race
Place of birth - Foreign born (%)
Place of birth - Foreign born (%) - White
Place of birth - Foreign born (%) - Black or African American
Place of birth - Foreign born (%) - Asian
Place of birth - Foreign born (%) - Hispanic or Latino
Place of birth - Foreign born (%) - American Indian and Alaska Native
Place of birth - Foreign born (%) - Multirace
Place of birth - Foreign born (%) - Other Race
Residents speaking English at home (%)
Residents speaking English at home - Born in the United States (%)
Residents speaking English at home - Native, born elsewhere (%)
Residents speaking English at home - Foreign born (%)
Residents speaking Spanish at home (%)
Residents speaking Spanish at home - Born in the United States (%)
Residents speaking Spanish at home - Native, born elsewhere (%)
Residents speaking Spanish at home - Foreign born (%)
Residents speaking other language at home (%)
Residents speaking other language at home - Born in the United States (%)
Residents speaking other language at home - Native, born elsewhere (%)
Residents speaking other language at home - Foreign born (%)
Marital status - Never married (%)
Marital status - Now married (%)
Marital status - Separated (%)
Marital status - Widowed (%)
Marital status - Divorced (%)
Ancestries Reported - Arab (%)
Ancestries Reported - Czech (%)
Ancestries Reported - Danish (%)
Ancestries Reported - Dutch (%)
Ancestries Reported - English (%)
Ancestries Reported - French (%)
Ancestries Reported - French Canadian (%)
Ancestries Reported - German (%)
Ancestries Reported - Greek (%)
Ancestries Reported - Hungarian (%)
Ancestries Reported - Irish (%)
Ancestries Reported - Italian (%)
Ancestries Reported - Lithuanian (%)
Ancestries Reported - Norwegian (%)
Ancestries Reported - Polish (%)
Ancestries Reported - Portuguese (%)
Ancestries Reported - Russian (%)
Ancestries Reported - Scotch-Irish (%)
Ancestries Reported - Scottish (%)
Ancestries Reported - Slovak (%)
Ancestries Reported - Subsaharan African (%)
Ancestries Reported - Swedish (%)
Ancestries Reported - Swiss (%)
Ancestries Reported - Ukrainian (%)
Ancestries Reported - United States (%)
Ancestries Reported - Welsh (%)
Ancestries Reported - West Indian (%)
Ancestries Reported - Other (%)
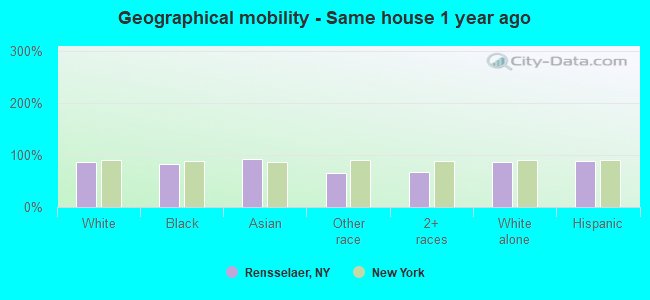
Geographical mobility - Same house 1 year ago (%)
Geographical mobility - Same house 1 year ago (%) - White
Geographical mobility - Same house 1 year ago (%) - Black or African American
Geographical mobility - Same house 1 year ago (%) - Asian
Geographical mobility - Same house 1 year ago (%) - Hispanic or Latino
Geographical mobility - Same house 1 year ago (%) - American Indian and Alaska Native
Geographical mobility - Same house 1 year ago (%) - Multirace
Geographical mobility - Same house 1 year ago (%) - Other Race
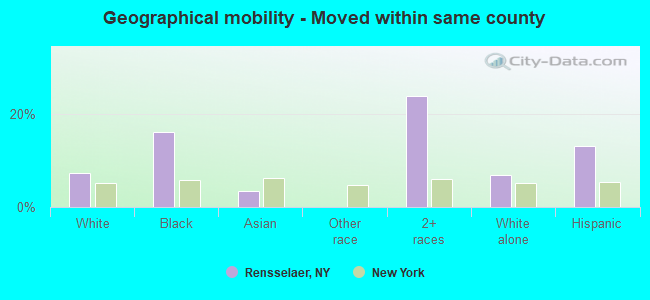
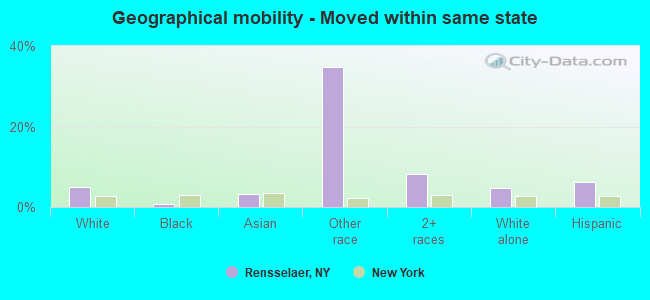
Geographical mobility - Moved within same county (%)
Geographical mobility - Moved within same county (%) - White
Geographical mobility - Moved within same county (%) - Black or African American
Geographical mobility - Moved within same county (%) - Asian
Geographical mobility - Moved within same county (%) - Hispanic or Latino
Geographical mobility - Moved within same county (%) - American Indian and Alaska Native
Geographical mobility - Moved within same county (%) - Multirace
Geographical mobility - Moved within same county (%) - Other Race
Geographical mobility - Moved from different county within same state (%)
Geographical mobility - Moved from different county within same state (%) - White
Geographical mobility - Moved from different county within same state (%) - Black or African American
Geographical mobility - Moved from different county within same state (%) - Asian
Geographical mobility - Moved from different county within same state (%) - Hispanic or Latino
Geographical mobility - Moved from different county within same state (%) - American Indian and Alaska Native
Geographical mobility - Moved from different county within same state (%) - Multirace
Geographical mobility - Moved from different county within same state (%) - Other Race
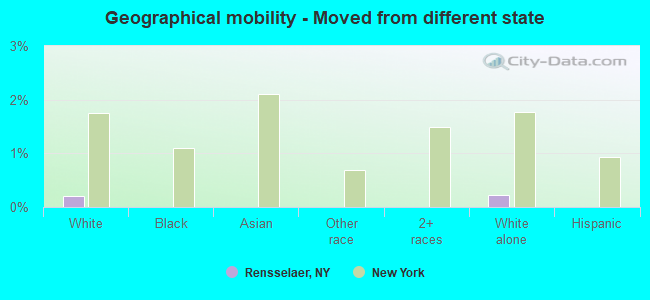
Geographical mobility - Moved from different state (%)
Geographical mobility - Moved from different state (%) - White
Geographical mobility - Moved from different state (%) - Black or African American
Geographical mobility - Moved from different state (%) - Asian
Geographical mobility - Moved from different state (%) - Hispanic or Latino
Geographical mobility - Moved from different state (%) - American Indian and Alaska Native
Geographical mobility - Moved from different state (%) - Multirace
Geographical mobility - Moved from different state (%) - Other Race
Geographical mobility - Moved from abroad (%)
Geographical mobility - Moved from abroad (%) - White
Geographical mobility - Moved from abroad (%) - Black or African American
Geographical mobility - Moved from abroad (%) - Asian
Geographical mobility - Moved from abroad (%) - Hispanic or Latino
Geographical mobility - Moved from abroad (%) - American Indian and Alaska Native
Geographical mobility - Moved from abroad (%) - Multirace
Geographical mobility - Moved from abroad (%) - Other Race
Place of birth for the foreign-born population - Ireland (%)
Place of birth for the foreign-born population - Denmark (%)
Place of birth for the foreign-born population - Norway (%)
Place of birth for the foreign-born population - Sweden (%)
Place of birth for the foreign-born population - United Kingdom (%)
Place of birth for the foreign-born population - England (%)
Place of birth for the foreign-born population - Scotland (%)
Place of birth for the foreign-born population - Other Northern Europe (%)
Place of birth for the foreign-born population - Austria (%)
Place of birth for the foreign-born population - Belgium (%)
Place of birth for the foreign-born population - France (%)
Place of birth for the foreign-born population - Germany (%)
Place of birth for the foreign-born population - Netherlands (%)
Place of birth for the foreign-born population - Switzerland (%)
Place of birth for the foreign-born population - Other Western Europe (%)
Place of birth for the foreign-born population - Greece (%)
Place of birth for the foreign-born population - Italy (%)
Place of birth for the foreign-born population - Portugal (%)
Place of birth for the foreign-born population - Spain (%)
Place of birth for the foreign-born population - Other Southern Europe (%)
Place of birth for the foreign-born population - Albania (%)
Place of birth for the foreign-born population - Belarus (%)
Place of birth for the foreign-born population - Bosnia and Herzegovina (%)
Place of birth for the foreign-born population - Bulgaria (%)
Place of birth for the foreign-born population - Croatia (%)
Place of birth for the foreign-born population - Czechoslovakia (%)
Place of birth for the foreign-born population - Hungary (%)
Place of birth for the foreign-born population - Latvia (%)
Place of birth for the foreign-born population - Lithuania (%)
Place of birth for the foreign-born population - North Macedonia (Macedonia) (%)
Place of birth for the foreign-born population - Moldova (%)
Place of birth for the foreign-born population - Poland (%)
Place of birth for the foreign-born population - Romania (%)
Place of birth for the foreign-born population - Russia (%)
Place of birth for the foreign-born population - Serbia (%)
Place of birth for the foreign-born population - Ukraine (%)
Place of birth for the foreign-born population - Other Eastern Europe (%)
Place of birth for the foreign-born population - China (%)
Place of birth for the foreign-born population - Hong Kong (%)
Place of birth for the foreign-born population - Taiwan (%)
Place of birth for the foreign-born population - Japan (%)
Place of birth for the foreign-born population - Korea (%)
Place of birth for the foreign-born population - Other Eastern Asia (%)
Place of birth for the foreign-born population - Afghanistan (%)
Place of birth for the foreign-born population - Bangladesh (%)
Place of birth for the foreign-born population - India (%)
Place of birth for the foreign-born population - Iran (%)
Place of birth for the foreign-born population - Kazakhstan (%)
Place of birth for the foreign-born population - Nepal (%)
Place of birth for the foreign-born population - Pakistan (%)
Place of birth for the foreign-born population - Sri Lanka (%)
Place of birth for the foreign-born population - Uzbekistan (%)
Place of birth for the foreign-born population - Other South Central Asia (%)
Place of birth for the foreign-born population - Burma (%)
Place of birth for the foreign-born population - Cambodia (%)
Place of birth for the foreign-born population - Indonesia (%)
Place of birth for the foreign-born population - Laos (%)
Place of birth for the foreign-born population - Malaysia (%)
Place of birth for the foreign-born population - Philippines (%)
Place of birth for the foreign-born population - Singapore (%)
Place of birth for the foreign-born population - Thailand (%)
Place of birth for the foreign-born population - Vietnam (%)
Place of birth for the foreign-born population - Other South Eastern Asia (%)
Place of birth for the foreign-born population - Armenia (%)
Place of birth for the foreign-born population - Iraq (%)
Place of birth for the foreign-born population - Israel (%)
Place of birth for the foreign-born population - Jordan (%)
Place of birth for the foreign-born population - Kuwait (%)
Place of birth for the foreign-born population - Lebanon (%)
Place of birth for the foreign-born population - Saudi Arabia (%)
Place of birth for the foreign-born population - Syria (%)
Place of birth for the foreign-born population - Turkey (%)
Place of birth for the foreign-born population - Yemen (%)
Place of birth for the foreign-born population - Other Western Asia (%)
Place of birth for the foreign-born population - Eritrea (%)
Place of birth for the foreign-born population - Ethiopia (%)
Place of birth for the foreign-born population - Kenya (%)
Place of birth for the foreign-born population - Somalia (%)
Place of birth for the foreign-born population - Uganda (%)
Place of birth for the foreign-born population - Zimbabwe (%)
Place of birth for the foreign-born population - Other Eastern Africa (%)
Place of birth for the foreign-born population - Cameroon (%)
Place of birth for the foreign-born population - Congo (%)
Place of birth for the foreign-born population - Democratic Republic of Congo (Zaire) (%)
Place of birth for the foreign-born population - Other Middle Africa (%)
Place of birth for the foreign-born population - Egypt (%)
Place of birth for the foreign-born population - Morocco (%)
Place of birth for the foreign-born population - Sudan (%)
Place of birth for the foreign-born population - Other Northern Africa (%)
Place of birth for the foreign-born population - South Africa (%)
Place of birth for the foreign-born population - Other Southern Africa (%)
Place of birth for the foreign-born population - Cabo Verde (%)
Place of birth for the foreign-born population - Ghana (%)
Place of birth for the foreign-born population - Liberia (%)
Place of birth for the foreign-born population - Nigeria (%)
Place of birth for the foreign-born population - Senegal (%)
Place of birth for the foreign-born population - Sierra Leone (%)
Place of birth for the foreign-born population - Other Western Africa (%)
Place of birth for the foreign-born population - Australia (%)
Place of birth for the foreign-born population - New Zealand (%)
Place of birth for the foreign-born population - Fiji (%)
Place of birth for the foreign-born population - Micronesia (%)
Place of birth for the foreign-born population - Bahamas (%)
Place of birth for the foreign-born population - Barbados (%)
Place of birth for the foreign-born population - Cuba (%)
Place of birth for the foreign-born population - Dominica (%)
Place of birth for the foreign-born population - Dominican Republic (%)
Place of birth for the foreign-born population - Grenada (%)
Place of birth for the foreign-born population - Haiti (%)
Place of birth for the foreign-born population - Jamaica (%)
Place of birth for the foreign-born population - St. Vincent and the Grenadines (%)
Place of birth for the foreign-born population - Trinidad and Tobago (%)
Place of birth for the foreign-born population - West Indies (%)
Place of birth for the foreign-born population - Other Caribbean (%)
Place of birth for the foreign-born population - Belize (%)
Place of birth for the foreign-born population - Costa Rica (%)
Place of birth for the foreign-born population - El Salvador (%)
Place of birth for the foreign-born population - Guatemala (%)
Place of birth for the foreign-born population - Honduras (%)
Place of birth for the foreign-born population - Mexico (%)
Place of birth for the foreign-born population - Nicaragua (%)
Place of birth for the foreign-born population - Panama (%)
Place of birth for the foreign-born population - Other Central America (%)
Place of birth for the foreign-born population - Argentina (%)
Place of birth for the foreign-born population - Bolivia (%)
Place of birth for the foreign-born population - Brazil (%)
Place of birth for the foreign-born population - Chile (%)
Place of birth for the foreign-born population - Colombia (%)
Place of birth for the foreign-born population - Ecuador (%)
Place of birth for the foreign-born population - Guyana (%)
Place of birth for the foreign-born population - Peru (%)
Place of birth for the foreign-born population - Uruguay (%)
Place of birth for the foreign-born population - Venezuela (%)
Place of birth for the foreign-born population - Other South America (%)
Place of birth for the foreign-born population - Canada (%)
Place of birth for the foreign-born population - Other Northern America (%)
Place of birth for the foreign-born population - Other (%)
Latest news about races in Rensselaer, NY collected exclusively by city-data.com from local newspapers, TV, and radio stations
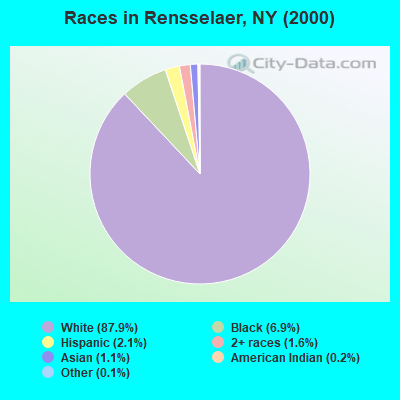
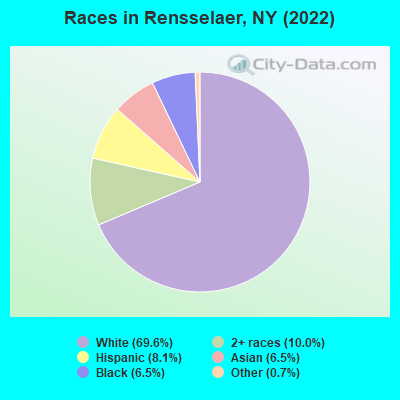
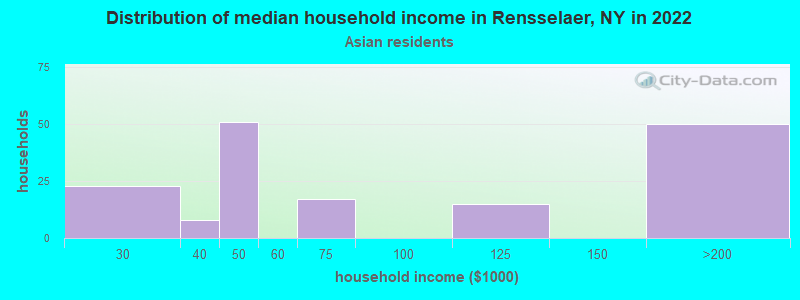
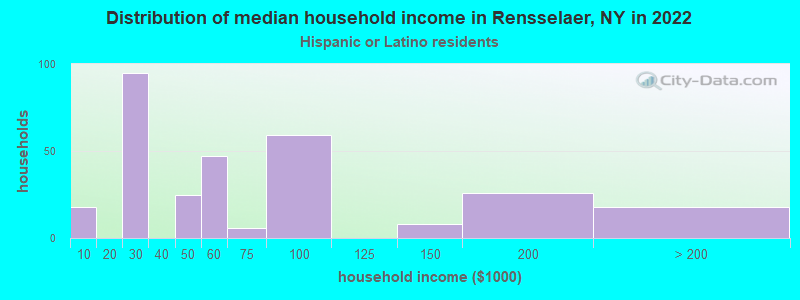
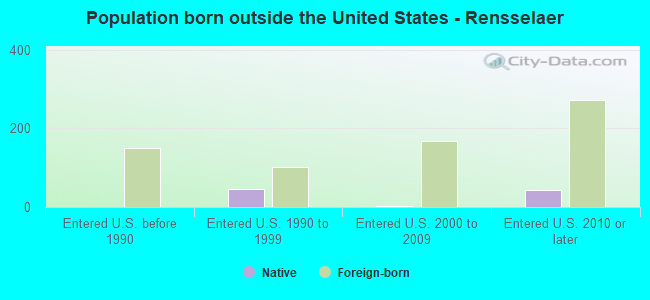
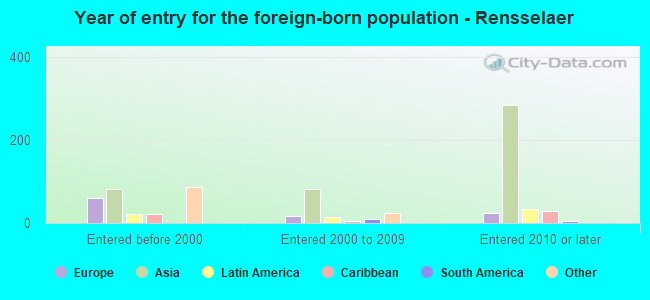
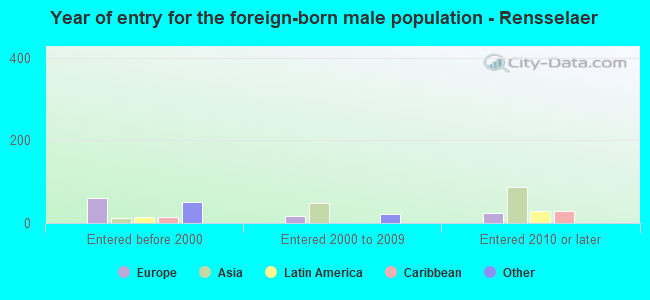
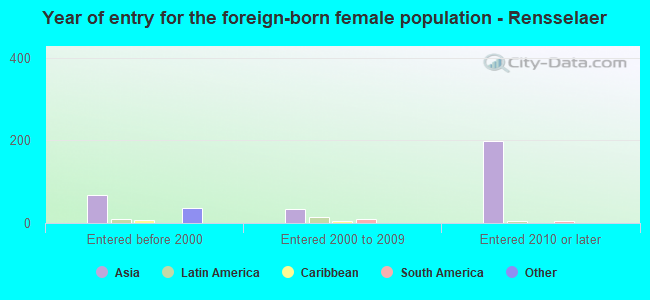
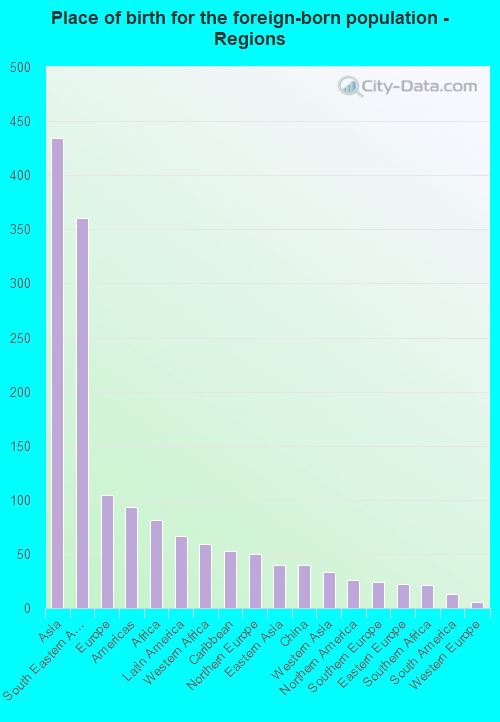
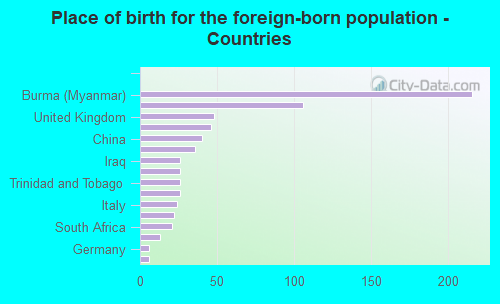
According to 2022 data, the most numerous races in Rensselaer, NY are White alone (6,397 residents), Hispanic (748 residents), and Black alone (593 residents). 87.6% of Rensselaer residents speak English at home. 7.8% of Rensselaer, NY residents are foreign-born (4.7% born in Asia, 1.1% born in Europe, 0.9% born in Africa), which is 183.1% less than the foreign-born rate of 22.0% across the entire state of New York.
Race distribution in Rensselaer
2000 2022
11,760,981 62.0% White alone 2,867,583 15.1% Hispanic 2,812,623 14.8% Black alone 1,035,926 5.5% Asian alone 366,116 1.9% Two or more races 75,499 0.4% Other race alone 52,499 0.3% American Indian alone 5,230 0.03% Native Hawaiian and Other
10,408,933 52.9% White alone 3,867,299 19.7% Hispanic 2,633,840 13.4% Black alone 1,776,286 9.0% Asian alone 732,670 3.7% Two or more races 216,110 1.1% Other race alone 35,082 0.2% American Indian alone 6,931 0.04% Native Hawaiian and Other
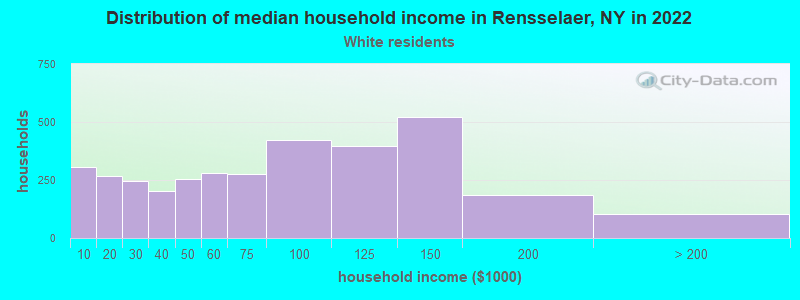
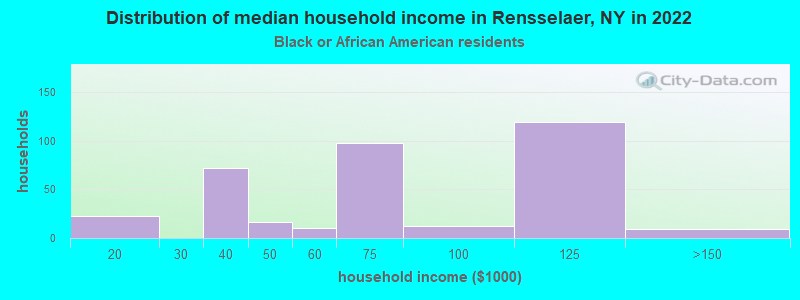
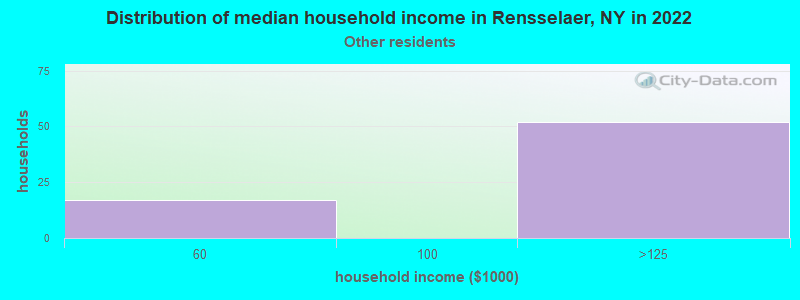
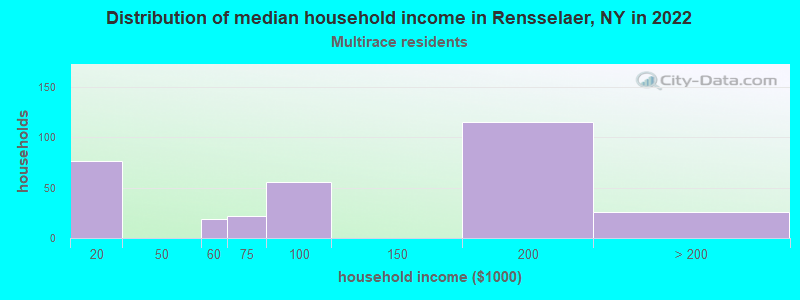
Income and house value in Rensselaer Median household income in 2022 $73,187 White non-Hispanic householders$59,244 Black householders$50,675 Hispanic or Latino race householdersMedian 2022 house value $222,810 White Non-Hispanic householders$277,635 Black or African American householders $326,249 Asian householders$246,577 Two or more races householders$229,562 Hispanic or Latino householders
Median age by race in Rensselaer
43.6 Median age for White residents43.0 43.4 37.5 Median age for Black or African American residents40.4 34.6 -556,521,738.6 Median age for American Indian / Alaska Native residents-399,999,999.6 -642,115,202.4 21.4 Median age for Asian residents31.2 28.6 -666,666,666.0 Median age for Native Hawaiian / Pacific Islander residents-666,666,666.0 -666,666,666.0 29.9 Median age for Other race residents33.4 -593,311,757.8 16.4 Median age for Two or more races residents21.3 8.6 44.4 Median age for White alone residents43.8 44.7 28.7 Median age for Hispanic or Latino residents28.3 25.2
Owner/renter occupied households by race in Rensselaer
House owners and renters - White residents 1,583 46.2% Owner occupied1,844 53.8% Renter occupiedHouse owners and renters - Black or African American residents 175 47.7% Owner occupied192 52.3% Renter occupiedHouse owners and renters - Asian residents 41 36.7% Owner occupied71 63.3% Renter occupiedHouse owners and renters - Other race residents 12 9.4% Owner occupied115 90.6% Renter occupiedHouse owners and renters - Two or more races residents 56 15.5% Owner occupied308 84.5% Renter occupiedHouse owners and renters - White alone residents 1,531 47.5% Owner occupied1,693 52.5% Renter occupiedHouse owners and renters - Hispanic or Latino residents 80 24.3% Owner occupied250 75.7% Renter occupied
Language usage in Rensselaer
English speakers - Total 87.6% of residents of Rensselaer speak English at home.
3.4% of residents speak Spanish at home 217 74.6% Speak English very well74 25.4% Speak English less than very well8.5% of residents speak other language at home 455 63.2% Speak English very well265 36.8% Speak English less than very well
English speakers - Born in the United States 89.8% of residents of Rensselaer speak English at home.
0.4% of residents speak Spanish at home 3 100.0% Speak English very well14.3% of residents speak other language at home 119 100.0% Speak English very well
English speakers - Native, born elsewhere 26.5% of residents of Rensselaer speak English at home.
65.1% of residents speak Spanish at home 9 16.7% Speak English very well45 83.3% Speak English less than very well16.9% of residents speak other language at home 14 100.0% Speak English very well
English speakers - Foreign-born 29.7% of residents of Rensselaer speak English at home.
3.0% of residents speak Spanish at home 21 100.0% Speak English less than very well58.3% of residents speak other language at home 189 45.7% Speak English very well225 54.3% Speak English less than very well
White (Caucasian) - Speak only English Native:
97.5% (6,198)Foreign-born:
63.8% (103)
White (Caucasian) - Speak another language Native:
2.5% (159)Foreign-born:
41.1% (66)
Black or African American - Speak only English Native:
94.6% (374)Foreign-born:
56.5% (123)
Black or African American - Speak another language Native:
5.4% (21)Foreign-born:
46.3% (101)
Asian - Speak only English Native:
33.9% (55)Foreign-born:
7.2% (21)
Asian - Speak another language Native:
62.8% (101)Foreign-born:
87.2% (259)
Two or more races - Speak only English Native:
77.1% (554)Foreign-born:
8.8% (4)
Two or more races - Speak another language Native:
22.1% (159)Foreign-born:
92.0% (41)
White alone - Speak only English Native:
97.5% (5,886)Foreign-born:
61.9% (98)
White alone - Speak another language Native:
2.6% (155)Foreign-born:
42.2% (67)
Foreign-born residents in Rensselaer 714 residents are foreign born (4.7% Asia , 1.1% Europe , 0.9% Africa ).
This city:
7.8%New York:
22.6%
Marital status for residents in Rensselaer Marital status - White (Caucasian) population 15 years and over
Males 48.0% Never married35.9% Now married3.1% Separated5.7% Widowed7.3% DivorcedFemales 34.9% Never married38.9% Now married2.8% Separated7.5% Widowed16.0% DivorcedWomen who gave birth in the past 12 months Now married:
28.6% (77)Unmarried:
71.4% (191)
Women who did not give birth in the past 12 months Now married:
35.2% (470)Unmarried:
64.8% (864)
Marital status - Black or African American population 15 years and over
Males 41.5% Never married58.5% Now married0.0% Separated0.0% Widowed0.0% DivorcedFemales 55.8% Never married20.6% Now married5.3% Separated3.3% Widowed15.0% DivorcedWomen who gave birth in the past 12 months Now married:
0.0% (0)Unmarried:
100.0% (27)
Women who did not give birth in the past 12 months Now married:
12.6% (15)Unmarried:
87.4% (101)
Marital status - Asian population 15 years and over
Males 35.3% Never married58.8% Now married0.0% Separated1.5% Widowed4.4% DivorcedFemales 30.2% Never married62.4% Now married0.0% Separated7.5% Widowed0.0% DivorcedWomen who gave birth in the past 12 months Now married:
100.0% (51)Unmarried:
0.0% (0)
Women who did not give birth in the past 12 months Now married:
58.4% (107)Unmarried:
41.6% (77)
Marital status - Other race population 15 years and over
Males 57.3% Never married42.7% Now married0.0% Separated0.0% Widowed0.0% DivorcedFemales 0.0% Never married100.0% Now married0.0% Separated0.0% Widowed0.0% DivorcedWomen who did not give birth in the past 12 months Now married:
100.0% (11)Unmarried:
0.0% (0)
Marital status - Two or more races population 15 years and over
Males 81.9% Never married17.7% Now married0.4% Separated0.0% Widowed0.0% DivorcedFemales 53.4% Never married40.6% Now married0.0% Separated0.0% Widowed6.0% DivorcedWomen who gave birth in the past 12 months Now married:
100.0% (8)Unmarried:
0.0% (0)
Women who did not give birth in the past 12 months Now married:
40.3% (63)Unmarried:
59.7% (94)
Marital status - White alone, not Hispanic / Latino population 15 years and over
Males 47.3% Never married37.0% Now married3.3% Separated6.1% Widowed6.4% DivorcedFemales 33.9% Never married38.6% Now married2.9% Separated7.8% Widowed16.7% DivorcedWomen who gave birth in the past 12 months Now married:
9.8% (21)Unmarried:
90.2% (194)
Women who did not give birth in the past 12 months Now married:
37.2% (476)Unmarried:
62.8% (805)
Marital status - Hispanic or Latino population 15 years and over
Males 57.2% Never married30.0% Now married0.0% Separated0.0% Widowed12.8% DivorcedFemales 52.5% Never married47.5% Now married0.0% Separated0.0% Widowed0.0% DivorcedWomen who gave birth in the past 12 months Now married:
100.0% (64)Unmarried:
0.0% (0)
Women who did not give birth in the past 12 months Now married:
21.8% (28)Unmarried:
78.2% (102)
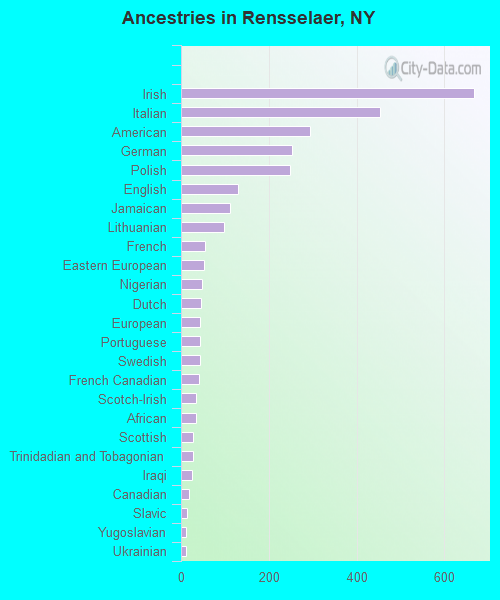
Ancestries in Rensselaer
668 16.9% Irish453 11.5% Italian294 7.4% American252 6.4% German248 6.3% Polish130 3.3% English112 2.8% Jamaican99 2.5% Lithuanian54 1.4% French53 1.3% Eastern European48 1.2% Nigerian46 1.2% Dutch44 1.1% European43 1.1% Portuguese43 1.1% Swedish40 1.0% French Canadian35 0.9% Scotch-Irish34 0.9% African27 0.7% Scottish27 0.7% Trinidadian and Tobagonian25 0.6% Iraqi19 0.5% Canadian13 0.3% Slavic12 0.3% Yugoslavian11 0.3% Ukrainian8 0.2% Egyptian8 0.2% Russian
Children Nativity (place of birth) in Rensselaer
Children under 6 years - Living with two parents Both parents native 96 100.0% NativeBoth parents foreign-born 176 100.0% NativeOne native, one foreign-born parent 30 100.0% NativeChildren under 6 years - Living with one parent Native parent 288 100.0% NativeChildren 6 to 17 years - Living with two parents Both parents native 494 100.0% NativeBoth parents foreign-born 96 61.2% Native61 38.8% Foreign-bornOne native, one foreign-born parent 61 100.0% NativeChildren 6 to 17 years - Living with one parent Native parent 264 100.0% NativeForeign-born parent 14 50.4% Native14 49.6% Foreign-born