North Salt Lake, Utah Submit your own pictures of this city and show them to the world
OSM Map
General Map
Google Map
MSN Map
OSM Map
General Map
Google Map
MSN Map
OSM Map
General Map
Google Map
MSN Map
OSM Map
General Map
Google Map
MSN Map
Please wait while loading the map...
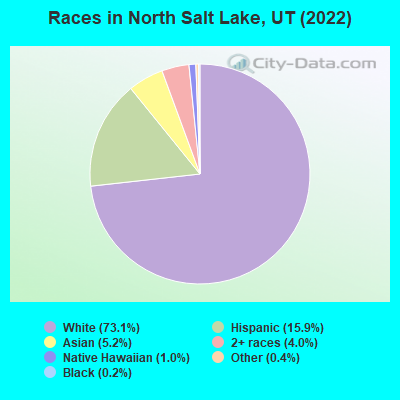
Population in 2022: 22,537 (100% urban, 0% rural). Population change since 2000: +157.6%Males: 11,184 Females: 11,353
March 2022 cost of living index in North Salt Lake: 89.7 (less than average, U.S. average is 100) Percentage of residents living in poverty in 2022: 3.6%for White Non-Hispanic residents , 3.1% for Hispanic or Latino residents , 55.9% for Native Hawaiian and other Pacific Islander residents , 11.5% for other race residents , 2.8% for two or more races residents )
Profiles of local businesses
Business Search - 14 Million verified businesses
Data:
Median household income ($)
Median household income (% change since 2000)
Household income diversity
Ratio of average income to average house value (%)
Ratio of average income to average rent
Median household income ($) - White
Median household income ($) - Black or African American
Median household income ($) - Asian
Median household income ($) - Hispanic or Latino
Median household income ($) - American Indian and Alaska Native
Median household income ($) - Multirace
Median household income ($) - Other Race
Median household income for houses/condos with a mortgage ($)
Median household income for apartments without a mortgage ($)
Races - White alone (%)
Races - White alone (% change since 2000)
Races - Black alone (%)
Races - Black alone (% change since 2000)
Races - American Indian alone (%)
Races - American Indian alone (% change since 2000)
Races - Asian alone (%)
Races - Asian alone (% change since 2000)
Races - Hispanic (%)
Races - Hispanic (% change since 2000)
Races - Native Hawaiian and Other Pacific Islander alone (%)
Races - Native Hawaiian and Other Pacific Islander alone (% change since 2000)
Races - Two or more races (%)
Races - Two or more races (% change since 2000)
Races - Other race alone (%)
Races - Other race alone (% change since 2000)
Racial diversity
Unemployment (%)
Unemployment (% change since 2000)
Unemployment (%) - White
Unemployment (%) - Black or African American
Unemployment (%) - Asian
Unemployment (%) - Hispanic or Latino
Unemployment (%) - American Indian and Alaska Native
Unemployment (%) - Multirace
Unemployment (%) - Other Race
Population density (people per square mile)
Population - Males (%)
Population - Females (%)
Population - Males (%) - White
Population - Males (%) - Black or African American
Population - Males (%) - Asian
Population - Males (%) - Hispanic or Latino
Population - Males (%) - American Indian and Alaska Native
Population - Males (%) - Multirace
Population - Males (%) - Other Race
Population - Females (%) - White
Population - Females (%) - Black or African American
Population - Females (%) - Asian
Population - Females (%) - Hispanic or Latino
Population - Females (%) - American Indian and Alaska Native
Population - Females (%) - Multirace
Population - Females (%) - Other Race
Coronavirus confirmed cases (Apr 27, 2024)
Deaths caused by coronavirus (Apr 27, 2024)
Coronavirus confirmed cases (per 100k population) (Apr 27, 2024)
Deaths caused by coronavirus (per 100k population) (Apr 27, 2024)
Daily increase in number of cases (Apr 27, 2024)
Weekly increase in number of cases (Apr 27, 2024)
Cases doubled (in days) (Apr 27, 2024)
Hospitalized patients (Apr 18, 2022)
Negative test results (Apr 18, 2022)
Total test results (Apr 18, 2022)
COVID Vaccine doses distributed (per 100k population) (Sep 19, 2023)
COVID Vaccine doses administered (per 100k population) (Sep 19, 2023)
COVID Vaccine doses distributed (Sep 19, 2023)
COVID Vaccine doses administered (Sep 19, 2023)
Likely homosexual households (%)
Likely homosexual households (% change since 2000)
Likely homosexual households - Lesbian couples (%)
Likely homosexual households - Lesbian couples (% change since 2000)
Likely homosexual households - Gay men (%)
Likely homosexual households - Gay men (% change since 2000)
Cost of living index
Median gross rent ($)
Median contract rent ($)
Median monthly housing costs ($)
Median house or condo value ($)
Median house or condo value ($ change since 2000)
Mean house or condo value by units in structure - 1, detached ($)
Mean house or condo value by units in structure - 1, attached ($)
Mean house or condo value by units in structure - 2 ($)
Mean house or condo value by units in structure by units in structure - 3 or 4 ($)
Mean house or condo value by units in structure - 5 or more ($)
Mean house or condo value by units in structure - Boat, RV, van, etc. ($)
Mean house or condo value by units in structure - Mobile home ($)
Median house or condo value ($) - White
Median house or condo value ($) - Black or African American
Median house or condo value ($) - Asian
Median house or condo value ($) - Hispanic or Latino
Median house or condo value ($) - American Indian and Alaska Native
Median house or condo value ($) - Multirace
Median house or condo value ($) - Other Race
Median resident age
Resident age diversity
Median resident age - Males
Median resident age - Females
Median resident age - White
Median resident age - Black or African American
Median resident age - Asian
Median resident age - Hispanic or Latino
Median resident age - American Indian and Alaska Native
Median resident age - Multirace
Median resident age - Other Race
Median resident age - Males - White
Median resident age - Males - Black or African American
Median resident age - Males - Asian
Median resident age - Males - Hispanic or Latino
Median resident age - Males - American Indian and Alaska Native
Median resident age - Males - Multirace
Median resident age - Males - Other Race
Median resident age - Females - White
Median resident age - Females - Black or African American
Median resident age - Females - Asian
Median resident age - Females - Hispanic or Latino
Median resident age - Females - American Indian and Alaska Native
Median resident age - Females - Multirace
Median resident age - Females - Other Race
Commute - mean travel time to work (minutes)
Travel time to work - Less than 5 minutes (%)
Travel time to work - Less than 5 minutes (% change since 2000)
Travel time to work - 5 to 9 minutes (%)
Travel time to work - 5 to 9 minutes (% change since 2000)
Travel time to work - 10 to 19 minutes (%)
Travel time to work - 10 to 19 minutes (% change since 2000)
Travel time to work - 20 to 29 minutes (%)
Travel time to work - 20 to 29 minutes (% change since 2000)
Travel time to work - 30 to 39 minutes (%)
Travel time to work - 30 to 39 minutes (% change since 2000)
Travel time to work - 40 to 59 minutes (%)
Travel time to work - 40 to 59 minutes (% change since 2000)
Travel time to work - 60 to 89 minutes (%)
Travel time to work - 60 to 89 minutes (% change since 2000)
Travel time to work - 90 or more minutes (%)
Travel time to work - 90 or more minutes (% change since 2000)
Marital status - Never married (%)
Marital status - Now married (%)
Marital status - Separated (%)
Marital status - Widowed (%)
Marital status - Divorced (%)
Median family income ($)
Median family income (% change since 2000)
Median non-family income ($)
Median non-family income (% change since 2000)
Median per capita income ($)
Median per capita income (% change since 2000)
Median family income ($) - White
Median family income ($) - Black or African American
Median family income ($) - Asian
Median family income ($) - Hispanic or Latino
Median family income ($) - American Indian and Alaska Native
Median family income ($) - Multirace
Median family income ($) - Other Race
Median year house/condo built
Median year apartment built
Year house built - Built 2005 or later (%)
Year house built - Built 2000 to 2004 (%)
Year house built - Built 1990 to 1999 (%)
Year house built - Built 1980 to 1989 (%)
Year house built - Built 1970 to 1979 (%)
Year house built - Built 1960 to 1969 (%)
Year house built - Built 1950 to 1959 (%)
Year house built - Built 1940 to 1949 (%)
Year house built - Built 1939 or earlier (%)
Average household size
Household density (households per square mile)
Average household size - White
Average household size - Black or African American
Average household size - Asian
Average household size - Hispanic or Latino
Average household size - American Indian and Alaska Native
Average household size - Multirace
Average household size - Other Race
Occupied housing units (%)
Vacant housing units (%)
Owner occupied housing units (%)
Renter occupied housing units (%)
Vacancy status - For rent (%)
Vacancy status - For sale only (%)
Vacancy status - Rented or sold, not occupied (%)
Vacancy status - For seasonal, recreational, or occasional use (%)
Vacancy status - For migrant workers (%)
Vacancy status - Other vacant (%)
Residents with income below the poverty level (%)
Residents with income below 50% of the poverty level (%)
Children below poverty level (%)
Poor families by family type - Married-couple family (%)
Poor families by family type - Male, no wife present (%)
Poor families by family type - Female, no husband present (%)
Poverty status for native-born residents (%)
Poverty status for foreign-born residents (%)
Poverty among high school graduates not in families (%)
Poverty among people who did not graduate high school not in families (%)
Residents with income below the poverty level (%) - White
Residents with income below the poverty level (%) - Black or African American
Residents with income below the poverty level (%) - Asian
Residents with income below the poverty level (%) - Hispanic or Latino
Residents with income below the poverty level (%) - American Indian and Alaska Native
Residents with income below the poverty level (%) - Multirace
Residents with income below the poverty level (%) - Other Race
Air pollution - Air Quality Index (AQI)
Air pollution - CO
Air pollution - NO2
Air pollution - SO2
Air pollution - Ozone
Air pollution - PM10
Air pollution - PM25
Air pollution - Pb
Crime - Murders per 100,000 population
Crime - Rapes per 100,000 population
Crime - Robberies per 100,000 population
Crime - Assaults per 100,000 population
Crime - Burglaries per 100,000 population
Crime - Thefts per 100,000 population
Crime - Auto thefts per 100,000 population
Crime - Arson per 100,000 population
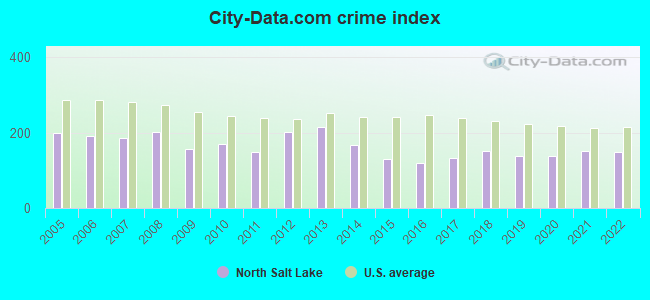
Crime - City-data.com crime index
Crime - Violent crime index
Crime - Property crime index
Crime - Murders per 100,000 population (5 year average)
Crime - Rapes per 100,000 population (5 year average)
Crime - Robberies per 100,000 population (5 year average)
Crime - Assaults per 100,000 population (5 year average)
Crime - Burglaries per 100,000 population (5 year average)
Crime - Thefts per 100,000 population (5 year average)
Crime - Auto thefts per 100,000 population (5 year average)
Crime - Arson per 100,000 population (5 year average)
Crime - City-data.com crime index (5 year average)
Crime - Violent crime index (5 year average)
Crime - Property crime index (5 year average)
1996 Presidential Elections Results (%) - Democratic Party (Clinton)
1996 Presidential Elections Results (%) - Republican Party (Dole)
1996 Presidential Elections Results (%) - Other
2000 Presidential Elections Results (%) - Democratic Party (Gore)
2000 Presidential Elections Results (%) - Republican Party (Bush)
2000 Presidential Elections Results (%) - Other
2004 Presidential Elections Results (%) - Democratic Party (Kerry)
2004 Presidential Elections Results (%) - Republican Party (Bush)
2004 Presidential Elections Results (%) - Other
2008 Presidential Elections Results (%) - Democratic Party (Obama)
2008 Presidential Elections Results (%) - Republican Party (McCain)
2008 Presidential Elections Results (%) - Other
2012 Presidential Elections Results (%) - Democratic Party (Obama)
2012 Presidential Elections Results (%) - Republican Party (Romney)
2012 Presidential Elections Results (%) - Other
2016 Presidential Elections Results (%) - Democratic Party (Clinton)
2016 Presidential Elections Results (%) - Republican Party (Trump)
2016 Presidential Elections Results (%) - Other
2020 Presidential Elections Results (%) - Democratic Party (Biden)
2020 Presidential Elections Results (%) - Republican Party (Trump)
2020 Presidential Elections Results (%) - Other
Ancestries Reported - Arab (%)
Ancestries Reported - Czech (%)
Ancestries Reported - Danish (%)
Ancestries Reported - Dutch (%)
Ancestries Reported - English (%)
Ancestries Reported - French (%)
Ancestries Reported - French Canadian (%)
Ancestries Reported - German (%)
Ancestries Reported - Greek (%)
Ancestries Reported - Hungarian (%)
Ancestries Reported - Irish (%)
Ancestries Reported - Italian (%)
Ancestries Reported - Lithuanian (%)
Ancestries Reported - Norwegian (%)
Ancestries Reported - Polish (%)
Ancestries Reported - Portuguese (%)
Ancestries Reported - Russian (%)
Ancestries Reported - Scotch-Irish (%)
Ancestries Reported - Scottish (%)
Ancestries Reported - Slovak (%)
Ancestries Reported - Subsaharan African (%)
Ancestries Reported - Swedish (%)
Ancestries Reported - Swiss (%)
Ancestries Reported - Ukrainian (%)
Ancestries Reported - United States (%)
Ancestries Reported - Welsh (%)
Ancestries Reported - West Indian (%)
Ancestries Reported - Other (%)
Educational Attainment - No schooling completed (%)
Educational Attainment - Less than high school (%)
Educational Attainment - High school or equivalent (%)
Educational Attainment - Less than 1 year of college (%)
Educational Attainment - 1 or more years of college (%)
Educational Attainment - Associate degree (%)
Educational Attainment - Bachelor's degree (%)
Educational Attainment - Master's degree (%)
Educational Attainment - Professional school degree (%)
Educational Attainment - Doctorate degree (%)
School Enrollment - Nursery, preschool (%)
School Enrollment - Kindergarten (%)
School Enrollment - Grade 1 to 4 (%)
School Enrollment - Grade 5 to 8 (%)
School Enrollment - Grade 9 to 12 (%)
School Enrollment - College undergrad (%)
School Enrollment - Graduate or professional (%)
School Enrollment - Not enrolled in school (%)
School enrollment - Public schools (%)
School enrollment - Private schools (%)
School enrollment - Not enrolled (%)
Median number of rooms in houses and condos
Median number of rooms in apartments
Housing units lacking complete plumbing facilities (%)
Housing units lacking complete kitchen facilities (%)
Density of houses
Urban houses (%)
Rural houses (%)
Households with people 60 years and over (%)
Households with people 65 years and over (%)
Households with people 75 years and over (%)
Households with one or more nonrelatives (%)
Households with no nonrelatives (%)
Population in households (%)
Family households (%)
Nonfamily households (%)
Population in families (%)
Family households with own children (%)
Median number of bedrooms in owner occupied houses
Mean number of bedrooms in owner occupied houses
Median number of bedrooms in renter occupied houses
Mean number of bedrooms in renter occupied houses
Median number of vehichles in owner occupied houses
Mean number of vehichles in owner occupied houses
Median number of vehichles in renter occupied houses
Mean number of vehichles in renter occupied houses
Mortgage status - with mortgage (%)
Mortgage status - with second mortgage (%)
Mortgage status - with home equity loan (%)
Mortgage status - with both second mortgage and home equity loan (%)
Mortgage status - without a mortgage (%)
Average family size
Average family size - White
Average family size - Black or African American
Average family size - Asian
Average family size - Hispanic or Latino
Average family size - American Indian and Alaska Native
Average family size - Multirace
Average family size - Other Race
Geographical mobility - Same house 1 year ago (%)
Geographical mobility - Moved within same county (%)
Geographical mobility - Moved from different county within same state (%)
Geographical mobility - Moved from different state (%)
Geographical mobility - Moved from abroad (%)
Place of birth - Born in state of residence (%)
Place of birth - Born in other state (%)
Place of birth - Native, outside of US (%)
Place of birth - Foreign born (%)
Housing units in structures - 1, detached (%)
Housing units in structures - 1, attached (%)
Housing units in structures - 2 (%)
Housing units in structures - 3 or 4 (%)
Housing units in structures - 5 to 9 (%)
Housing units in structures - 10 to 19 (%)
Housing units in structures - 20 to 49 (%)
Housing units in structures - 50 or more (%)
Housing units in structures - Mobile home (%)
Housing units in structures - Boat, RV, van, etc. (%)
House/condo owner moved in on average (years ago)
Renter moved in on average (years ago)
Year householder moved into unit - Moved in 1999 to March 2000 (%)
Year householder moved into unit - Moved in 1995 to 1998 (%)
Year householder moved into unit - Moved in 1990 to 1994 (%)
Year householder moved into unit - Moved in 1980 to 1989 (%)
Year householder moved into unit - Moved in 1970 to 1979 (%)
Year householder moved into unit - Moved in 1969 or earlier (%)
Means of transportation to work - Drove car alone (%)
Means of transportation to work - Carpooled (%)
Means of transportation to work - Public transportation (%)
Means of transportation to work - Bus or trolley bus (%)
Means of transportation to work - Streetcar or trolley car (%)
Means of transportation to work - Subway or elevated (%)
Means of transportation to work - Railroad (%)
Means of transportation to work - Ferryboat (%)
Means of transportation to work - Taxicab (%)
Means of transportation to work - Motorcycle (%)
Means of transportation to work - Bicycle (%)
Means of transportation to work - Walked (%)
Means of transportation to work - Other means (%)
Working at home (%)
Industry diversity
Most Common Industries - Agriculture, forestry, fishing and hunting, and mining (%)
Most Common Industries - Agriculture, forestry, fishing and hunting (%)
Most Common Industries - Mining, quarrying, and oil and gas extraction (%)
Most Common Industries - Construction (%)
Most Common Industries - Manufacturing (%)
Most Common Industries - Wholesale trade (%)
Most Common Industries - Retail trade (%)
Most Common Industries - Transportation and warehousing, and utilities (%)
Most Common Industries - Transportation and warehousing (%)
Most Common Industries - Utilities (%)
Most Common Industries - Information (%)
Most Common Industries - Finance and insurance, and real estate and rental and leasing (%)
Most Common Industries - Finance and insurance (%)
Most Common Industries - Real estate and rental and leasing (%)
Most Common Industries - Professional, scientific, and management, and administrative and waste management services (%)
Most Common Industries - Professional, scientific, and technical services (%)
Most Common Industries - Management of companies and enterprises (%)
Most Common Industries - Administrative and support and waste management services (%)
Most Common Industries - Educational services, and health care and social assistance (%)
Most Common Industries - Educational services (%)
Most Common Industries - Health care and social assistance (%)
Most Common Industries - Arts, entertainment, and recreation, and accommodation and food services (%)
Most Common Industries - Arts, entertainment, and recreation (%)
Most Common Industries - Accommodation and food services (%)
Most Common Industries - Other services, except public administration (%)
Most Common Industries - Public administration (%)
Occupation diversity
Most Common Occupations - Management, business, science, and arts occupations (%)
Most Common Occupations - Management, business, and financial occupations (%)
Most Common Occupations - Management occupations (%)
Most Common Occupations - Business and financial operations occupations (%)
Most Common Occupations - Computer, engineering, and science occupations (%)
Most Common Occupations - Computer and mathematical occupations (%)
Most Common Occupations - Architecture and engineering occupations (%)
Most Common Occupations - Life, physical, and social science occupations (%)
Most Common Occupations - Education, legal, community service, arts, and media occupations (%)
Most Common Occupations - Community and social service occupations (%)
Most Common Occupations - Legal occupations (%)
Most Common Occupations - Education, training, and library occupations (%)
Most Common Occupations - Arts, design, entertainment, sports, and media occupations (%)
Most Common Occupations - Healthcare practitioners and technical occupations (%)
Most Common Occupations - Health diagnosing and treating practitioners and other technical occupations (%)
Most Common Occupations - Health technologists and technicians (%)
Most Common Occupations - Service occupations (%)
Most Common Occupations - Healthcare support occupations (%)
Most Common Occupations - Protective service occupations (%)
Most Common Occupations - Fire fighting and prevention, and other protective service workers including supervisors (%)
Most Common Occupations - Law enforcement workers including supervisors (%)
Most Common Occupations - Food preparation and serving related occupations (%)
Most Common Occupations - Building and grounds cleaning and maintenance occupations (%)
Most Common Occupations - Personal care and service occupations (%)
Most Common Occupations - Sales and office occupations (%)
Most Common Occupations - Sales and related occupations (%)
Most Common Occupations - Office and administrative support occupations (%)
Most Common Occupations - Natural resources, construction, and maintenance occupations (%)
Most Common Occupations - Farming, fishing, and forestry occupations (%)
Most Common Occupations - Construction and extraction occupations (%)
Most Common Occupations - Installation, maintenance, and repair occupations (%)
Most Common Occupations - Production, transportation, and material moving occupations (%)
Most Common Occupations - Production occupations (%)
Most Common Occupations - Transportation occupations (%)
Most Common Occupations - Material moving occupations (%)
People in Group quarters - Institutionalized population (%)
People in Group quarters - Correctional institutions (%)
People in Group quarters - Federal prisons and detention centers (%)
People in Group quarters - Halfway houses (%)
People in Group quarters - Local jails and other confinement facilities (including police lockups) (%)
People in Group quarters - Military disciplinary barracks (%)
People in Group quarters - State prisons (%)
People in Group quarters - Other types of correctional institutions (%)
People in Group quarters - Nursing homes (%)
People in Group quarters - Hospitals/wards, hospices, and schools for the handicapped (%)
People in Group quarters - Hospitals/wards and hospices for chronically ill (%)
People in Group quarters - Hospices or homes for chronically ill (%)
People in Group quarters - Military hospitals or wards for chronically ill (%)
People in Group quarters - Other hospitals or wards for chronically ill (%)
People in Group quarters - Hospitals or wards for drug/alcohol abuse (%)
People in Group quarters - Mental (Psychiatric) hospitals or wards (%)
People in Group quarters - Schools, hospitals, or wards for the mentally retarded (%)
People in Group quarters - Schools, hospitals, or wards for the physically handicapped (%)
People in Group quarters - Institutions for the deaf (%)
People in Group quarters - Institutions for the blind (%)
People in Group quarters - Orthopedic wards and institutions for the physically handicapped (%)
People in Group quarters - Wards in general hospitals for patients who have no usual home elsewhere (%)
People in Group quarters - Wards in military hospitals for patients who have no usual home elsewhere (%)
People in Group quarters - Juvenile institutions (%)
People in Group quarters - Long-term care (%)
People in Group quarters - Homes for abused, dependent, and neglected children (%)
People in Group quarters - Residential treatment centers for emotionally disturbed children (%)
People in Group quarters - Training schools for juvenile delinquents (%)
People in Group quarters - Short-term care, detention or diagnostic centers for delinquent children (%)
People in Group quarters - Type of juvenile institution unknown (%)
People in Group quarters - Noninstitutionalized population (%)
People in Group quarters - College dormitories (includes college quarters off campus) (%)
People in Group quarters - Military quarters (%)
People in Group quarters - On base (%)
People in Group quarters - Barracks, unaccompanied personnel housing (UPH), (Enlisted/Officer), ;and similar group living quarters for military personnel (%)
People in Group quarters - Transient quarters for temporary residents (%)
People in Group quarters - Military ships (%)
People in Group quarters - Group homes (%)
People in Group quarters - Homes or halfway houses for drug/alcohol abuse (%)
People in Group quarters - Homes for the mentally ill (%)
People in Group quarters - Homes for the mentally retarded (%)
People in Group quarters - Homes for the physically handicapped (%)
People in Group quarters - Other group homes (%)
People in Group quarters - Religious group quarters (%)
People in Group quarters - Dormitories (%)
People in Group quarters - Agriculture workers' dormitories on farms (%)
People in Group quarters - Job Corps and vocational training facilities (%)
People in Group quarters - Other workers' dormitories (%)
People in Group quarters - Crews of maritime vessels (%)
People in Group quarters - Other nonhousehold living situations (%)
People in Group quarters - Other noninstitutional group quarters (%)
Residents speaking English at home (%)
Residents speaking English at home - Born in the United States (%)
Residents speaking English at home - Native, born elsewhere (%)
Residents speaking English at home - Foreign born (%)
Residents speaking Spanish at home (%)
Residents speaking Spanish at home - Born in the United States (%)
Residents speaking Spanish at home - Native, born elsewhere (%)
Residents speaking Spanish at home - Foreign born (%)
Residents speaking other language at home (%)
Residents speaking other language at home - Born in the United States (%)
Residents speaking other language at home - Native, born elsewhere (%)
Residents speaking other language at home - Foreign born (%)
Class of Workers - Employee of private company (%)
Class of Workers - Self-employed in own incorporated business (%)
Class of Workers - Private not-for-profit wage and salary workers (%)
Class of Workers - Local government workers (%)
Class of Workers - State government workers (%)
Class of Workers - Federal government workers (%)
Class of Workers - Self-employed workers in own not incorporated business and Unpaid family workers (%)
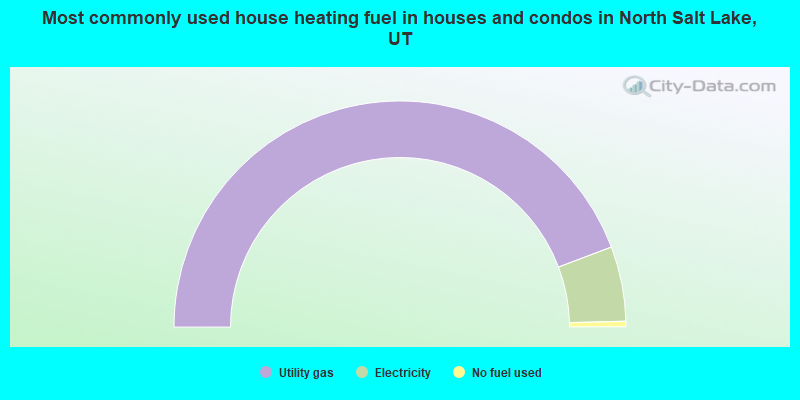
House heating fuel used in houses and condos - Utility gas (%)
House heating fuel used in houses and condos - Bottled, tank, or LP gas (%)
House heating fuel used in houses and condos - Electricity (%)
House heating fuel used in houses and condos - Fuel oil, kerosene, etc. (%)
House heating fuel used in houses and condos - Coal or coke (%)
House heating fuel used in houses and condos - Wood (%)
House heating fuel used in houses and condos - Solar energy (%)
House heating fuel used in houses and condos - Other fuel (%)
House heating fuel used in houses and condos - No fuel used (%)
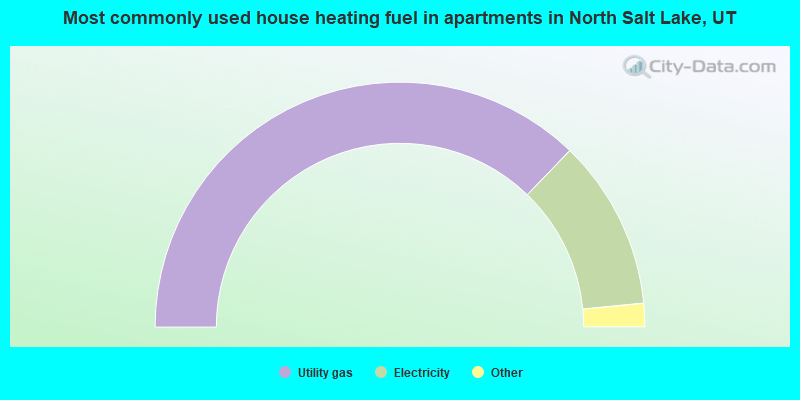
House heating fuel used in apartments - Utility gas (%)
House heating fuel used in apartments - Bottled, tank, or LP gas (%)
House heating fuel used in apartments - Electricity (%)
House heating fuel used in apartments - Fuel oil, kerosene, etc. (%)
House heating fuel used in apartments - Coal or coke (%)
House heating fuel used in apartments - Wood (%)
House heating fuel used in apartments - Solar energy (%)
House heating fuel used in apartments - Other fuel (%)
House heating fuel used in apartments - No fuel used (%)
Armed forces status - In Armed Forces (%)
Armed forces status - Civilian (%)
Armed forces status - Civilian - Veteran (%)
Armed forces status - Civilian - Nonveteran (%)
Fatal accidents locations in years 2005-2021
Fatal accidents locations in 2005
Fatal accidents locations in 2006
Fatal accidents locations in 2007
Fatal accidents locations in 2008
Fatal accidents locations in 2009
Fatal accidents locations in 2010
Fatal accidents locations in 2011
Fatal accidents locations in 2012
Fatal accidents locations in 2013
Fatal accidents locations in 2014
Fatal accidents locations in 2015
Fatal accidents locations in 2016
Fatal accidents locations in 2017
Fatal accidents locations in 2018
Fatal accidents locations in 2019
Fatal accidents locations in 2020
Fatal accidents locations in 2021
Alcohol use - People drinking some alcohol every month (%)
Alcohol use - People not drinking at all (%)
Alcohol use - Average days/month drinking alcohol
Alcohol use - Average drinks/week
Alcohol use - Average days/year people drink much
Audiometry - Average condition of hearing (%)
Audiometry - People that can hear a whisper from across a quiet room (%)
Audiometry - People that can hear normal voice from across a quiet room (%)
Audiometry - Ears ringing, roaring, buzzing (%)
Audiometry - Had a job exposure to loud noise (%)
Audiometry - Had off-work exposure to loud noise (%)
Blood Pressure & Cholesterol - Has high blood pressure (%)
Blood Pressure & Cholesterol - Checking blood pressure at home (%)
Blood Pressure & Cholesterol - Frequently checking blood cholesterol (%)
Blood Pressure & Cholesterol - Has high cholesterol level (%)
Consumer Behavior - Money monthly spent on food at supermarket/grocery store
Consumer Behavior - Money monthly spent on food at other stores
Consumer Behavior - Money monthly spent on eating out
Consumer Behavior - Money monthly spent on carryout/delivered foods
Consumer Behavior - Income spent on food at supermarket/grocery store (%)
Consumer Behavior - Income spent on food at other stores (%)
Consumer Behavior - Income spent on eating out (%)
Consumer Behavior - Income spent on carryout/delivered foods (%)
Current Health Status - General health condition (%)
Current Health Status - Blood donors (%)
Current Health Status - Has blood ever tested for HIV virus (%)
Current Health Status - Left-handed people (%)
Dermatology - People using sunscreen (%)
Diabetes - Diabetics (%)
Diabetes - Had a blood test for high blood sugar (%)
Diabetes - People taking insulin (%)
Diet Behavior & Nutrition - Diet health (%)
Diet Behavior & Nutrition - Milk product consumption (# of products/month)
Diet Behavior & Nutrition - Meals not home prepared (#/week)
Diet Behavior & Nutrition - Meals from fast food or pizza place (#/week)
Diet Behavior & Nutrition - Ready-to-eat foods (#/month)
Diet Behavior & Nutrition - Frozen meals/pizza (#/month)
Drug Use - People that ever used marijuana or hashish (%)
Drug Use - Ever used hard drugs (%)
Drug Use - Ever used any form of cocaine (%)
Drug Use - Ever used heroin (%)
Drug Use - Ever used methamphetamine (%)
Health Insurance - People covered by health insurance (%)
Kidney Conditions-Urology - Avg. # of times urinating at night
Medical Conditions - People with asthma (%)
Medical Conditions - People with anemia (%)
Medical Conditions - People with psoriasis (%)
Medical Conditions - People with overweight (%)
Medical Conditions - Elderly people having difficulties in thinking or remembering (%)
Medical Conditions - People who ever received blood transfusion (%)
Medical Conditions - People having trouble seeing even with glass/contacts (%)
Medical Conditions - People with arthritis (%)
Medical Conditions - People with gout (%)
Medical Conditions - People with congestive heart failure (%)
Medical Conditions - People with coronary heart disease (%)
Medical Conditions - People with angina pectoris (%)
Medical Conditions - People who ever had heart attack (%)
Medical Conditions - People who ever had stroke (%)
Medical Conditions - People with emphysema (%)
Medical Conditions - People with thyroid problem (%)
Medical Conditions - People with chronic bronchitis (%)
Medical Conditions - People with any liver condition (%)
Medical Conditions - People who ever had cancer or malignancy (%)
Mental Health - People who have little interest in doing things (%)
Mental Health - People feeling down, depressed, or hopeless (%)
Mental Health - People who have trouble sleeping or sleeping too much (%)
Mental Health - People feeling tired or having little energy (%)
Mental Health - People with poor appetite or overeating (%)
Mental Health - People feeling bad about themself (%)
Mental Health - People who have trouble concentrating on things (%)
Mental Health - People moving or speaking slowly or too fast (%)
Mental Health - People having thoughts they would be better off dead (%)
Oral Health - Average years since last visit a dentist
Oral Health - People embarrassed because of mouth (%)
Oral Health - People with gum disease (%)
Oral Health - General health of teeth and gums (%)
Oral Health - Average days a week using dental floss/device
Oral Health - Average days a week using mouthwash for dental problem
Oral Health - Average number of teeth
Pesticide Use - Households using pesticides to control insects (%)
Pesticide Use - Households using pesticides to kill weeds (%)
Physical Activity - People doing vigorous-intensity work activities (%)
Physical Activity - People doing moderate-intensity work activities (%)
Physical Activity - People walking or bicycling (%)
Physical Activity - People doing vigorous-intensity recreational activities (%)
Physical Activity - People doing moderate-intensity recreational activities (%)
Physical Activity - Average hours a day doing sedentary activities
Physical Activity - Average hours a day watching TV or videos
Physical Activity - Average hours a day using computer
Physical Functioning - People having limitations keeping them from working (%)
Physical Functioning - People limited in amount of work they can do (%)
Physical Functioning - People that need special equipment to walk (%)
Physical Functioning - People experiencing confusion/memory problems (%)
Physical Functioning - People requiring special healthcare equipment (%)
Prescription Medications - Average number of prescription medicines taking
Preventive Aspirin Use - Adults 40+ taking low-dose aspirin (%)
Reproductive Health - Vaginal deliveries (%)
Reproductive Health - Cesarean deliveries (%)
Reproductive Health - Deliveries resulted in a live birth (%)
Reproductive Health - Pregnancies resulted in a delivery (%)
Reproductive Health - Women breastfeeding newborns (%)
Reproductive Health - Women that had a hysterectomy (%)
Reproductive Health - Women that had both ovaries removed (%)
Reproductive Health - Women that have ever taken birth control pills (%)
Reproductive Health - Women taking birth control pills (%)
Reproductive Health - Women that have ever used Depo-Provera or injectables (%)
Reproductive Health - Women that have ever used female hormones (%)
Sexual Behavior - People 18+ that ever had sex (vaginal, anal, or oral) (%)
Sexual Behavior - Males 18+ that ever had vaginal sex with a woman (%)
Sexual Behavior - Males 18+ that ever performed oral sex on a woman (%)
Sexual Behavior - Males 18+ that ever had anal sex with a woman (%)
Sexual Behavior - Males 18+ that ever had any sex with a man (%)
Sexual Behavior - Females 18+ that ever had vaginal sex with a man (%)
Sexual Behavior - Females 18+ that ever performed oral sex on a man (%)
Sexual Behavior - Females 18+ that ever had anal sex with a man (%)
Sexual Behavior - Females 18+ that ever had any kind of sex with a woman (%)
Sexual Behavior - Average age people first had sex
Sexual Behavior - Average number of female sex partners in lifetime (males 18+)
Sexual Behavior - Average number of female vaginal sex partners in lifetime (males 18+)
Sexual Behavior - Average age people first performed oral sex on a woman (18+)
Sexual Behavior - Average number of woman performed oral sex on in lifetime (18+)
Sexual Behavior - Average number of male sex partners in lifetime (males 18+)
Sexual Behavior - Average number of male anal sex partners in lifetime (males 18+)
Sexual Behavior - Average age people first performed oral sex on a man (18+)
Sexual Behavior - Average number of male oral sex partners in lifetime (18+)
Sexual Behavior - People using protection when performing oral sex (%)
Sexual Behavior - Average number of times people have vaginal or anal sex a year
Sexual Behavior - People having sex without condom (%)
Sexual Behavior - Average number of male sex partners in lifetime (females 18+)
Sexual Behavior - Average number of male vaginal sex partners in lifetime (females 18+)
Sexual Behavior - Average number of female sex partners in lifetime (females 18+)
Sexual Behavior - Circumcised males 18+ (%)
Sleep Disorders - Average hours sleeping at night
Sleep Disorders - People that has trouble sleeping (%)
Smoking-Cigarette Use - People smoking cigarettes (%)
Taste & Smell - People 40+ having problems with smell (%)
Taste & Smell - People 40+ having problems with taste (%)
Taste & Smell - People 40+ that ever had wisdom teeth removed (%)
Taste & Smell - People 40+ that ever had tonsils teeth removed (%)
Taste & Smell - People 40+ that ever had a loss of consciousness because of a head injury (%)
Taste & Smell - People 40+ that ever had a broken nose or other serious injury to face or skull (%)
Taste & Smell - People 40+ that ever had two or more sinus infections (%)
Weight - Average height (inches)
Weight - Average weight (pounds)
Weight - Average BMI
Weight - People that are obese (%)
Weight - People that ever were obese (%)
Weight - People trying to lose weight (%)
According to our research of Utah and other state lists, there were 31 registered sex offenders living in North Salt Lake, Utah as of April 27, 2024 . The ratio of all residents to sex offenders in North Salt Lake is 629 to 1.The ratio of registered sex offenders to all residents in this city is lower than the state average.
Officers per 1,000 residents here:
1.10Utah average:
1.67
Latest news from North Salt Lake, UT collected exclusively by city-data.com from local newspapers, TV, and radio stations
Ancestries: English (24.4%), American (8.7%), German (7.2%), European (3.6%), Swedish (3.0%), Italian (2.4%).
Current Local Time:
Incorporated on 09/03/1946
Land area: 8.25 square miles.
Population density: 2,732 people per square mile (average).
3,096 residents are foreign born (5.5% Latin America , 4.6% Asia , 1.8% Oceania ).
Median real estate property taxes paid for housing units with mortgages in 2022: $2,596 (0.5%)Median real estate property taxes paid for housing units with no mortgage in 2022: $2,702 (0.5%)
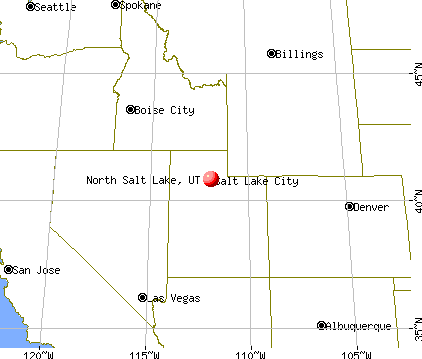
Nearest city with pop. 50,000+: South Davis, UT (4.0 miles
Nearest city with pop. 200,000+: Northeast Jefferson, CO (366.6 miles
Nearest city with pop. 1,000,000+: Phoenix, AZ
Nearest cities:
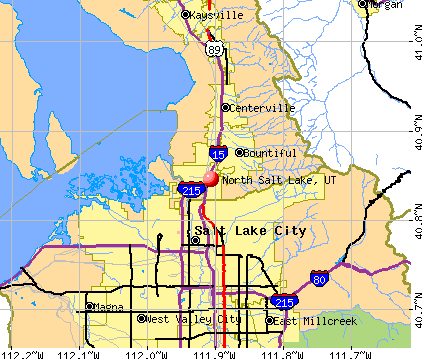
Latitude: 40.85 N, Longitude: 111.91 W
Daytime population change due to commuting: -875 (-3.9%)Workers who live and work in this city: 3,642 (30.1%)
Area code commonly used in this area: 801
Single-family new house construction building permits:
2022: 49 buildings , average cost: $348,4002021: 97 buildings , average cost: $329,0002020: 197 buildings , average cost: $288,2002019: 87 buildings , average cost: $201,9002018: 96 buildings , average cost: $256,9002017: 104 buildings , average cost: $252,2002016: 56 buildings , average cost: $283,7002015: 158 buildings , average cost: $202,9002014: 175 buildings , average cost: $221,9002013: 247 buildings , average cost: $249,8002012: 127 buildings , average cost: $265,6002011: 53 buildings , average cost: $243,7002010: 43 buildings , average cost: $248,6002009: 104 buildings , average cost: $213,9002008: 233 buildings , average cost: $193,5002007: 209 buildings , average cost: $242,4002006: 328 buildings , average cost: $251,2002005: 346 buildings , average cost: $225,8002004: 349 buildings , average cost: $255,4002003: 126 buildings , average cost: $282,6002002: 71 buildings , average cost: $310,5002001: 66 buildings , average cost: $295,0002000: 61 buildings , average cost: $291,9001999: 58 buildings , average cost: $279,8001998: 71 buildings , average cost: $251,4001997: 101 buildings , average cost: $220,600Unemployment in December 2023:
Population change in the 1990s: +1,965 (+29.0%).
Most common industries in North Salt Lake, UT (%)
Both Males Females
Finance & insurance (8.7%)
Construction (8.7%)
Accommodation & food services (8.1%)
Professional, scientific, technical services (7.6%)
Health care (6.4%)
Educational services (5.6%)
Public administration (5.0%)
Construction (13.3%)
Professional, scientific, technical services (8.8%)
Finance & insurance (7.4%)
Accommodation & food services (5.4%)
Public administration (5.0%)
Religious, grantmaking, civic, professional, similar organizations (4.3%)
Educational services (4.0%)
Accommodation & food services (11.5%)
Health care (10.6%)
Finance & insurance (10.4%)
Educational services (7.7%)
Professional, scientific, technical services (6.0%)
Public administration (4.9%)
Social assistance (3.7%)
Most common occupations in North Salt Lake, UT (%)
Both Males Females
Other office and administrative support workers, including supervisors (5.1%)
Sales representatives, services, wholesale and manufacturing (5.1%)
Other management occupations, except farmers and farm managers (3.8%)
Customer service representatives (3.4%)
Information and record clerks, except customer service representatives (3.4%)
Computer specialists (3.2%)
Secretaries and administrative assistants (3.0%)
Computer specialists (5.5%)
Sales representatives, services, wholesale and manufacturing (4.9%)
Other management occupations, except farmers and farm managers (4.7%)
Driver/sales workers and truck drivers (4.5%)
Other production occupations, including supervisors (3.2%)
Cooks and food preparation workers (3.1%)
Carpenters (3.1%)
Other office and administrative support workers, including supervisors (8.2%)
Information and record clerks, except customer service representatives (6.2%)
Secretaries and administrative assistants (6.2%)
Sales representatives, services, wholesale and manufacturing (5.3%)
Customer service representatives (5.2%)
Material recording, scheduling, dispatching, and distributing workers (3.8%)
Health technologists and technicians (3.6%)
Earthquake activity:
North Salt Lake-area historical earthquake activity is significantly above Utah state average. It is 2159% greater than the overall U.S. average. On 8/18/1959 at 06:37:13, a magnitude 7.7 (7.7 UK, Class: Major, Intensity: VIII - XII) earthquake occurred 265.1 miles away from the city center, causing $26,000,000 total damage On 10/3/1915 at 06:52:48, a magnitude 7.6 (7.6 UK) earthquake occurred 294.3 miles away from the city center On 10/28/1983 at 14:06:06, a magnitude 7.3 (6.2 MB, 7.3 MS, 7.0 MW) earthquake occurred 243.5 miles away from North Salt Lake center, causing 2 deaths ( 2 shaking deaths) and 3 injuries, causing $15,000,000 total damage On 3/28/1975 at 02:31:05, a magnitude 6.2 (6.1 MB, 6.0 MS, 6.2 ML, Class: Strong, Intensity: VII - IX) earthquake occurred 85.9 miles away from North Salt Lake center On 3/18/2020 at 13:09:31, a magnitude 5.7 (5.7 MW, Depth: 7.4 mi, Class: Moderate, Intensity: VI - VII) earthquake occurred 11.1 miles away from the city center On 12/21/1932 at 06:10:09, a magnitude 7.2 (7.2 UK) earthquake occurred 366.3 miles away from the city center Magnitude types: body-wave magnitude (MB), local magnitude (ML), surface-wave magnitude (MS), moment magnitude (MW) Natural disasters: The number of natural disasters in Davis County (7) is smaller than the US average (15).Major Disasters (Presidential) Declared: 3Emergencies Declared: 2Storms: 3, Floods: 2, Landslides: 2, Drought: 1, Earthquake: 1, Hurricane: 1, Mudslide: 1, Other: 1 (Note: some incidents may be assigned to more than one category). Hospitals and medical centers near North Salt Lake: LIFE CARE CENTER OF BOUNTIFUL (Nursing Home, about 2 miles away; BOUNTIFUL, UT)
ASPIRE HOME HEALTH (Home Health Center, about 3 miles away; BOUNTIFUL, UT)
LIBERTY DIALYSIS - WOODSCROSS (Dialysis Facility, about 3 miles away; BOUNTIFUL, UT)
LIFETOUCH HOME HEALTH (Home Health Center, about 3 miles away; BOUNTIFUL, UT)
WEST BOUNTIFUL DIALYSIS (DVA) (Dialysis Facility, about 3 miles away; W BOUNTIFUL, UT)
LAKESIDE DIALYSIS CENTER (Dialysis Facility, about 3 miles away; BOUNTIFUL, UT)
SOUTH DAVIS HOME HEALTH (Home Health Center, about 4 miles away; BOUNTIFUL, UT)
Heliports located in North Salt Lake: Amtrak station near North Salt Lake: 6 miles: SALT LAKE CITY (320 S. RIO GRANDE ST.) Services: ticket office, fully wheelchair accessible, enclosed waiting area, public restrooms, public payphones, vending machines, free short-term parking, free long-term parking, call for car rental service, taxi stand.
Colleges/universities with over 2000 students nearest to North Salt Lake:
Latter-day Saints Business College (about 6 miles; Salt Lake City, UT ; Full-time enrollment: 2,059)
University of Utah (about 7 miles; Salt Lake City, UT ; FT enrollment: 28,454)
Westminster College (about 9 miles; Salt Lake City, UT ; FT enrollment: 2,870)
Western Governors University (about 12 miles; Salt Lake City, UT ; FT enrollment: 31,481)
Salt Lake Community College (about 13 miles; Salt Lake City, UT ; FT enrollment: 20,797)
Stevens-Henager College-Murray (about 13 miles; Murray, UT ; FT enrollment: 6,395)
Weber State University (about 25 miles; Ogden, UT ; FT enrollment: 17,655)
Public high schools in North Salt Lake: SPECTRUM ACADEMY - NSL Location: 575 N CUTLER DR, Grades: KG-12, Charter school )
LEGACY PREPARATORY ACADEMY Location: 1375 W CENTER STREET, Grades: KG-9, Charter school )
Public elementary/middle schools in North Salt Lake: FOXBORO SCHOOL Students: 763, Location: 487 N FOXBORO DRIVE, Grades: KG-6)ORCHARD SCHOOL Students: 683, Location: 205 E CENTER STREET, Grades: KG-6)WASATCH PEAK ACADEMY Location: 414 N CUTLER DRIVE, Grades: KG-6, Charter school )
See full list of schools located in North Salt Lake Davis County has a predicted average indoor radon screening level between 2 and 4 pCi/L (pico curies per liter) - Moderate Potential Average household size: This city:
3.0 peopleUtah:
3.1 people
Percentage of family households: This city:
77.7%Whole state:
75.2%
Percentage of households with unmarried partners: This city:
4.9%Whole state:
4.6%
Likely homosexual households (counted as self-reported same-sex unmarried-partner households)
Lesbian couples: 0.5% of all households Gay men: 0.4% of all households
2 people in other noninstitutional facilities in 2010
Banks with branches in North Salt Lake (2011 data):
U.S. Bank National Association: North Salt Lake Branch at 1090 North 500 East, branch established on 1977/10/14. Info updated 2012/01/30: Bank assets: $330,470.8 mil, Deposits: $236,091.5 mil, headquarters in Cincinnati, OH, positive income , 3121 total offices , Holding Company: U.S. Bancorp
Zions First National Bank: North Salt Lake Branch at 870 North Highway 89, branch established on 1955/07/07. Info updated 2006/11/03: Bank assets: $17,531.3 mil, Deposits: $14,905.3 mil, headquarters in Salt Lake City, UT, positive income , Commercial Lending Specialization, 151 total offices , Holding Company: Zions Bancorporation
For population 15 years and over in North Salt Lake:
Never married: 28.3%Now married: 59.2%Separated: 0.6%Widowed: 3.3%Divorced: 8.5% For population 25 years and over in North Salt Lake:
High school or higher: 94.8%Bachelor's degree or higher: 40.6%Graduate or professional degree: 12.9%Unemployed: 3.6%Mean travel time to work (commute): 15.3 minutes
Education Gini index (Inequality in education) Here:
10.4Utah average:
10.9
Religion statistics for North Salt Lake, UT (based on Davis County data)
Religion Adherents Congregations Other 230,405 556 Catholic 12,782 1 Evangelical Protestant 7,928 34 Mainline Protestant 1,135 7 Black Protestant 200 1 None 54,029 -
Source: Clifford Grammich, Kirk Hadaway, Richard Houseal, Dale E.Jones, Alexei Krindatch, Richie Stanley and Richard H.Taylor. 2012. 2010 U.S.Religion Census: Religious Congregations & Membership Study. Association of Statisticians of American Religious Bodies. Jones, Dale E., et al. 2002. Congregations and Membership in the United States 2000. Nashville, TN: Glenmary Research Center. Graphs represent county-level data
Food Environment Statistics: Number of grocery stores : 25Davis County :
0.87 / 10,000 pop.Utah :
1.37 / 10,000 pop.
Number of supercenters and club stores : 6This county :
0.21 / 10,000 pop.Utah :
0.18 / 10,000 pop.
Number of convenience stores (no gas) : 6Davis County :
0.21 / 10,000 pop.Utah :
0.41 / 10,000 pop.
Number of convenience stores (with gas) : 56Davis County :
1.95 / 10,000 pop.Utah :
2.82 / 10,000 pop.
Number of full-service restaurants : 106Davis County :
3.68 / 10,000 pop.State :
5.09 / 10,000 pop.
Adult diabetes rate : Davis County :
5.4%State :
6.3%
Health and Nutrition: Healthy diet rate : This city:
50.5%Utah:
48.9%
Average overall health of teeth and gums : People feeling badly about themselves : This city:
20.4%Utah:
21.0%
People not drinking alcohol at all : This city:
10.1%Utah:
10.3%
Average hours sleeping at night : Overweight people : North Salt Lake:
31.8%Utah:
31.9%
General health condition : North Salt Lake:
59.0%State:
57.4%
Average condition of hearing : North Salt Lake:
80.4%State:
80.1%
More about Health and Nutrition of North Salt Lake, UT Residents
Local government employment and payroll (March 2022)
Function
Full-time employees
Monthly full-time payroll
Average yearly full-time wage
Part-time employees
Monthly part-time payroll
Police Protection - Officers
23 $170,074 $88,734 0 $0 Water Supply
11 $62,658 $68,354 1 $1,229 Other Government Administration
10 $64,402 $77,282 7 $5,565 Parks and Recreation
8 $44,352 $66,528 3 $1,709 Streets and Highways
7 $47,658 $81,699 2 $2,061 Other and Unallocable
4 $24,129 $72,387 1 $354 Police - Other
4 $19,009 $57,027 13 $8,857 Financial Administration
4 $35,364 $106,092 1 $2,390 Judicial and Legal
1 $5,454 $65,448 3 $8,934
Totals for Government
72 $473,100 $78,850 31 $31,098
North Salt Lake government finances - Expenditure in 2021 (per resident):
Construction - General - Other: $3,243,000 ($143.90)
Regular Highways: $194,000 ($8.61)Water Utilities: $90,000 ($3.99)Parks and Recreation: $75,000 ($3.33)Current Operations - General - Other: $19,434,000 ($862.32)
Water Utilities: $3,884,000 ($172.34)Parks and Recreation: $2,213,000 ($98.19)Police Protection: $2,106,000 ($93.45)Regular Highways: $1,808,000 ($80.22)Housing and Community Development: $1,364,000 ($60.52)Solid Waste Management: $1,219,000 ($54.09)Local Fire Protection: $1,051,000 ($46.63)Central Staff Services: $980,000 ($43.48)Natural Resources - Other: $837,000 ($37.14)Financial Administration: $408,000 ($18.10)Judicial and Legal Services: $309,000 ($13.71)Protective Inspection and Regulation - Other: $178,000 ($7.90)Sewerage: $152,000 ($6.74)General Public Buildings: $110,000 ($4.88)Health - Other: $58,000 ($2.57)General - Interest on Debt: $408,000 ($18.10)
Other Capital Outlay - General - Other: $1,630,000 ($72.33)
Financial Administration: $46,000 ($2.04)Solid Waste Management: $30,000 ($1.33)Total Salaries and Wages: $5,497,000 ($243.91)
Water Utilities - Interest on Debt: $134,000 ($5.95)
North Salt Lake government finances - Revenue in 2021 (per resident):
Charges - Other: $12,694,000 ($563.25)
Parks and Recreation: $2,128,000 ($94.42)Regular Highways: $592,000 ($26.27)Natural Resources - Other: $192,000 ($8.52)Federal Intergovernmental - Other: $2,124,000 ($94.25)
Highways: $75,000 ($3.33)Water Utilities: $45,000 ($2.00)Natural Resources: $7,000 ($0.31)Local Intergovernmental - Other: $836,000 ($37.09)
Miscellaneous - Fines and Forfeits: $677,000 ($30.04)
Rents: $665,000 ($29.51)General Revenue - Other: $591,000 ($26.22)Interest Earnings: $470,000 ($20.85)Sale of Property: $256,000 ($11.36)Revenue - Water Utilities: $5,475,000 ($242.93)
State Intergovernmental - Highways: $1,070,000 ($47.48)
Other: $810,000 ($35.94)General Local Government Support: $21,000 ($0.93)Tax - Property: $9,440,000 ($418.87)
General Sales and Gross Receipts: $4,872,000 ($216.18)Public Utilities Sales: $1,716,000 ($76.14)Other License: $557,000 ($24.71)Other Selective Sales: $516,000 ($22.90)Occupation and Business License - Other: $230,000 ($10.21)
North Salt Lake government finances - Debt in 2021 (per resident):
Long Term Debt - Beginning Outstanding - Unspecified Public Purpose: $7,264,000 ($322.31)
Outstanding Unspecified Public Purpose: $6,420,000 ($284.86)Retired Unspecified Public Purpose: $1,463,000 ($64.92)Beginning Outstanding - Public Debt for Private Purpose: $774,000 ($34.34)Outstanding Nonguaranteed - Industrial Revenue: $699,000 ($31.02)Issue, Unspecified Public Purpose: $619,000 ($27.47)Retired Nonguaranteed - Public Debt for Private Purpose: $75,000 ($3.33)
North Salt Lake government finances - Cash and Securities in 2021 (per resident):
Other Funds - Cash and Securities: $19,643,000 ($871.59)
Sinking Funds - Cash and Securities: $944,000 ($41.89)
9.07% of this county's 2021 resident taxpayers lived in other counties in 2020 ($67,737 average adjusted gross income )
Here:
9.07%Utah average:
7.95%
0.10% of residents moved from foreign countries ($694 average AGI )Davis County:
0.10%Utah average:
0.02%
Top counties from which taxpayers relocated into this county between 2020 and 2021:
8.88% of this county's 2020 resident taxpayers moved to other counties in 2021 ($65,750 average adjusted gross income )
Here:
8.88%Utah average:
7.39%
0.08% of residents moved to foreign countries ($598 average AGI )Davis County:
0.08%Utah average:
0.02%
Top counties to which taxpayers relocated from this county between 2020 and 2021:
Businesses in North Salt Lake, UT
Name Count Name Count
Best Western 1 Subway 1 Curves 1 U-Haul 1 FedEx 3 UPS 4 H&R Block 1 Village Inn 1 Quiznos 1
Strongest AM radio stations in North Salt Lake:
KALL (700 AM; 50 kW; NORTH SALT LAKE CITY, UT; Owner: CITICASTERS LICENSES, L.P.)
KZNS (1280 AM; 10 kW; SALT LAKE CITY, UT; Owner: SIMMONS-SLC, LS, LLC)
KNRS (570 AM; 5 kW; SALT LAKE CITY, UT; Owner: CITICASTERS LICENSES, L.P.)
KIQN (1010 AM; 50 kW; TOOELE, UT)
KSL (1160 AM; 50 kW; SALT LAKE CITY, UT; Owner: BONNEVILLE HOLDING COMPANY)
KSGO (1600 AM; 5 kW; CENTERVILLE, UT; Owner: UTAH SPANISH RADIO CORP)
KBEE (860 AM; 10 kW; SALT LAKE CITY, UT; Owner: CITADEL BROADCASTING COMPANY)
KTKK (630 AM; 10 kW; SANDY, UT; Owner: UNITED BROADCASTING COMPANY)
KBJA (1640 AM; 10 kW; SANDY, UT; Owner: UNITED BROADCASTING COMPANY, INC)
KMRI (1550 AM; 10 kW; WEST VALLEY CITY, UT; Owner: KMRI RADIO, LLC)
KSOP (1370 AM; 5 kW; SOUTH SALT LAKE, UT; Owner: KSOP, INC.)
KANN (1120 AM; 10 kW; ROY, UT; Owner: FAITH COMMUNICATIONS CORPORATION)
KLO (1430 AM; 10 kW; OGDEN, UT; Owner: KLO BROADCASTING CO.)
Strongest FM radio stations in North Salt Lake:
KCPX (105.7 FM; CENTERVILLE, UT; Owner: MERCURY BROADCASTING COMPANY, INC.)
K252DI (98.3 FM; SALT LAKE CITY, UT; Owner: FIRST NATIONAL BROADCASTING CORPORATION)
K276DP (103.1 FM; MILLCREEK, UT; Owner: FIRST NATIONAL B/CING CORPORATION)
K213CQ (90.5 FM; SALT LAKE CITY, UT; Owner: CALVARY CHAPEL OF TWIN FALLS, INC.)
KSOP-FM (104.3 FM; SALT LAKE CITY, UT; Owner: KSOP, INC.)
K272DP (102.3 FM; TOOELE, UT; Owner: FAMILY STATIONS, INC.)
KBZN (97.9 FM; OGDEN, UT; Owner: CAPITOL BROADCASTING, INC.)
KRCL (90.9 FM; SALT LAKE CITY, UT; Owner: LISTENERS COMMUNITY RADIO OF UTAH)
KBER (101.1 FM; OGDEN, UT; Owner: CITADEL BROADCASTING COMPANY)
KISN-FM (97.1 FM; SALT LAKE CITY, UT; Owner: CLEAR CHANNEL BROADCASTING LICENSES, INC.)
KKAT (101.9 FM; OGDEN, UT; Owner: CITICASTERS LICENSES, L.P.)
KSFI (100.3 FM; SALT LAKE CITY, UT; Owner: SIMMONS-SLC, LS, LLC)
KUBL-FM (93.3 FM; SALT LAKE CITY, UT; Owner: CITADEL BROADCASTING COMPANY)
KOSY-FM (106.5 FM; SPANISH FORK, UT; Owner: MERCURY BROADCASTING COMPANY, INC.)
KRSP-FM (103.5 FM; SALT LAKE CITY, UT; Owner: SIMMONS-SLC, LS, LLC)
KODJ (94.1 FM; SALT LAKE CITY, UT; Owner: CITICASTERS LICENSES, L.P.)
KUER-FM (90.1 FM; SALT LAKE CITY, UT; Owner: UNIVERSITY OF UTAH)
KBYU-FM (89.1 FM; PROVO, UT; Owner: BRIGHAM YOUNG UNIVERSITY)
KURR (99.5 FM; BOUNTIFUL, UT; Owner: CITICASTERS LICENSES, L.P.)
KBEE-FM (98.7 FM; SALT LAKE CITY, UT; Owner: CITADEL BROADCASTING COMPANY)
TV broadcast stations around North Salt Lake:
K59GS (Channel 59; SALT LAKE CITY, UT; Owner: ALPHA & OMEGA COMMUNICATIONS, LLC)
K66FN (Channel 66; SALT LAKE CITY, UT; Owner: AZTECA BROADCASTING CORPORATION)
KUTV (Channel 2; SALT LAKE CITY, UT; Owner: KUTV HOLDINGS, INC.)
KEJT-LP (Channel 48; SALT LAKE CITY, UT; Owner: TELEMUNDO OF NORTHERN CALIFORNIA LICENSE CORP.)
KSL-TV (Channel 5; SALT LAKE CITY, UT; Owner: BONNEVILLE HOLDING COMPANY)
KULC (Channel 9; OGDEN, UT; Owner: UTAH STATE BOARD OF REGENTS)
KUED (Channel 7; SALT LAKE CITY, UT; Owner: UNIVERSITY OF UTAH)
KUWB (Channel 30; OGDEN, UT; Owner: ACME TV LICENSES OF UTAH, LLC)
KBYU-TV (Channel 11; PROVO, UT; Owner: BRIGHAM YOUNG UNIVERSITY)
KJZZ-TV (Channel 14; SALT LAKE CITY, UT; Owner: LARRY H. MILLER COMMUNICATIONS CORP.)
KSTU (Channel 13; SALT LAKE CITY, UT; Owner: FOX TELEVISION STATIONS INC.)
KTVX (Channel 4; SALT LAKE CITY, UT; Owner: CLEAR CHANNEL BROADCASTING LICENSES, INC.)
KUCL-LP (Channel 26; SALT LAKE CITY, UT; Owner: CHRISTIAN LIFE BROADCASTING)
Home Mortgage Disclosure Act Aggregated Statistics For Year 2009(Based on 3 partial tracts) A) FHA, FSA/RHS & VA B) Conventional C) Refinancings D) Home Improvement Loans F) Non-occupant Loans on G) Loans On Manufactured Number Average Value Number Average Value Number Average Value Number Average Value Number Average Value Number Average Value
LOANS ORIGINATED 93 $199,675 64 $249,115 486 $220,650 8 $139,956 10 $166,520 3 $34,027 APPLICATIONS APPROVED, NOT ACCEPTED 4 $163,090 5 $192,408 54 $225,534 0 $0 0 $0 1 $29,530 APPLICATIONS DENIED 13 $196,238 14 $218,234 117 $270,679 6 $88,362 8 $189,509 5 $22,778 APPLICATIONS WITHDRAWN 12 $241,761 6 $242,563 87 $234,882 1 $198,830 3 $234,500 1 $57,360 FILES CLOSED FOR INCOMPLETENESS 0 $0 1 $353,460 28 $304,660 3 $64,983 0 $0 0 $0
Aggregated Statistics For Year 2008(Based on 3 partial tracts) A) FHA, FSA/RHS & VA B) Conventional C) Refinancings D) Home Improvement Loans E) Loans on Dwellings For 5+ Families F) Non-occupant Loans on G) Loans On Manufactured Number Average Value Number Average Value Number Average Value Number Average Value Number Average Value Number Average Value Number Average Value
LOANS ORIGINATED 108 $210,414 167 $219,085 260 $217,994 16 $147,707 1 $125,700 16 $218,380 3 $27,557 APPLICATIONS APPROVED, NOT ACCEPTED 7 $187,684 27 $324,367 42 $254,563 5 $84,232 0 $0 3 $182,247 1 $21,930 APPLICATIONS DENIED 11 $199,785 39 $301,314 96 $300,136 18 $147,623 0 $0 10 $191,320 7 $45,713 APPLICATIONS WITHDRAWN 16 $209,063 14 $244,364 49 $241,184 6 $125,352 0 $0 3 $173,503 0 $0 FILES CLOSED FOR INCOMPLETENESS 1 $258,190 1 $501,290 9 $406,699 2 $314,485 0 $0 1 $202,460 0 $0
Aggregated Statistics For Year 2007(Based on 3 partial tracts) A) FHA, FSA/RHS & VA B) Conventional C) Refinancings D) Home Improvement Loans E) Loans on Dwellings For 5+ Families F) Non-occupant Loans on G) Loans On Manufactured Number Average Value Number Average Value Number Average Value Number Average Value Number Average Value Number Average Value Number Average Value
LOANS ORIGINATED 48 $184,746 425 $195,158 265 $237,819 25 $131,351 2 $7,895,130 29 $235,806 2 $65,380 APPLICATIONS APPROVED, NOT ACCEPTED 2 $162,815 87 $183,793 44 $270,267 2 $172,595 0 $0 8 $239,372 0 $0 APPLICATIONS DENIED 4 $197,825 83 $222,606 116 $272,589 23 $129,410 0 $0 12 $191,149 3 $52,583 APPLICATIONS WITHDRAWN 5 $172,212 23 $210,280 54 $278,714 9 $116,408 0 $0 3 $197,220 0 $0 FILES CLOSED FOR INCOMPLETENESS 0 $0 7 $178,437 14 $293,962 2 $52,190 0 $0 1 $63,270 0 $0
Aggregated Statistics For Year 2006(Based on 3 partial tracts) A) FHA, FSA/RHS & VA B) Conventional C) Refinancings D) Home Improvement Loans E) Loans on Dwellings For 5+ Families F) Non-occupant Loans on G) Loans On Manufactured Number Average Value Number Average Value Number Average Value Number Average Value Number Average Value Number Average Value Number Average Value
LOANS ORIGINATED 62 $166,386 495 $153,999 234 $232,009 20 $94,580 1 $4,239,930 55 $182,939 2 $10,545 APPLICATIONS APPROVED, NOT ACCEPTED 3 $247,450 70 $198,126 43 $278,482 5 $41,254 0 $0 2 $370,260 0 $0 APPLICATIONS DENIED 3 $174,303 70 $203,801 92 $271,773 20 $61,166 0 $0 12 $195,067 3 $5,907 APPLICATIONS WITHDRAWN 6 $152,270 58 $188,751 44 $339,141 4 $83,235 0 $0 11 $319,873 0 $0 FILES CLOSED FOR INCOMPLETENESS 1 $213,910 9 $210,342 9 $215,573 1 $86,770 0 $0 2 $234,415 0 $0
Aggregated Statistics For Year 2005(Based on 3 partial tracts) A) FHA, FSA/RHS & VA B) Conventional C) Refinancings D) Home Improvement Loans E) Loans on Dwellings For 5+ Families F) Non-occupant Loans on G) Loans On Manufactured Number Average Value Number Average Value Number Average Value Number Average Value Number Average Value Number Average Value Number Average Value
LOANS ORIGINATED 100 $149,598 474 $139,194 198 $220,533 14 $80,316 1 $1,201,390 27 $143,636 3 $56,360 APPLICATIONS APPROVED, NOT ACCEPTED 3 $167,597 48 $177,043 33 $187,579 5 $40,810 0 $0 4 $96,282 5 $29,276 APPLICATIONS DENIED 3 $159,160 67 $160,289 76 $245,228 16 $26,346 1 $3,627,480 13 $132,318 7 $58,254 APPLICATIONS WITHDRAWN 5 $162,236 52 $153,102 35 $212,195 4 $146,798 0 $0 3 $157,070 0 $0 FILES CLOSED FOR INCOMPLETENESS 0 $0 16 $187,487 16 $188,583 1 $39,730 0 $0 2 $106,165 1 $59,050
Aggregated Statistics For Year 2004(Based on 3 partial tracts) A) FHA, FSA/RHS & VA B) Conventional C) Refinancings D) Home Improvement Loans E) Loans on Dwellings For 5+ Families F) Non-occupant Loans on G) Loans On Manufactured Number Average Value Number Average Value Number Average Value Number Average Value Number Average Value Number Average Value Number Average Value
LOANS ORIGINATED 81 $142,471 219 $173,269 197 $204,037 14 $79,875 1 $11,282,580 23 $140,935 2 $25,310 APPLICATIONS APPROVED, NOT ACCEPTED 2 $172,475 32 $207,312 30 $161,475 2 $70,325 0 $0 3 $214,700 3 $40,493 APPLICATIONS DENIED 6 $151,720 47 $141,957 69 $214,958 12 $47,476 0 $0 9 $146,906 6 $48,888 APPLICATIONS WITHDRAWN 10 $141,820 33 $143,855 46 $200,286 1 $100,980 0 $0 6 $143,648 0 $0 FILES CLOSED FOR INCOMPLETENESS 0 $0 2 $322,860 15 $240,554 0 $0 0 $0 1 $111,000 0 $0
Aggregated Statistics For Year 2003(Based on 3 partial tracts) A) FHA, FSA/RHS & VA B) Conventional C) Refinancings D) Home Improvement Loans E) Loans on Dwellings For 5+ Families F) Non-occupant Loans on Number Average Value Number Average Value Number Average Value Number Average Value Number Average Value Number Average Value
LOANS ORIGINATED 18 $136,058 128 $217,701 449 $185,607 11 $36,202 2 $384,620 24 $140,533 APPLICATIONS APPROVED, NOT ACCEPTED 0 $0 18 $220,542 52 $214,949 0 $0 0 $0 4 $141,858 APPLICATIONS DENIED 0 $0 25 $187,638 83 $193,633 7 $20,013 0 $0 9 $251,657 APPLICATIONS WITHDRAWN 0 $0 15 $201,181 66 $174,232 1 $127,910 0 $0 3 $105,267 FILES CLOSED FOR INCOMPLETENESS 0 $0 4 $143,292 20 $269,896 0 $0 0 $0 1 $176,340
Aggregated Statistics For Year 2002(Based on 1 partial tract) A) FHA, FSA/RHS & VA B) Conventional C) Refinancings D) Home Improvement Loans F) Non-occupant Loans on Number Average Value Number Average Value Number Average Value Number Average Value Number Average Value
LOANS ORIGINATED 8 $113,254 13 $123,750 60 $104,016 2 $7,590 3 $119,230 APPLICATIONS APPROVED, NOT ACCEPTED 1 $93,640 3 $280,357 11 $113,733 0 $0 0 $0 APPLICATIONS DENIED 3 $115,293 2 $24,465 17 $116,367 3 $16,873 2 $50,615 APPLICATIONS WITHDRAWN 0 $0 4 $240,215 17 $115,672 1 $4,220 1 $81,830 FILES CLOSED FOR INCOMPLETENESS 0 $0 0 $0 3 $107,420 0 $0 0 $0
Aggregated Statistics For Year 2001(Based on 1 partial tract) A) FHA, FSA/RHS & VA B) Conventional C) Refinancings D) Home Improvement Loans F) Non-occupant Loans on Number Average Value Number Average Value Number Average Value Number Average Value Number Average Value
LOANS ORIGINATED 10 $130,758 30 $95,496 57 $114,404 8 $41,125 6 $96,170 APPLICATIONS APPROVED, NOT ACCEPTED 0 $0 4 $92,162 7 $134,133 2 $12,655 2 $81,405 APPLICATIONS DENIED 0 $0 13 $61,712 27 $88,016 4 $16,872 0 $0 APPLICATIONS WITHDRAWN 2 $96,170 3 $66,363 13 $142,374 1 $113,890 0 $0 FILES CLOSED FOR INCOMPLETENESS 1 $125,700 2 $90,685 5 $90,772 0 $0 1 $117,260
Aggregated Statistics For Year 2000(Based on 1 partial tract) A) FHA, FSA/RHS & VA B) Conventional C) Refinancings D) Home Improvement Loans F) Non-occupant Loans on Number Average Value Number Average Value Number Average Value Number Average Value Number Average Value
LOANS ORIGINATED 7 $120,996 37 $62,632 20 $120,129 6 $21,512 3 $101,513 APPLICATIONS APPROVED, NOT ACCEPTED 0 $0 8 $44,078 8 $82,462 3 $12,937 2 $78,035 APPLICATIONS DENIED 1 $86,890 22 $49,734 13 $95,522 4 $23,620 1 $107,980 APPLICATIONS WITHDRAWN 1 $85,200 3 $148,193 6 $126,680 1 $4,220 0 $0 FILES CLOSED FOR INCOMPLETENESS 0 $0 2 $16,870 3 $95,047 0 $0 0 $0
Aggregated Statistics For Year 1999(Based on 2 partial tracts) A) FHA, FSA/RHS & VA B) Conventional C) Refinancings D) Home Improvement Loans F) Non-occupant Loans on Number Average Value Number Average Value Number Average Value Number Average Value Number Average Value
LOANS ORIGINATED 17 $124,602 97 $152,522 178 $134,458 16 $29,899 28 $108,388 APPLICATIONS APPROVED, NOT ACCEPTED 0 $0 15 $125,544 26 $146,659 2 $20,700 0 $0 APPLICATIONS DENIED 0 $0 24 $130,052 67 $151,232 5 $19,158 3 $112,163 APPLICATIONS WITHDRAWN 2 $103,485 11 $161,743 42 $168,503 1 $20,910 1 $320,340 FILES CLOSED FOR INCOMPLETENESS 0 $0 5 $135,306 24 $157,079 0 $0 1 $78,620
Detailed HMDA statistics for the following Tracts:
1264.03
, 1264.04 , 1270.02
Private Mortgage Insurance Companies Aggregated Statistics For Year 2009(Based on 3 partial tracts) A) Conventional B) Refinancings Number Average Value Number Average Value
LOANS ORIGINATED 12 $227,331 33 $217,258 APPLICATIONS APPROVED, NOT ACCEPTED 3 $267,420 10 $226,124 APPLICATIONS DENIED 3 $137,227 8 $233,118 APPLICATIONS WITHDRAWN 1 $286,680 3 $268,197 FILES CLOSED FOR INCOMPLETENESS 0 $0 0 $0
Aggregated Statistics For Year 2008(Based on 3 partial tracts) A) Conventional B) Refinancings C) Non-occupant Loans on Number Average Value Number Average Value Number Average Value
LOANS ORIGINATED 73 $229,466 26 $213,656 3 $227,720 APPLICATIONS APPROVED, NOT ACCEPTED 31 $251,868 12 $223,828 3 $225,087 APPLICATIONS DENIED 3 $239,247 4 $162,145 2 $224,130 APPLICATIONS WITHDRAWN 1 $256,110 1 $170,920 0 $0 FILES CLOSED FOR INCOMPLETENESS 1 $191,110 0 $0 0 $0
Aggregated Statistics For Year 2007(Based on 3 partial tracts) A) Conventional B) Refinancings C) Non-occupant Loans on Number Average Value Number Average Value Number Average Value
LOANS ORIGINATED 84 $221,158 22 $222,180 4 $260,750 APPLICATIONS APPROVED, NOT ACCEPTED 11 $216,387 6 $265,983 0 $0 APPLICATIONS DENIED 2 $241,865 0 $0 1 $204,990 APPLICATIONS WITHDRAWN 5 $200,658 0 $0 0 $0 FILES CLOSED FOR INCOMPLETENESS 0 $0 0 $0 0 $0
Aggregated Statistics For Year 2006(Based on 3 partial tracts) A) Conventional B) Refinancings Number Average Value Number Average Value
LOANS ORIGINATED 17 $199,499 3 $182,823 APPLICATIONS APPROVED, NOT ACCEPTED 1 $282,740 2 $316,035 APPLICATIONS DENIED 0 $0 0 $0 APPLICATIONS WITHDRAWN 1 $1,088,540 0 $0 FILES CLOSED FOR INCOMPLETENESS 0 $0 0 $0
Aggregated Statistics For Year 2005(Based on 3 partial tracts) A) Conventional B) Refinancings C) Non-occupant Loans on Number Average Value Number Average Value Number Average Value
LOANS ORIGINATED 13 $199,567 12 $185,250 2 $103,340 APPLICATIONS APPROVED, NOT ACCEPTED 3 $298,420 3 $245,807 1 $253,660 APPLICATIONS DENIED 0 $0 0 $0 0 $0 APPLICATIONS WITHDRAWN 1 $350,270 2 $243,835 0 $0 FILES CLOSED FOR INCOMPLETENESS 0 $0 1 $208,340 0 $0
Aggregated Statistics For Year 2004(Based on 3 partial tracts) A) Conventional B) Refinancings C) Non-occupant Loans on Number Average Value Number Average Value Number Average Value
LOANS ORIGINATED 16 $199,040 17 $211,837 2 $128,675 APPLICATIONS APPROVED, NOT ACCEPTED 5 $206,402 7 $196,119 0 $0 APPLICATIONS DENIED 0 $0 0 $0 0 $0 APPLICATIONS WITHDRAWN 1 $213,460 2 $132,645 1 $102,920 FILES CLOSED FOR INCOMPLETENESS 0 $0 0 $0 0 $0
Aggregated Statistics For Year 2003(Based on 3 partial tracts) A) Conventional B) Refinancings C) Non-occupant Loans on Number Average Value Number Average Value Number Average Value
LOANS ORIGINATED 21 $205,384 43 $176,919 4 $121,308 APPLICATIONS APPROVED, NOT ACCEPTED 5 $190,902 11 $188,708 2 $116,230 APPLICATIONS DENIED 0 $0 2 $278,985 0 $0 APPLICATIONS WITHDRAWN 0 $0 5 $158,168 1 $204,650 FILES CLOSED FOR INCOMPLETENESS 0 $0 0 $0 0 $0
Aggregated Statistics For Year 2002(Based on 1 partial tract) A) Conventional B) Refinancings C) Non-occupant Loans on Number Average Value Number Average Value Number Average Value
LOANS ORIGINATED 3 $119,790 8 $132,551 1 $94,480 APPLICATIONS APPROVED, NOT ACCEPTED 1 $122,320 3 $152,130 0 $0 APPLICATIONS DENIED 0 $0 0 $0 0 $0 APPLICATIONS WITHDRAWN 3 $82,953 1 $107,140 0 $0 FILES CLOSED FOR INCOMPLETENESS 0 $0 0 $0 0 $0
Aggregated Statistics For Year 2001(Based on 1 partial tract) A) Conventional B) Refinancings C) Non-occupant Loans on Number Average Value Number Average Value Number Average Value
LOANS ORIGINATED 5 $107,644 6 $116,838 1 $96,170 APPLICATIONS APPROVED, NOT ACCEPTED 0 $0 3 $103,200 0 $0 APPLICATIONS DENIED 0 $0 1 $108,820 0 $0 APPLICATIONS WITHDRAWN 0 $0 0 $0 0 $0 FILES CLOSED FOR INCOMPLETENESS 0 $0 1 $107,140 0 $0
Aggregated Statistics For Year 2000(Based on 1 partial tract) A) Conventional B) Refinancings Number Average Value Number Average Value
LOANS ORIGINATED 4 $126,540 2 $120,215 APPLICATIONS APPROVED, NOT ACCEPTED 0 $0 0 $0 APPLICATIONS DENIED 1 $118,950 1 $87,730 APPLICATIONS WITHDRAWN 0 $0 0 $0 FILES CLOSED FOR INCOMPLETENESS 0 $0 0 $0
Aggregated Statistics For Year 1999(Based on 2 partial tracts) A) Conventional B) Refinancings C) Non-occupant Loans on Number Average Value Number Average Value Number Average Value
LOANS ORIGINATED 22 $178,066 16 $144,721 1 $119,190 APPLICATIONS APPROVED, NOT ACCEPTED 1 $94,510 4 $136,280 0 $0 APPLICATIONS DENIED 1 $119,610 1 $163,800 0 $0 APPLICATIONS WITHDRAWN 0 $0 0 $0 0 $0 FILES CLOSED FOR INCOMPLETENESS 0 $0 0 $0 0 $0
Detailed PMIC statistics for the following Tracts:
1264.03
, 1264.04 , 1270.02
Most common first names in North Salt Lake, UT among deceased individuals Name Count Lived (average)
John 20 73.4 years Charles 14 80.1 years Robert 14 73.3 years William 11 78.5 years Harold 9 77.6 years Mary 9 77.3 years Thomas 8 75.9 years Frank 8 78.7 years Glen 7 78.4 years Joseph 7 82.3 years
Most common last names in North Salt Lake, UT among deceased individuals Last name Count Lived (average)
Smith 20 73.0 years Johnson 11 76.9 years Christensen 8 81.6 years Howard 7 83.3 years Anderson 7 71.1 years Jensen 7 77.8 years Clark 6 74.8 years Thompson 6 88.1 years Hatch 5 79.4 years Nielsen 5 81.4 years
North Salt Lake compared to Utah state average:
Unemployed percentage significantly below state average. Hispanic race population percentage above state average. Foreign-born population percentage significantly above state average. Length of stay since moving in above state average. House age below state average. Number of college students above state average. Percentage of population with a bachelor's degree or higher above state average. North Salt Lake on our top lists :
#50 on the list of "Top 101 cities with the most residents born in Czechoslovakia (includes Czech Republic and Slovakia) (population 500+)"
#24 (84010) on the list of "Top 101 zip codes with the largest percentage of English first ancestries (pop 5,000+)"
#33 (84010) on the list of "Top 101 zip codes with the largest charity contributions deductions as a percentage of AGI in 2012 (pop 5,000+)"
#52 (84010) on the list of "Top 101 zip codes with the largest percentage of Danish first ancestries (pop 5,000+)"
#2 on the list of "Top 101 counties with the lowest percentage of residents that smoked 100+ cigarettes in their lives"
#5 on the list of "Top 101 counties with the most Other congregations"
#7 on the list of "Top 101 counties with the highest number of births per 1000 residents 2007-2013"
#7 on the list of "Top 101 counties with the most Other adherents"
#12 on the list of "Top 101 counties with highest percentage of residents voting for Romney (Republican) in the 2012 Presidential Election (pop. 50,000+)"
Top Patent Applicants
Kelly B. Powers (40)
Donald D. Solomon (19)
John William Hall (17)
Carleton Drew Tait (13)
John W. Hall (7)
David Hilton (4)
Steven A. Walker (4)
Timothy R. Nieman (4)
Matt Draper (3)
Christopher F. Smith (3)
Total of 237 patent applications in 2008-2024.


 Recent articles from our blog. Our writers, many of them Ph.D. graduates or candidates, create easy-to-read articles on a wide variety of topics.

 , pop. 89,128).
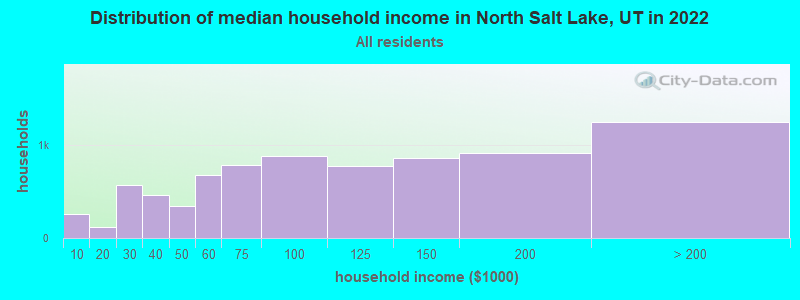
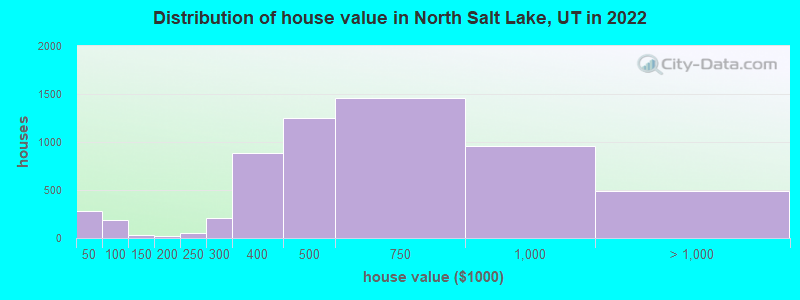
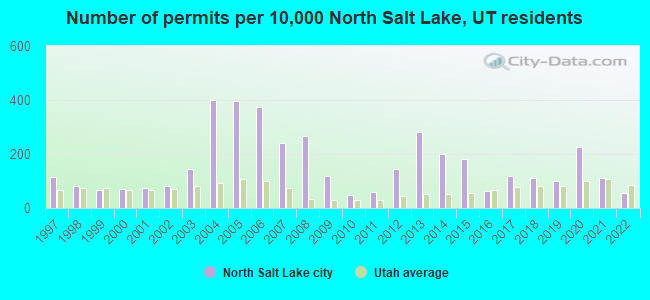
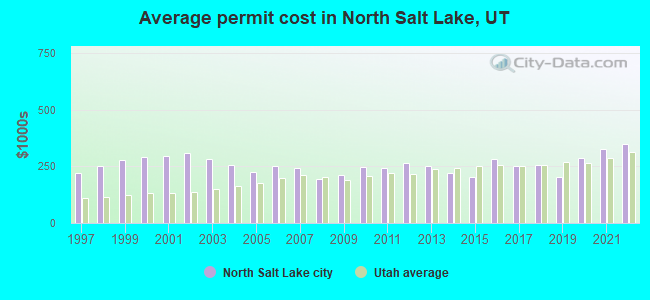
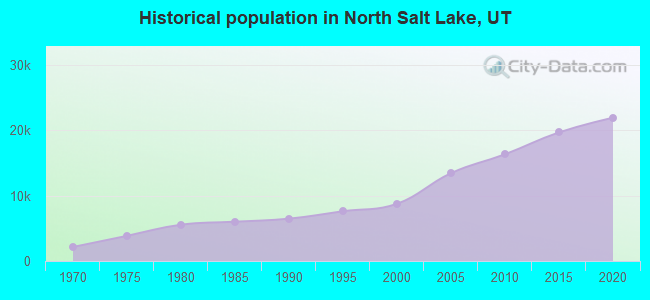
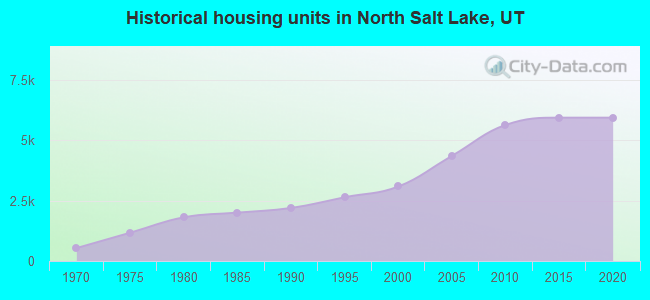
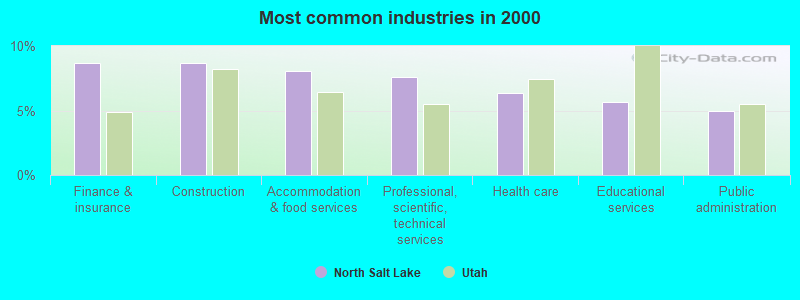
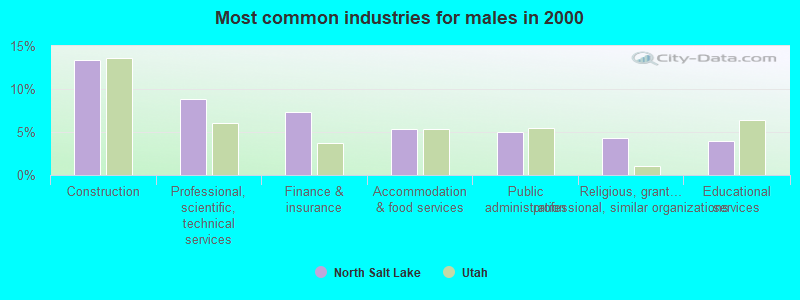
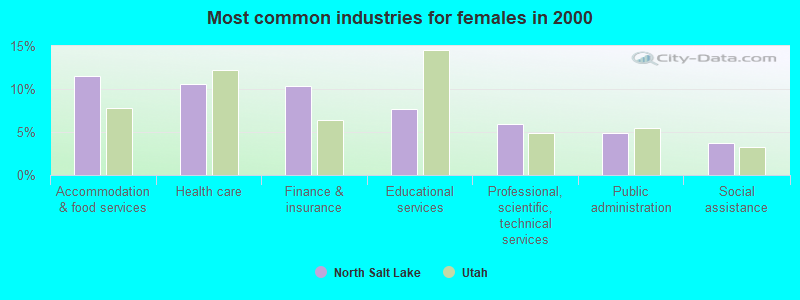
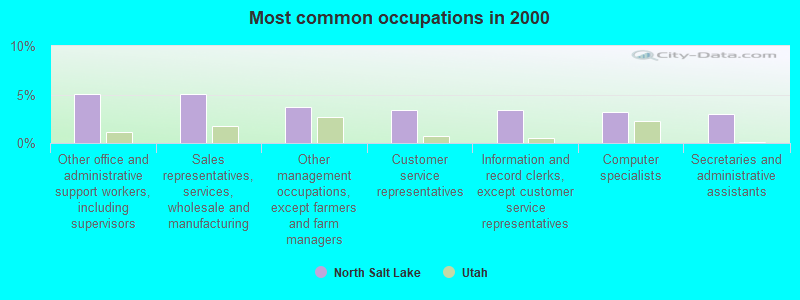
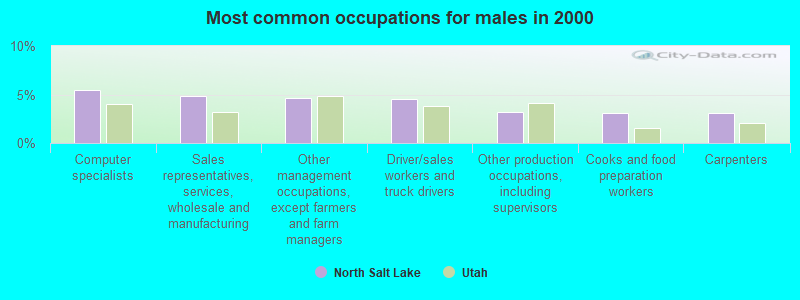
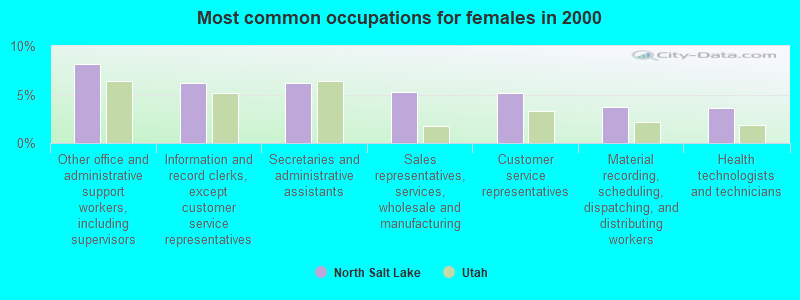

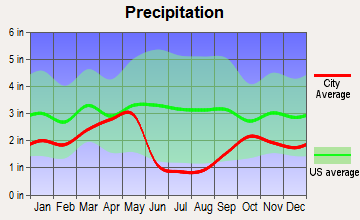
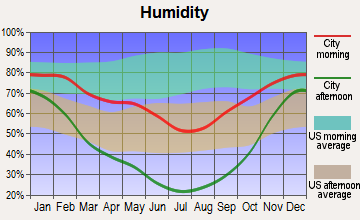
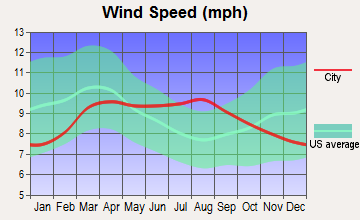
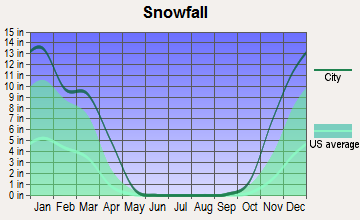
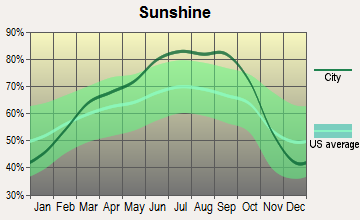
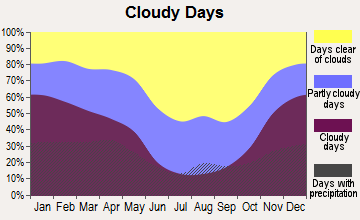
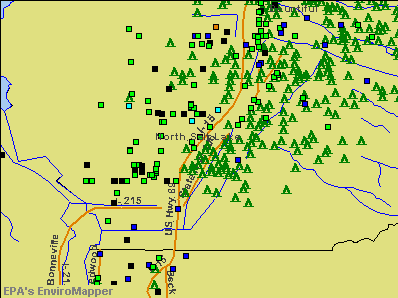

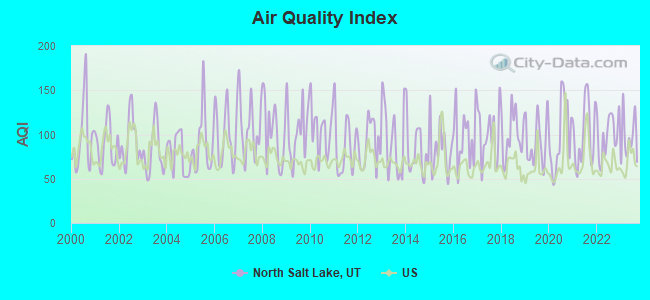
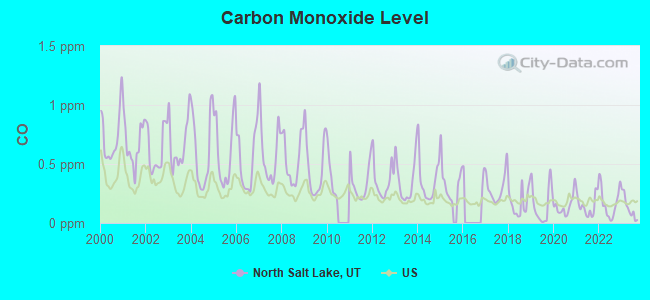
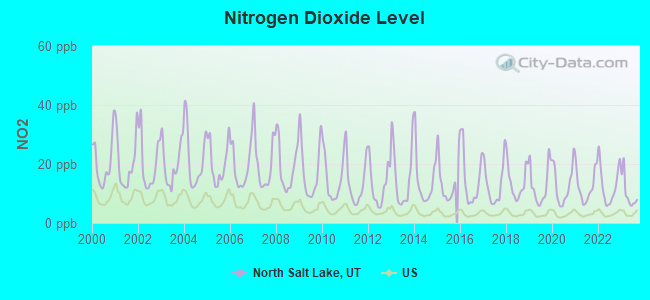
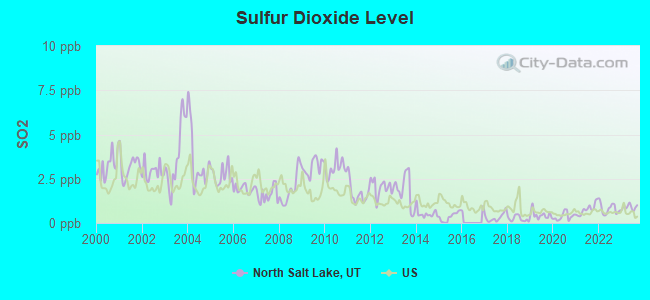
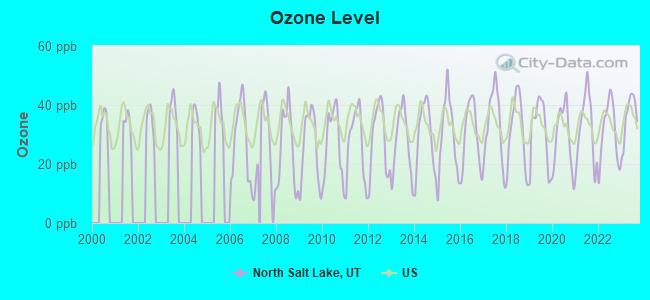
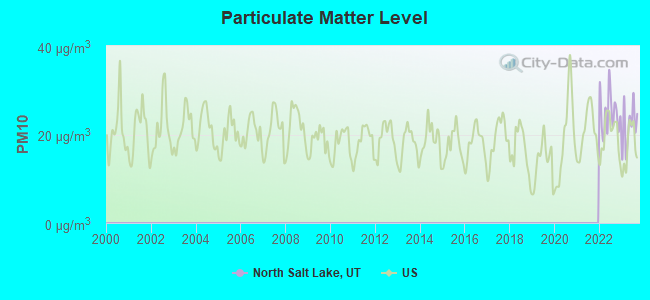
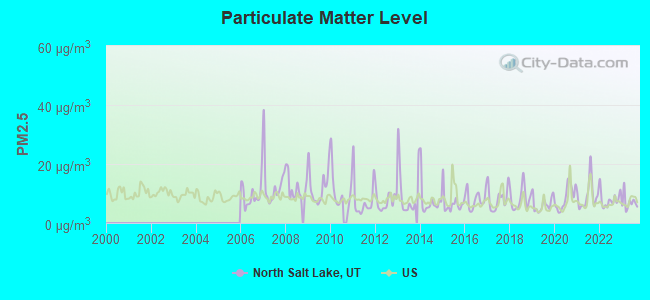
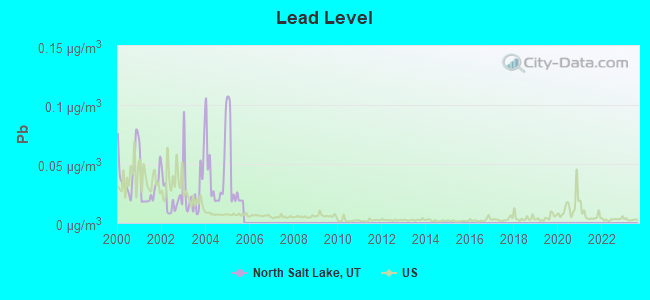
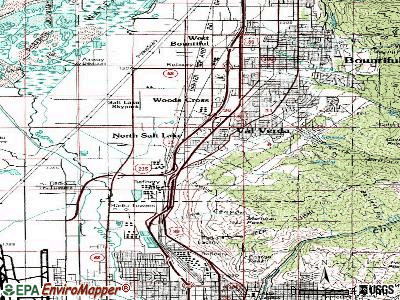
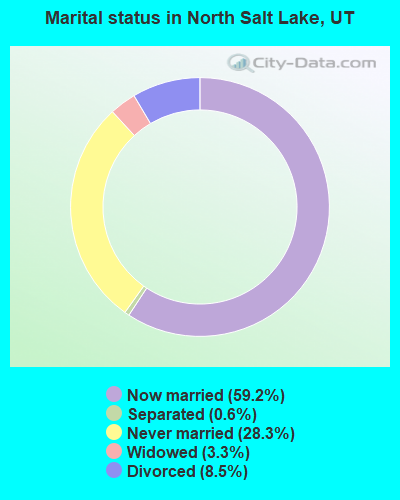
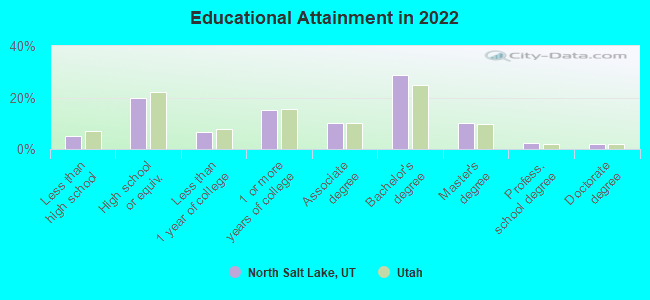
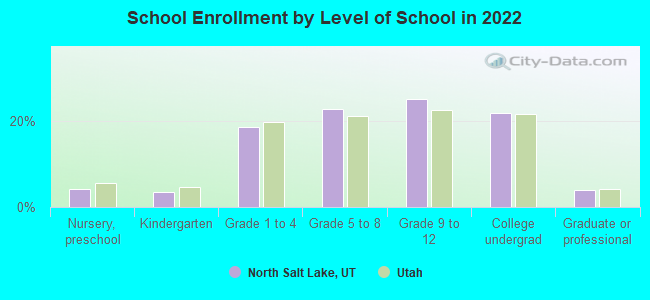
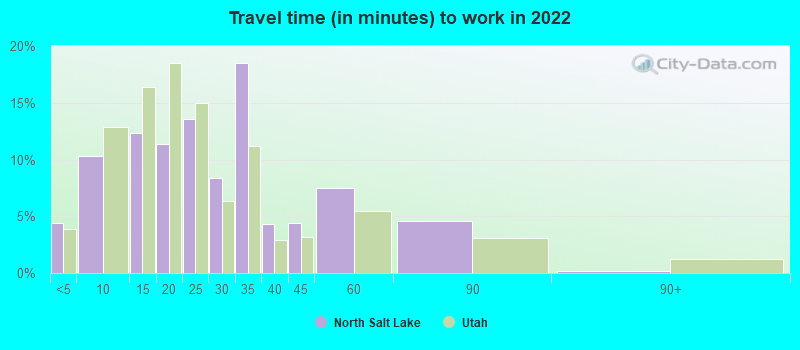
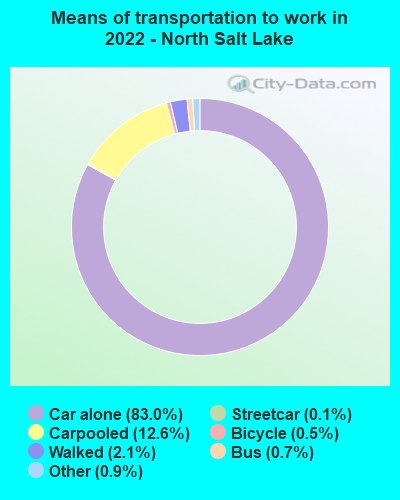
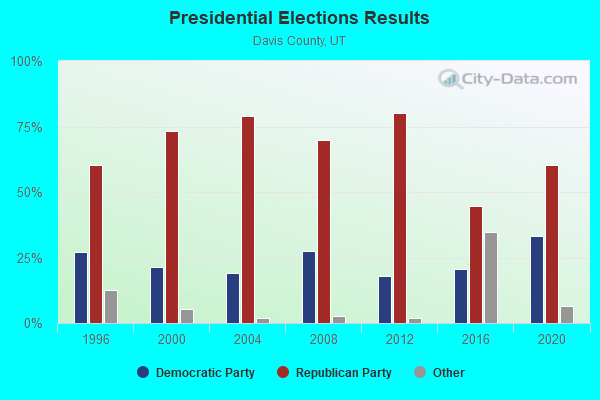
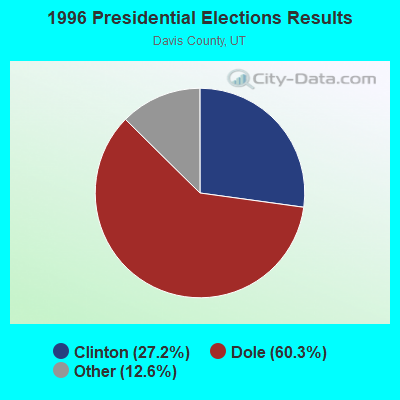
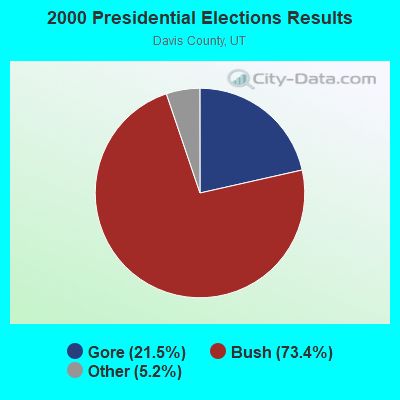
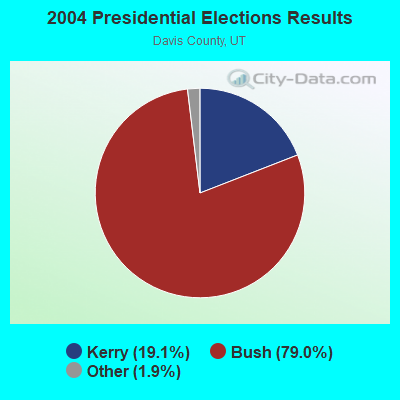
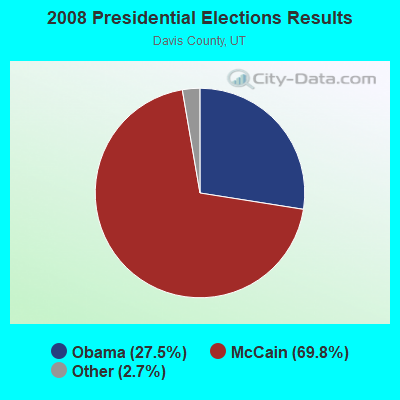
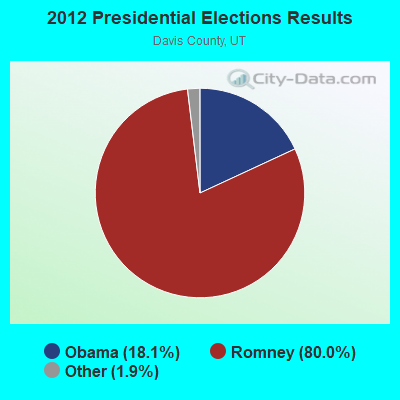
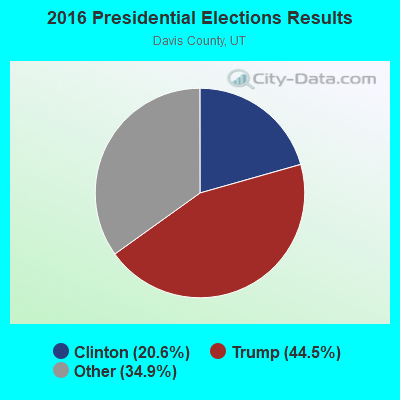
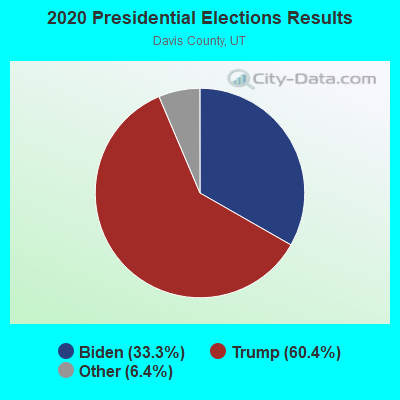
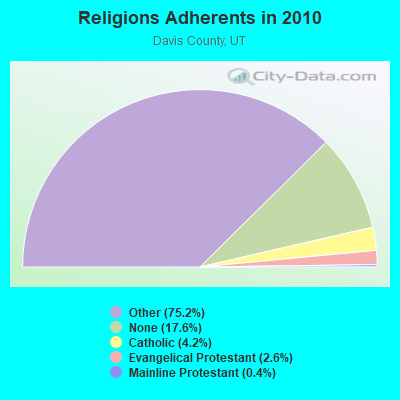
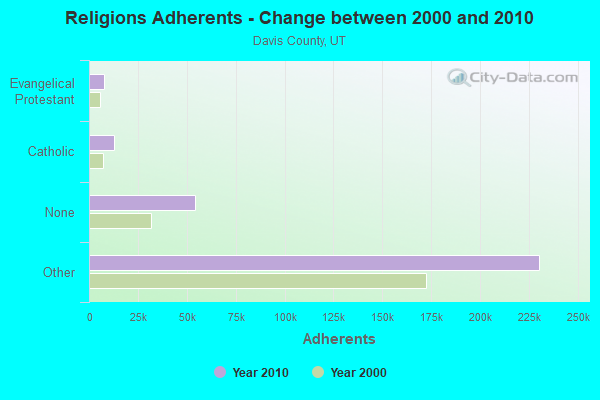
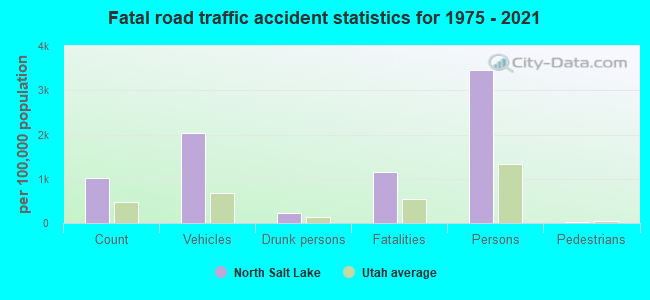
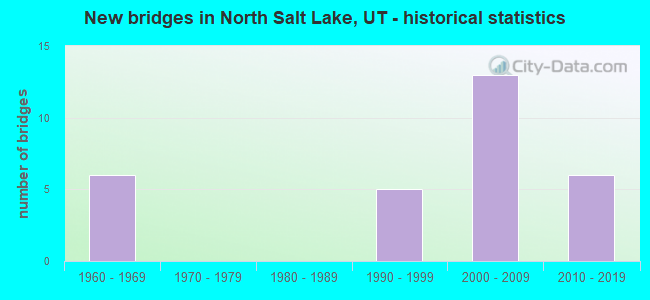
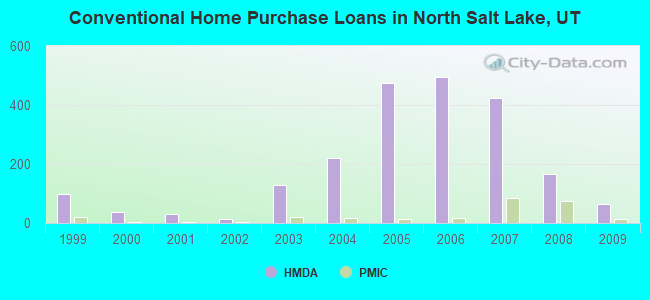
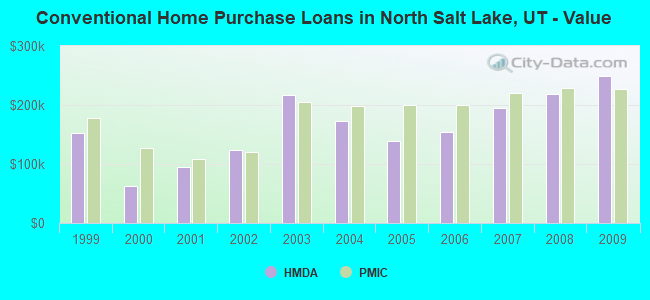
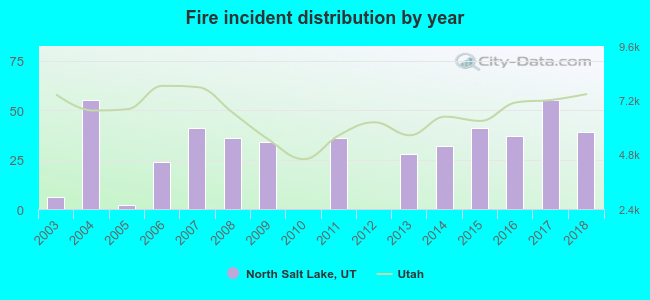 According to the data from the years 2003 - 2018 the average number of fires per year is 29. The highest number of fires - 55 took place in 2004, and the least - 0 in 2010. The data has a rising trend.
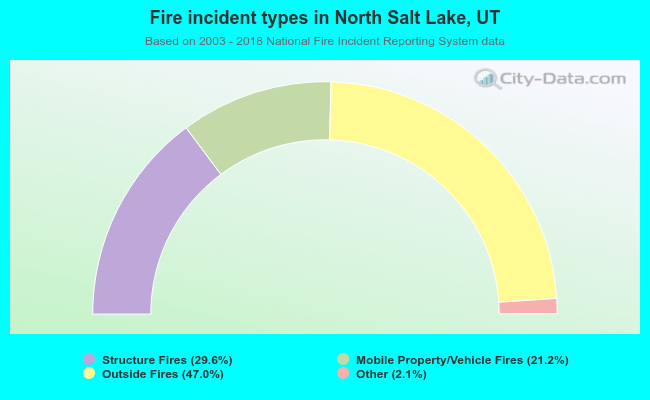 When looking into fire subcategories, the most reports belonged to: Outside Fires (47.0%), and Structure Fires (29.6%).