North Salt Lake, UT (Utah) Houses and Residents
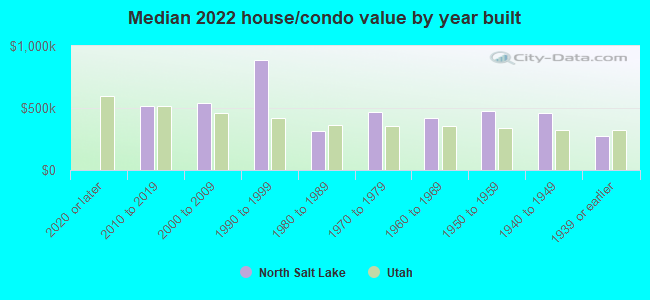
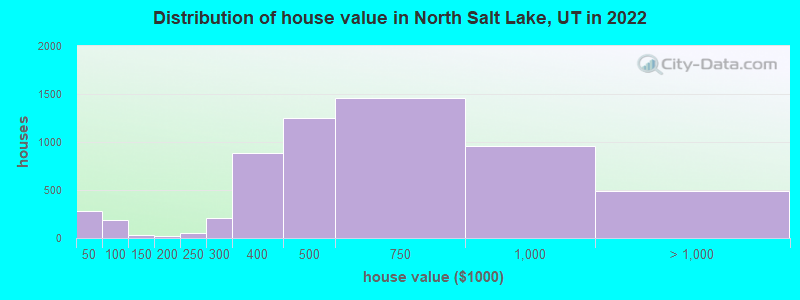
Estimated median house or condo value in 2022: $535,660 (it was $154,800 in 2000 )
North Salt Lake:
$535,660Utah:
$499,500
Lower value quartile - upper value quartile: $404,865 - $715,209Total population: 19,193 (Urban population: 7,921, Rural population: 804 (all nonfarm) )
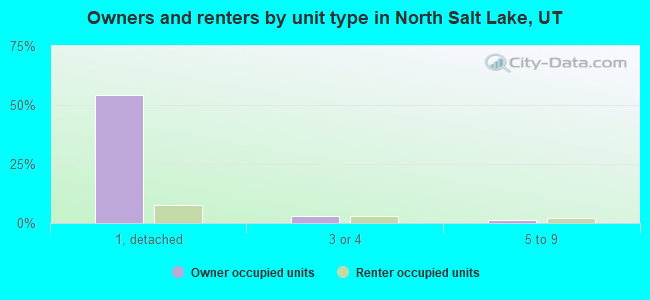
Houses: 8,141 (7,878 occupied: 5,498 owner occupied, 2,321 renter occupied )
% of renters here:
30%State:
29%
Housing density: 987 houses/condos per square mile
Median price asked for vacant for-sale houses and condos in 2022 in this county: $500,085.
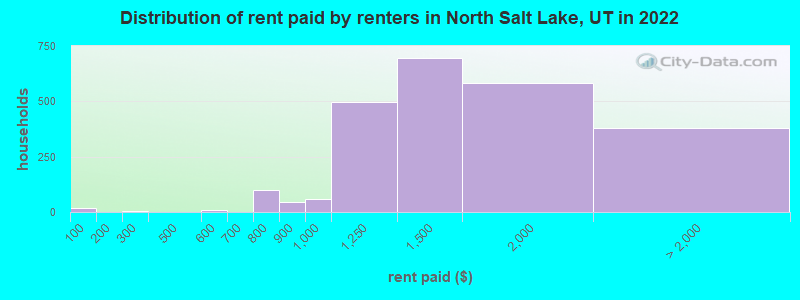
Median contract rent in 2022: $1,502 (lower quartile is $1,262, upper quartile is $1,795)
Median rent asked for vacant for-rent units in 2022: $2,351
Median gross rent in North Salt Lake, UT in 2022: $1,688
Housing units in North Salt Lake with a mortgage: 3,607 (550 second mortgage, 15 home equity loan, 379 both second mortgage and home equity loan )Houses without a mortgage: 24
Median household income for houses/condos with a mortgage: $122,175
Median household income for apartments without a mortgage: $72,211
Median monthly housing costs: $1,517
Data:
Median house or condo value ($)
Median house or condo value ($ change since 2000)
Median house or condo value ($) - White
Median house or condo value ($) - Black or African American
Median house or condo value ($) - Asian
Median house or condo value ($) - Hispanic or Latino
Median house or condo value ($) - American Indian and Alaska Native
Median house or condo value ($) - Multirace
Median house or condo value ($) - Other Race
Median price asked for mobile homes ($)
Household density (households per square mile)
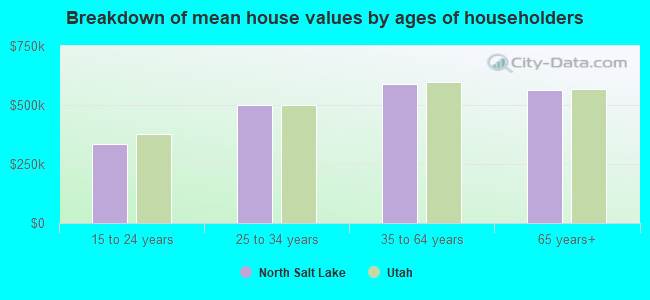
Mean house or condo value by units in structure - 1, detached ($)
Mean house or condo value by units in structure - 1, attached ($)
Mean house or condo value by units in structure - 2 ($)
Mean house or condo value by units in structure by units in structure - 3 or 4 ($)
Mean house or condo value by units in structure - 5 or more ($)
Mean house or condo value by units in structure - Boat, RV, van, etc. ($)
Mean house or condo value by units in structure - Mobile home ($)
Median contract rent ($)
Median contract rent - Lower quartile ($)
Median contract rent - Upper quartile ($)
Median gross rent ($)
Urban houses (%)
Rural houses (%)
Houses occupied (%)
Houses occupied (% change since 2000)
Houses owner occupied (%)
Houses owner occupied (% change since 2000)
Houses renter occupied (%)
Houses renter occupied (% change since 2000)
Vacant housing units - For rent (%)
Vacant housing units - For rent (% change since 2000)
Vacant housing units - For sale only (%)
Vacant housing units - For sale only (% change since 2000)
Vacant housing units - Rented or sold, not occupied (%)
Vacant housing units - Rented or sold, not occupied (% change since 2000)
Vacant housing units - For seasonal, recreational, or occasional use (%)
Vacant housing units - For seasonal, recreational, or occasional use (% change since 2000)
Vacant housing units - For migrant workers (%)
Vacant housing units - For migrant workers (% change since 2000)
Vacant housing units - Other vacant (%)
Vacant housing units - Other vacant (% change since 2000)
Median monthly housing costs ($)
Median household income for houses/condos with a mortgage ($)
Median household income for houses/condos without a mortgage ($)
Median household income ($)
Median household income ($) - White
Median household income ($) - Black or African American
Median household income ($) - Asian
Median household income ($) - Hispanic or Latino
Median household income ($) - American Indian and Alaska Native
Median household income ($) - Multirace
Median household income ($) - Other Race
Mortgage status - with mortgage (%)
Mortgage status - with second mortgage (%)
Mortgage status - with home equity loan (%)
Mortgage status - with both second mortgage and home equity loan (%)
Mortgage status - without a mortgage (%)
Median year house/condo built
Median year apartment built
Household type by relationship - Male householder living alone (%)
Household type by relationship - Male householder not living alone (%)
Household type by relationship - Female householder living alone (%)
Household type by relationship - Female householder not living alone (%)
Household type by relationship - Opposite-Sex spouse (%)
Household type by relationship - Same-Sex spouse (%)
Household type by relationship - Opposite-Sex unmarried partner (%)
Household type by relationship - Same-Sex unmarried partner (%)
Household type by relationship - In group quarters (%)
Size of family households - 2-person household (%)
Size of family households - 3-person household (%)
Size of family households - 4-person household (%)
Size of family households - 5-person household (%)
Size of family households - 6-person household (%)
Size of family households - 7-or-more-person household (%)
Size of nonfamily households - 1-person household (%)
Size of nonfamily households - 2-person household (%)
Size of nonfamily households - 3-person household (%)
Size of nonfamily households - 4-person household (%)
Size of nonfamily households - 5-person household (%)
Size of nonfamily households - 6-person household (%)
Size of nonfamily households - 7-or-moreperson household (%)
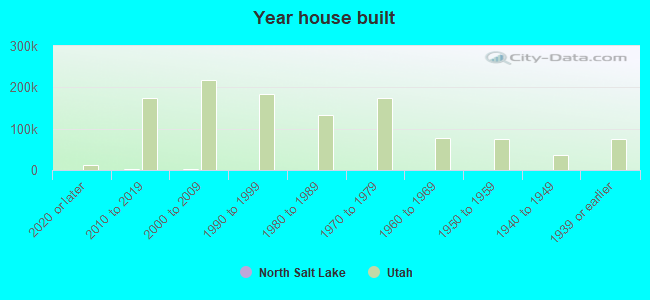
Year house built - Built 2010 or later (%)
Year house built - Built 2000 to 2009 (%)
Year house built - Built 1990 to 1999 (%)
Year house built - Built 1980 to 1989 (%)
Year house built - Built 1970 to 1979 (%)
Year house built - Built 1960 to 1969 (%)
Year house built - Built 1950 to 1959 (%)
Year house built - Built 1940 to 1949 (%)
Year house built - Built 1939 or earlier (%)
Median number of rooms in houses and condos
Median number of rooms in apartments
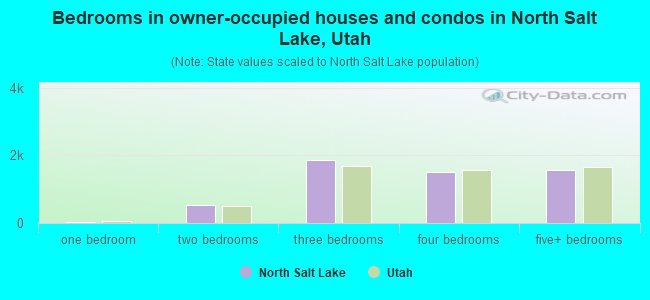
Median number of bedrooms in owner occupied houses
Mean number of bedrooms in owner occupied houses
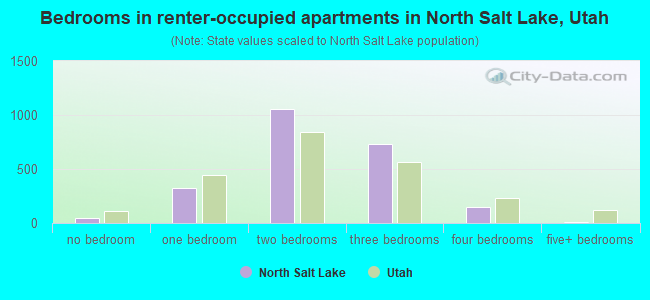
Median number of bedrooms in renter occupied houses
Mean number of bedrooms in renter occupied houses
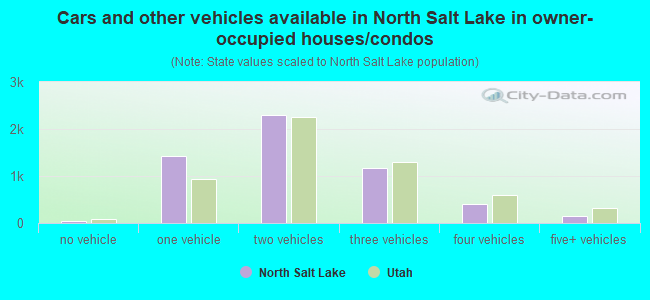
Median number of vehichles in owner occupied houses
Mean number of vehichles in owner occupied houses
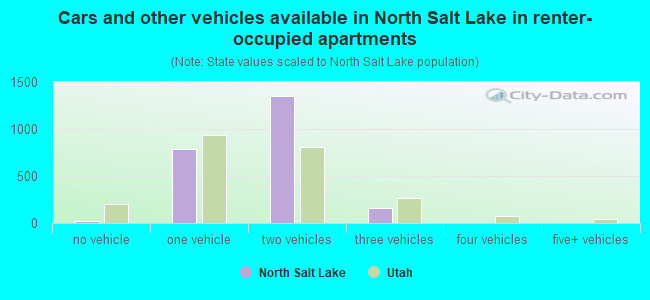
Median number of vehichles in renter occupied houses
Mean number of vehichles in renter occupied houses
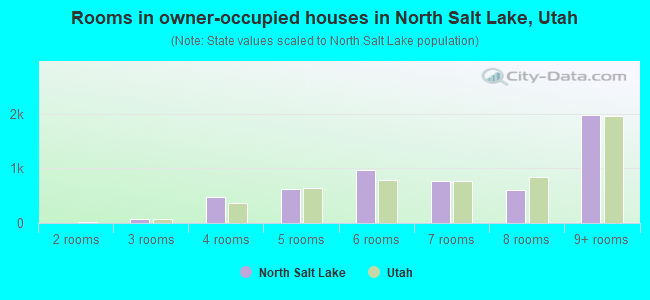
Rooms in owner-occupied houses - 1 room (%)
Rooms in owner-occupied houses - 2 rooms (%)
Rooms in owner-occupied houses - 3 rooms (%)
Rooms in owner-occupied houses - 4 rooms (%)
Rooms in owner-occupied houses - 5 rooms (%)
Rooms in owner-occupied houses - 6 rooms (%)
Rooms in owner-occupied houses - 7 rooms (%)
Rooms in owner-occupied houses - 8 rooms (%)
Rooms in owner-occupied houses - 9+ rooms (%)
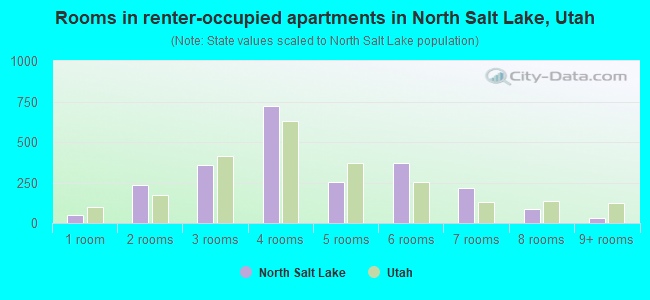
Rooms in renter-occupied houses - 1 room (%)
Rooms in renter-occupied houses - 2 rooms (%)
Rooms in renter-occupied houses - 3 rooms (%)
Rooms in renter-occupied houses - 4 rooms (%)
Rooms in renter-occupied houses - 5 rooms (%)
Rooms in renter-occupied houses - 6 rooms (%)
Rooms in renter-occupied houses - 7 rooms (%)
Rooms in renter-occupied houses - 8 rooms (%)
Rooms in renter-occupied houses - 9+ rooms (%)
Bedrooms in owner-occupied houses - no bedrooms (%)
Bedrooms in owner-occupied houses - 1 bedroom (%)
Bedrooms in owner-occupied houses - 2 bedrooms (%)
Bedrooms in owner-occupied houses - 3 bedrooms (%)
Bedrooms in owner-occupied houses - 4 bedrooms (%)
Bedrooms in owner-occupied houses - 5+ bedrooms (%)
Bedrooms in renter-occupied houses - no bedrooms (%)
Bedrooms in renter-occupied houses - 1 bedroom (%)
Bedrooms in renter-occupied houses - 2 bedrooms (%)
Bedrooms in renter-occupied houses - 3 bedrooms (%)
Bedrooms in renter-occupied houses - 4 bedrooms (%)
Bedrooms in renter-occupied houses - 5+ bedrooms (%)
Vehicles available in owner-occupied houses - no vehicle available (%)
Vehicles available in owner-occupied houses - 1 vehicle available(%)
Vehicles available in owner-occupied houses - 2 Vehicles available (%)
Vehicles available in owner-occupied houses - 3 Vehicles available (%)
Vehicles available in owner-occupied houses - 4 Vehicles available (%)
Vehicles available in owner-occupied houses - 5+ Vehicles available (%)
Vehicles available in renter-occupied houses - no vehicle available (%)
Vehicles available in renter-occupied houses - 1 vehicle available (%)
Vehicles available in renter-occupied houses - 2 Vehicles available (%)
Vehicles available in renter-occupied houses - 3 Vehicles available (%)
Vehicles available in renter-occupied houses - 4 Vehicles available (%)
Vehicles available in renter-occupied houses - 5+ Vehicles available (%)
Housing units in structures - 1, detached (%)
Housing units in structures - 1, attached (%)
Housing units in structures - 2 (%)
Housing units in structures - 3 or 4 (%)
Housing units in structures - 5 to 9 (%)
Housing units in structures - 10 to 19 (%)
Housing units in structures - 20 to 49 (%)
Housing units in structures - 50 or more (%)
Housing units in structures - Mobile home (%)
Housing units in structures - Boat, RV, van, etc. (%)
Housing units in structures - Owners - 1, detached (%)
Housing units in structures - Owners - 1, attached (%)
Housing units in structures - Owners - 2 (%)
Housing units in structures - Owners - 3 or 4 (%)
Housing units in structures - Owners - 5 to 9 (%)
Housing units in structures - Owners - 10 to 19 (%)
Housing units in structures - Owners - 20 to 49 (%)
Housing units in structures - Owners - 50 or more (%)
Housing units in structures - Owners - Mobile home (%)
Housing units in structures - Owners - Boat, RV, van, etc. (%)
Housing units in structures - Renters - 1, detached (%)
Housing units in structures - Renters - 1, attached (%)
Housing units in structures - Renters - 2 (%)
Housing units in structures - Renters - 3 or 4 (%)
Housing units in structures - Renters - 5 to 9 (%)
Housing units in structures - Renters - 10 to 19 (%)
Housing units in structures - Renters - 20 to 49 (%)
Housing units in structures - Renters - 50 or more (%)
Housing units in structures - Renters - Mobile home (%)
Housing units in structures - Renters - Boat, RV, van, etc. (%)
House/condo owner moved in on average (years ago)
Renter moved in on average (years ago)
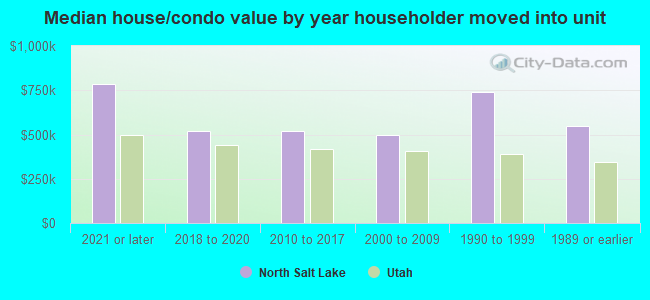
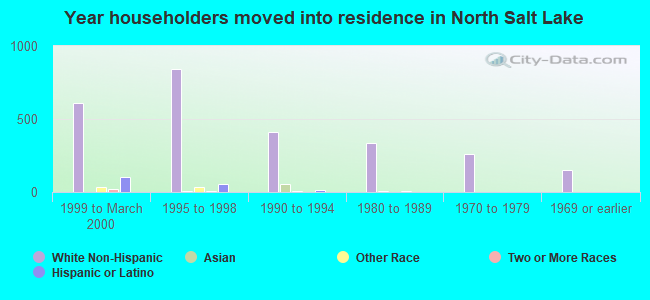
Year householder moved into unit - Moved in 1999 to March 2000 (%)
Year householder moved into unit - Moved in 1999 to March 2000 (%) - White
Year householder moved into unit - Moved in 1999 to March 2000 (%) - Black or African American
Year householder moved into unit - Moved in 1999 to March 2000 (%) - Asian
Year householder moved into unit - Moved in 1999 to March 2000 (%) - Hispanic or Latino
Year householder moved into unit - Moved in 1999 to March 2000 (%) - American Indian and Alaska Native
Year householder moved into unit - Moved in 1999 to March 2000 (%) - Multirace
Year householder moved into unit - Moved in 1999 to March 2000 (%) - Other Race
Year householder moved into unit - Moved in 1995 to 1998 (%)
Year householder moved into unit - Moved in 1995 to 1998 (%) - White
Year householder moved into unit - Moved in 1995 to 1998 (%) - Black or African American
Year householder moved into unit - Moved in 1995 to 1998 (%) - Asian
Year householder moved into unit - Moved in 1995 to 1998 (%) - Hispanic or Latino
Year householder moved into unit - Moved in 1995 to 1998 (%) - American Indian and Alaska Native
Year householder moved into unit - Moved in 1995 to 1998 (%) - Multirace
Year householder moved into unit - Moved in 1995 to 1998 (%) - Other Race
Year householder moved into unit - Moved in 1990 to 1994 (%)
Year householder moved into unit - Moved in 1990 to 1994 (%) - White
Year householder moved into unit - Moved in 1990 to 1994 (%) - Black or African American
Year householder moved into unit - Moved in 1990 to 1994 (%) - Asian
Year householder moved into unit - Moved in 1990 to 1994 (%) - Hispanic or Latino
Year householder moved into unit - Moved in 1990 to 1994 (%) - American Indian and Alaska Native
Year householder moved into unit - Moved in 1990 to 1994 (%) - Multirace
Year householder moved into unit - Moved in 1990 to 1994 (%) - Other Race
Year householder moved into unit - Moved in 1980 to 1989 (%)
Year householder moved into unit - Moved in 1980 to 1989 (%) - White
Year householder moved into unit - Moved in 1980 to 1989 (%) - Black or African American
Year householder moved into unit - Moved in 1980 to 1989 (%) - Asian
Year householder moved into unit - Moved in 1980 to 1989 (%) - Hispanic or Latino
Year householder moved into unit - Moved in 1980 to 1989 (%) - American Indian and Alaska Native
Year householder moved into unit - Moved in 1980 to 1989 (%) - Multirace
Year householder moved into unit - Moved in 1980 to 1989 (%) - Other Race
Year householder moved into unit - Moved in 1970 to 1979 (%)
Year householder moved into unit - Moved in 1970 to 1979 (%) - White
Year householder moved into unit - Moved in 1970 to 1979 (%) - Black or African American
Year householder moved into unit - Moved in 1970 to 1979 (%) - Asian
Year householder moved into unit - Moved in 1970 to 1979 (%) - Hispanic or Latino
Year householder moved into unit - Moved in 1970 to 1979 (%) - American Indian and Alaska Native
Year householder moved into unit - Moved in 1970 to 1979 (%) - Multirace
Year householder moved into unit - Moved in 1970 to 1979 (%) - Other Race
Year householder moved into unit - Moved in 1969 or earlier (%)
Year householder moved into unit - Moved in 1969 or earlier (%) - White
Year householder moved into unit - Moved in 1969 or earlier (%) - Black or African American
Year householder moved into unit - Moved in 1969 or earlier (%) - Asian
Year householder moved into unit - Moved in 1969 or earlier (%) - Hispanic or Latino
Year householder moved into unit - Moved in 1969 or earlier (%) - American Indian and Alaska Native
Year householder moved into unit - Moved in 1969 or earlier (%) - Multirace
Year householder moved into unit - Moved in 1969 or earlier (%) - Other Race
Housing units lacking complete plumbing facilities (%)
Housing units lacking complete kitchen facilities (%)
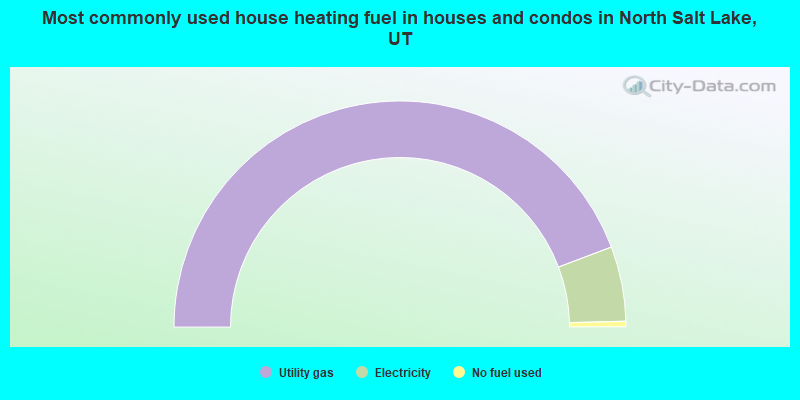
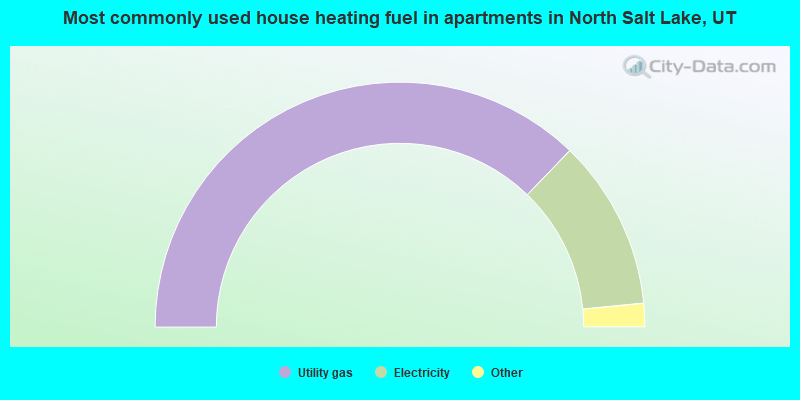
House heating fuel used in houses and condos - Utility gas (%)
House heating fuel used in houses and condos - Bottled, tank, or LP gas (%)
House heating fuel used in houses and condos - Electricity (%)
House heating fuel used in houses and condos - Fuel oil, kerosene, etc. (%)
House heating fuel used in houses and condos - Coal or coke (%)
House heating fuel used in houses and condos - Wood (%)
House heating fuel used in houses and condos - Solar energy (%)
House heating fuel used in houses and condos - Other fuel (%)
House heating fuel used in houses and condos - No fuel used (%)
House heating fuel used in apartments - Utility gas (%)
House heating fuel used in apartments - Bottled, tank, or LP gas (%)
House heating fuel used in apartments - Electricity (%)
House heating fuel used in apartments - Fuel oil, kerosene, etc. (%)
House heating fuel used in apartments - Coal or coke (%)
House heating fuel used in apartments - Wood (%)
House heating fuel used in apartments - Solar energy (%)
House heating fuel used in apartments - Other fuel (%)
House heating fuel used in apartments - No fuel used (%)
Median year house/condo built: 2004Median year apartment built: 2003Household type by relationship:
Households: 22,291
Male householders: 3,540 (527 living alone ), Female householders: 4,117 (732 living alone )4,701 spouses (4,694 opposite-sex spouses ), 298 unmarried partners , (280 opposite-sex unmarried partners ), 7,965 children (7,303 natural , 167 adopted , 495 stepchildren ), 256 grandchildren , 157 brothers or sisters , 165 parents , 0 foster children , 375 other relatives , 712 non-relatives
Size of family households: 2,469 2-persons , 1,545 3-persons , 971 4-persons , 661 5-persons , 395 6-persons , 209 7-or-more-persons .
Size of nonfamily households: 1,193 1-person , 317 2-persons , 41 3-persons .
4,528 married couples with children. single-parent households (426 men , 790 women ).
81.5% of residents of North Salt Lake speak English at home. of residents speak Spanish at home (64% speak English very well , 15% speak English well , 19% speak English not well , 2% don't speak English at all ).of residents speak other Indo-European language at home (51% speak English very well , 38% speak English well , 11% speak English not well ).of residents speak Asian or Pacific Island language at home (62% speak English very well , 34% speak English well , 1% speak English not well , 2% don't speak English at all ).of residents speak other language at home (100% speak English very well ).
Foreign born population: 2,400 (10.8%)of them are naturalized citizens )
Median number of rooms in houses and condos:
Median number of rooms in apartments
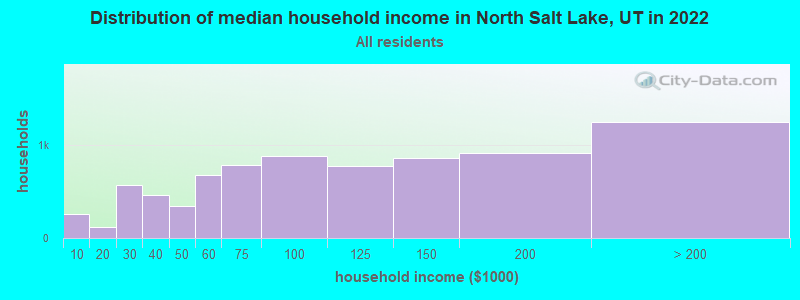
North Salt Lake, UT household income distribution 254 Less than $10,000118 $10,000 to $19,999567 $20,000 to $29,999467 $30,000 to $39,999345 $40,000 to $49,999681 $50,000 to $59,999784 $60,000 to $74,999884 $75,000 to $99,999770 $100,000 to $124,999857 $125,000 to $149,999914 $150,000 to $199,9991,246 $200,000 or more
Home value of owner - occupied houses in 2022 in North Salt Lake, UT 111 Less than $10,00052 $10,000 to $14,99938 $15,000 to $19,99941 $25,000 to $29,99927 $30,000 to $34,99914 $40,000 to $49,99981 $50,000 to $59,99929 $60,000 to $69,99930 $70,000 to $79,9991 $80,000 to $89,99925 $90,000 to $99,9996 $100,000 to $124,99929 $125,000 to $149,99921 $175,000 to $199,99954 $200,000 to $249,999206 $250,000 to $299,999882 $300,000 to $399,9991,252 $400,000 to $499,9991,460 $500,000 to $749,999962 $750,000 to $999,999397 $1,000,000 to $1,499,99971 $1,500,000 to $1,999,99924 $2,000,000 or moreRent paid by renters in 2022 in North Salt Lake, UT 19 Less than $1004 $250 to $2999 $550 to $599100 $750 to $79942 $800 to $89958 $900 to $999495 $1,000 to $1,249696 $1,250 to $1,499585 $1,500 to $1,999259 $2,000 to $2,49911 $2,500 to $2,99925 $3,000 to $3,49983 No cash rent
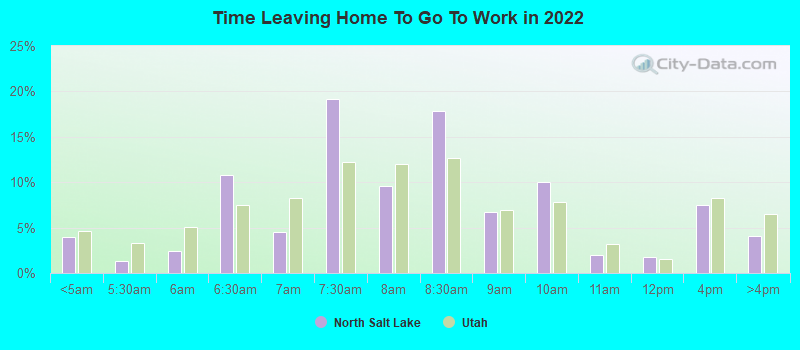
Percentage of workers working in this county: 50.4%Number of people working at home: 3,017 (24.9% of all workers )
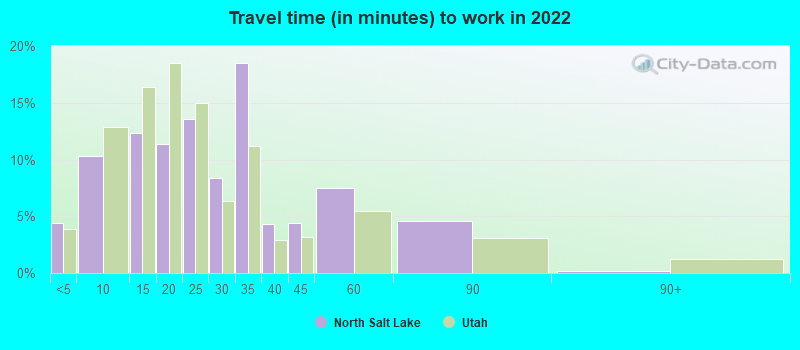
Travel time to work (commute)
Less than 5 minutes: 5635 to 9 minutes: 89310 to 14 minutes: 69715 to 19 minutes: 2,01420 to 24 minutes: 1,89525 to 29 minutes: 1,02430 to 34 minutes: 1,21335 to 39 minutes: 25740 to 44 minutes: 16045 to 59 minutes: 32060 to 89 minutes: 7490 or more minutes: 48
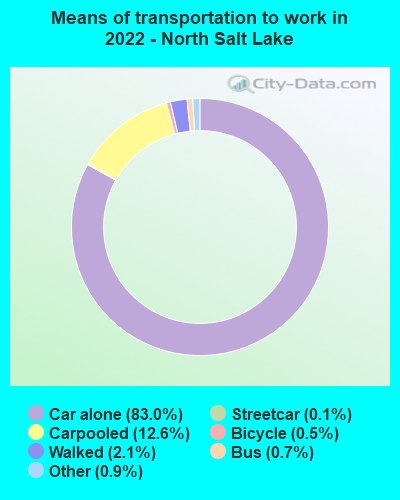
Means of transportation to work:
Drove a car alone: 6,703 (59.7%)Carpooled: 1,286 (11.5%)Bus : 119 (1.1%)Subway or elevated rail : 6 (0.1%)Taxi: 106 (0.9%)Bicycle: 40 (0.4%)Walked: 172 (1.5%)Worked at home: 3,017 (26.9%)
Unemployment by race in 2022
Unemployment rate for White non-Hispanic residents 1.2% Males3.9% FemalesUnemployment rate for Black residents 100.0% MalesUnemployment rate for Asian residents 3.0% FemalesUnemployment rate for other race residents 8.6% FemalesUnemployment rate for two or more race residents 5.0% MalesUnemployment rate for Hispanic or Latino residents 2.4% Males2.0% Females
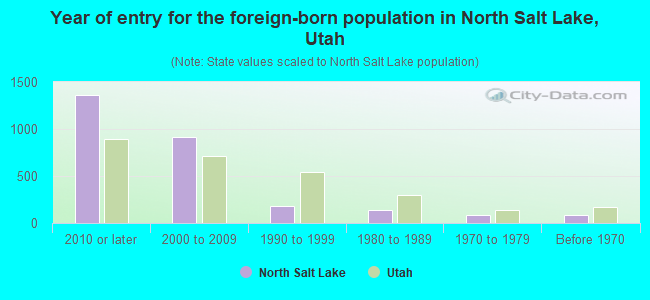
Year of entry for the foreign-born population in North Salt Lake, Utah
1,358 2010 or later 920 2000 to 2009 183 1990 to 1999 139 1980 to 1989 80 1970 to 1979 88 Before 1970
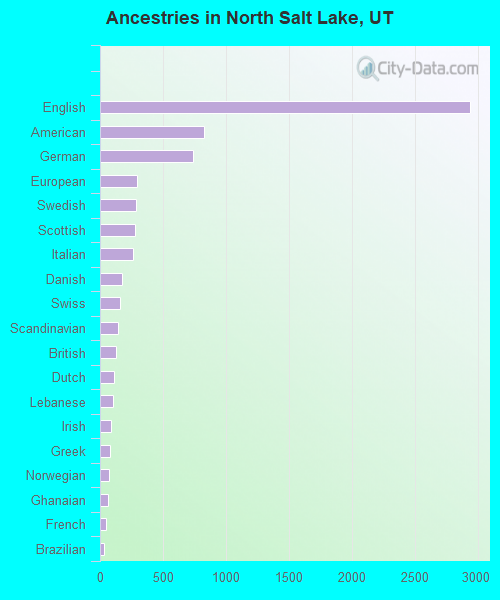
First ancestries reported:
English: 2,944 (28.5%)
American: 830 (8.0%)
German: 739 (7.1%)
European: 295 (2.9%)
Swedish: 288 (2.8%)
Scottish: 281 (2.7%)
Italian: 260 (2.5%)
Danish: 178 (1.7%)
Swiss: 159 (1.5%)
Scandinavian: 142 (1.4%)
British: 130 (1.3%)
Dutch: 113 (1.1%)
Lebanese: 102 (1.0%)
Irish: 85 (0.8%)
Greek: 83 (0.8%)
Norwegian: 75 (0.7%)
Ghanaian: 63 (0.6%)
French: 45 (0.4%)
Brazilian: 34 (0.3%)
Welsh: 22 (0.2%)
Finnish: 14 (0.1%)
Northern European: 13 (0.1%)
Polish: 13 (0.1%)
Ukrainian: 12 (0.1%)
Canadian: 8 (0.08%) Most common places of birth for foreign-born residents (%): Mexico North Salt Lake:
24.7% (765)Utah:
36.1% (99,740)
Pakistan North Salt Lake:
9.3% (288)Utah:
0.8% (2,160)
Micronesia North Salt Lake:
7.7% (239)Utah:
0.3% (917)
Korea North Salt Lake:
5.5% (171)Utah:
1.6% (4,524)
Brazil North Salt Lake:
4.5% (140)Utah:
2.8% (7,644)
Oceania, n.e.c. North Salt Lake:
3.8% (117)Utah:
2.7% (7,472)
El Salvador North Salt Lake:
3.6% (110)Utah:
2.6% (7,062)
United Kingdom, excluding England and Scotland North Salt Lake:
3.4% (105)Utah:
0.7% (1,949)
Marshall Islands North Salt Lake:
3.4% (105)Utah:
0.3% (824)
Canada North Salt Lake:
3.0% (93)Utah:
3.0% (8,341)
India North Salt Lake:
2.4% (75)Utah:
3.0% (8,294)
Lebanon North Salt Lake:
1.9% (60)Utah:
0.1% (203)
Place of birth for U.S.-born residents:
This state: 13,310Other state: 6,036Northeast: 696Midwest: 1,078South: 584West: 3,729 85.5% of North Salt Lake residents lived in the same house 1 years ago.
Out of people who lived in different houses, 29.8% lived in this county.
Out of people who lived in different counties, 65.6% lived in Utah.
North Salt Lake:
85.5%State average:
85.7%
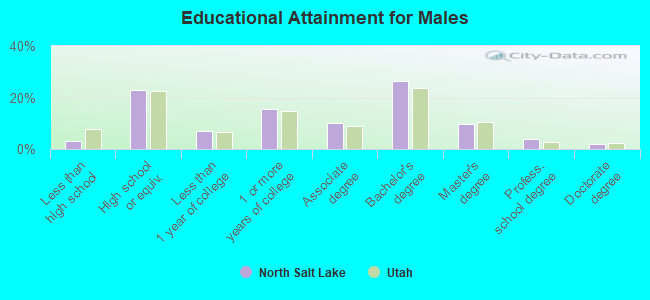
Education attainment for males 25 years and older:
No schooling: 8Nursery to 4th grade: 05th and 6th grade: 617th and 8th grade: 149th grade: 010th grade: 1911th grade: 1512th grade, no diploma: 93High school graduate (or equivalency): 1,527Less than 1 year of college: 456Some college more than 1 year, no degree: 1,040Associate degree: 663Bachelor's degree: 1,770Master's degree: 640Professional school degree: 256Doctorate degree: 130
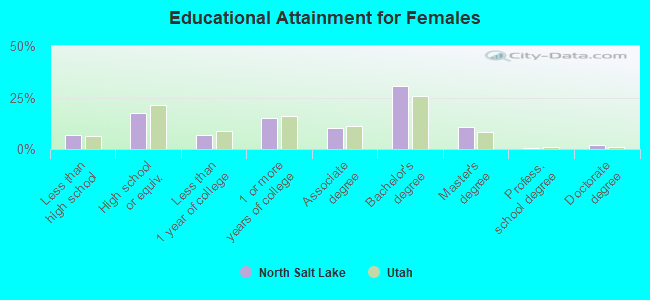
Education attainment for females 25 years and older:
No schooling: 71Nursery to 4th grade: 1725th and 6th grade: 547th and 8th grade: 649th grade: 010th grade: 011th grade: 1912th grade, no diploma: 82High school graduate (or equivalency): 1,214Less than 1 year of college: 472Some college more than 1 year, no degree: 1,058Associate degree: 702Bachelor's degree: 2,162Master's degree: 765Professional school degree: 41Doctorate degree: 153
Housing units in structures:
One, detached: 4,895One, attached: 576Two: 933 or 4: 4125 to 9: 29210 to 19: 69820 to 49: 49050 or more: 337Mobile homes: 344House/condo owner moved in on average 8 years ago
Renter moved in on average 1 years ago
Private vs. public school enrollment:
Students in private schools in grades 1 to 8 (elementary and middle school): 168 Students in private schools in grades 9 to 12 (high school): 0 Students in private undergraduate colleges: 376