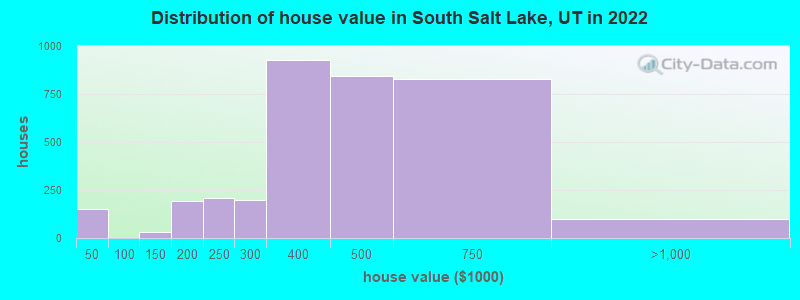
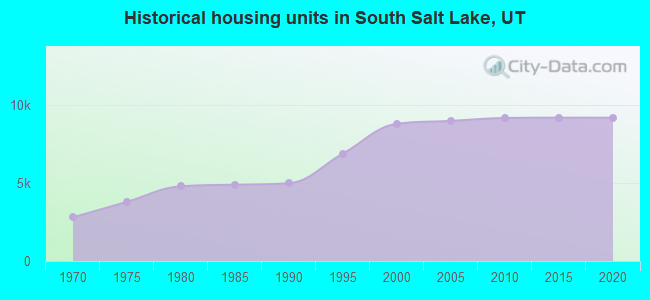
Estimated median house or condo value in 2022: $430,197 (it was $113,000 in 2000)
South Salt Lake:
$430,197
UT:
$499,500
Mean prices in 2022:all housing units: $364,071; detached houses: $394,263; townhouses or other attached units: $389,511; in 2-unit structures: $679,513; in 3-to-4-unit structures: $287,674; in 5-or-more-unit structures: $174,836; mobile homes: $39,815
Median gross rent in 2022: $1,229.
March 2022 cost of living index in South Salt Lake: 95.4 (near average, U.S. average is 100)
Percentage of residents living in poverty in 2022: 14.6%
(13.5% for White Non-Hispanic residents, 8.8% for Black residents, 14.6% for Hispanic or Latino residents, 15.3% for American Indian residents, 9.4% for Native Hawaiian and other Pacific Islander residents, 16.7% for other race residents, 3.3% for two or more races residents)
According to our research of Utah and other state lists, there were 50 registered sex offenders living in South Salt Lake, Utah as of April 27, 2024. The ratio of all residents to sex offenders in South Salt Lake is 504 to 1. The ratio of registered sex offenders to all residents in this city is lower than the state average.
Crime rates in South Salt Lake by year
Type
2009
2010
2011
2012
2013
2014
2015
2016
2017
2018
2019
2020
2021
2022
Murders (per 100,000)
1 (4.7)
5 (21.2)
2 (8.3)
3 (12.3)
2 (8.1)
2 (8.0)
1 (4.0)
3 (12.0)
2 (8.1)
6 (23.8)
1 (3.9)
4 (15.5)
3 (11.8)
0 (0.0)
Rapes (per 100,000)
44 (205.1)
32 (135.5)
35 (145.4)
51 (209.5)
42 (170.8)
47 (188.3)
51 (203.8)
37 (147.9)
44 (177.3)
50 (198.7)
24 (93.8)
39 (151.1)
44 (173.1)
10 (38.4)
Robberies (per 100,000)
55 (256.4)
62 (262.5)
45 (186.9)
30 (123.3)
45 (183.0)
44 (176.3)
46 (183.9)
58 (231.8)
54 (217.6)
57 (226.6)
49 (191.4)
73 (282.8)
54 (212.4)
11 (42.3)
Assaults (per 100,000)
98 (456.9)
112 (474.2)
91 (378.0)
124 (509.4)
117 (475.7)
119 (476.7)
129 (515.6)
106 (423.6)
135 (544.1)
129 (512.7)
131 (511.7)
134 (519.1)
160 (629.4)
38 (146.0)
Burglaries (per 100,000)
295 (1,375)
239 (1,012)
264 (1,097)
241 (990.1)
216 (878.2)
226 (905.4)
228 (911.3)
323 (1,291)
355 (1,431)
237 (942.0)
256 (1,000)
234 (906.4)
146 (574.3)
34 (130.7)
Thefts (per 100,000)
1,247 (5,814)
1,176 (4,979)
1,059 (4,399)
1,129 (4,638)
1,145 (4,655)
1,176 (4,711)
1,244 (4,972)
1,268 (5,068)
1,226 (4,941)
1,246 (4,952)
1,264 (4,938)
1,679 (6,504)
1,359 (5,346)
281 (1,080)
Auto thefts (per 100,000)
271 (1,264)
247 (1,046)
258 (1,072)
207 (850.5)
320 (1,301)
278 (1,114)
337 (1,347)
372 (1,487)
397 (1,600)
313 (1,244)
350 (1,367)
462 (1,790)
431 (1,695)
74 (284.4)
Arson (per 100,000)
7 (32.6)
4 (16.9)
1 (4.2)
2 (8.2)
5 (20.3)
2 (8.0)
4 (16.0)
4 (16.0)
6 (24.2)
2 (7.9)
4 (15.6)
12 (46.5)
3 (11.8)
2 (7.7)
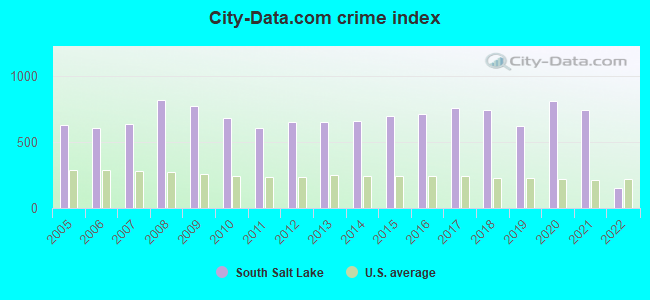
City-Data.com crime index
771.7
678.0
603.1
654.0
654.7
655.8
699.8
708.5
757.9
740.7
619.5
807.3
741.3
147.7
The City-Data.com crime index weighs serious crimes and violent crimes more heavily. Higher means more crime, U.S. average is 246.1. It adjusts for the number of visitors and daily workers commuting into cities.
Latest news from South Salt Lake, UT collected exclusively by city-data.com from local newspapers, TV, and radio stations
Ancestries: English (6.0%), Irish (4.4%), American (3.3%), German (3.2%), Italian (2.6%), European (2.1%).
Current Local Time: MST time zone
Elevation: 4263 feet
Land area: 6.91 square miles.
Population density: 3,765 people per square mile (average).
6,234 residents are foreign born (13.2% Latin America, 6.4% Asia).
This city:
23.6%
Utah:
8.4%
Median real estate property taxes paid for housing units with mortgages in 2022: $1,995 (0.5%) Median real estate property taxes paid for housing units with no mortgage in 2022: $2,097 (0.5%)
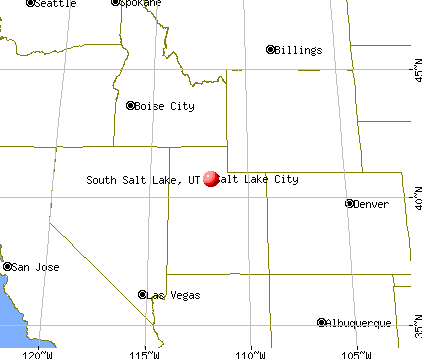
Nearest city with pop. 50,000+: Salt Lake City, UT (3.2 miles , pop. 181,743).
Nearest city with pop. 200,000+: Las Vegas, NV (360.6 miles , pop. 478,434).
Nearest city with pop. 1,000,000+: Phoenix, AZ (496.7 miles , pop. 1,321,045).
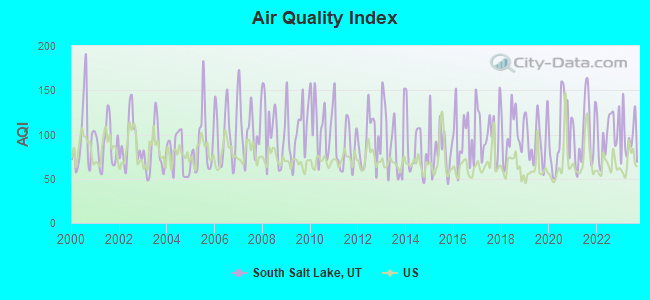
Air Quality Index (AQI) level in 2023 was 95.8. This is worse than average.
City:
95.8
U.S.:
72.6
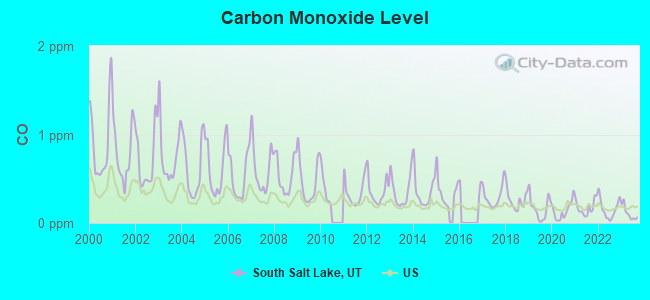
Carbon Monoxide (CO) [ppm] level in 2023 was 0.111. This is significantly better than average.Closest monitor was 2.2 miles away from the city center.
City:
0.111
U.S.:
0.251
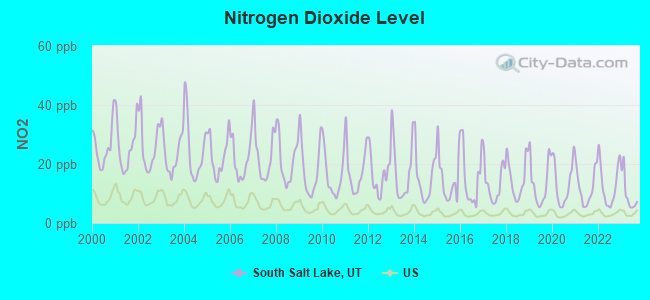
Nitrogen Dioxide (NO2) [ppb] level in 2023 was 9.74. This is significantly worse than average.Closest monitor was 2.2 miles away from the city center.
City:
9.74
U.S.:
5.11
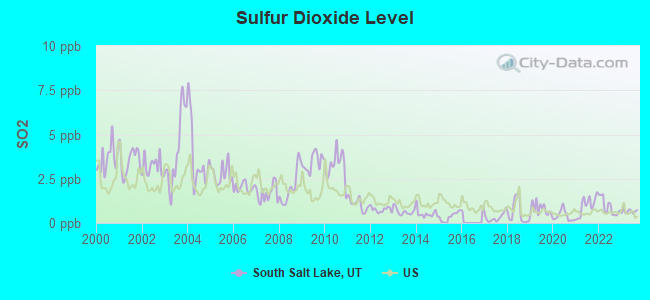
Sulfur Dioxide (SO2) [ppb] level in 2023 was 0.664. This is significantly better than average.Closest monitor was 2.2 miles away from the city center.
City:
0.664
U.S.:
1.515
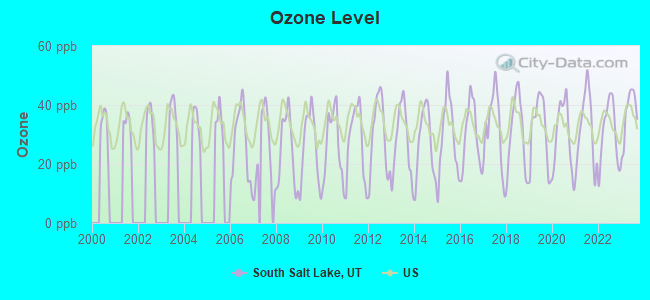
Ozone [ppb] level in 2023 was 37.2. This is about average.Closest monitor was 2.2 miles away from the city center.
City:
37.2
U.S.:
33.3
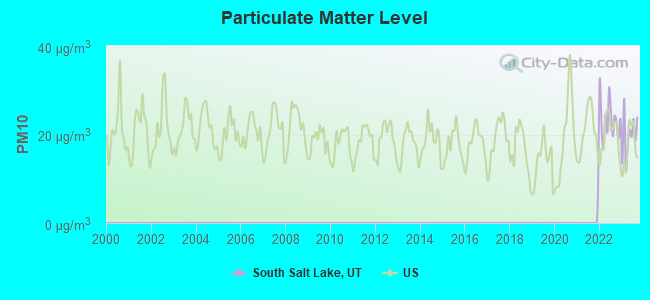
Particulate Matter (PM10) [µg/m3] level in 2023 was 19.7. This is about average.Closest monitor was 2.2 miles away from the city center.
City:
19.7
U.S.:
19.2
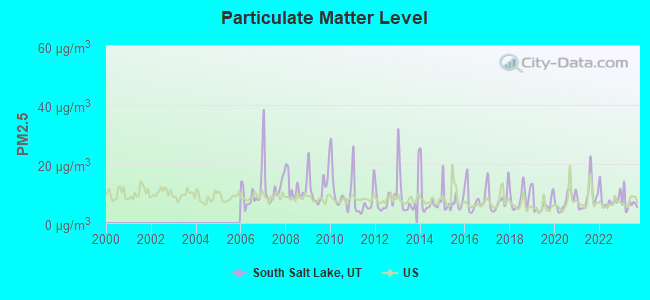
Particulate Matter (PM2.5) [µg/m3] level in 2023 was 6.79. This is about average.Closest monitor was 2.2 miles away from the city center.
City:
6.79
U.S.:
8.11
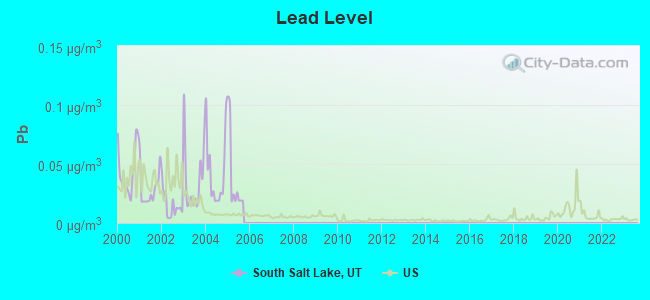
Lead (Pb) [µg/m3] level in 2005 was 0.0394. This is significantly worse than average.Closest monitor was 3.3 miles away from the city center.
City:
0.0394
U.S.:
0.0093
Earthquake activity:
South Salt Lake-area historical earthquake activity is significantly above Utah state average. It is 2180% greater than the overall U.S. average.
On 8/18/1959 at 06:37:13, a magnitude 7.7 (7.7 UK, Class: Major, Intensity: VIII - XII) earthquake occurred 274.1 miles away from South Salt Lake center, causing $26,000,000 total damage On 10/3/1915 at 06:52:48, a magnitude 7.6 (7.6 UK) earthquake occurred 295.0 miles away from South Salt Lake center On 10/28/1983 at 14:06:06, a magnitude 7.3 (6.2 MB, 7.3 MS, 7.0 MW) earthquake occurred 252.7 miles away from the city center, causing 2 deaths (2 shaking deaths) and 3 injuries, causing $15,000,000 total damage On 3/28/1975 at 02:31:05, a magnitude 6.2 (6.1 MB, 6.0 MS, 6.2 ML, Class: Strong, Intensity: VII - IX) earthquake occurred 95.2 miles away from South Salt Lake center On 3/18/2020 at 13:09:31, a magnitude 5.7 (5.7 MW, Depth: 7.4 mi, Class: Moderate, Intensity: VI - VII) earthquake occurred 10.4 miles away from South Salt Lake center On 12/21/1932 at 06:10:09, a magnitude 7.2 (7.2 UK) earthquake occurred 363.3 miles away from South Salt Lake center Magnitude types: body-wave magnitude (MB), local magnitude (ML), surface-wave magnitude (MS), moment magnitude (MW)
Natural disasters:
The number of natural disasters in Salt Lake County (9) is smaller than the US average (15). Major Disasters (Presidential) Declared: 4 Emergencies Declared: 1
Causes of natural disasters: Floods: 3, Storms: 3, Fires: 2, Landslides: 2, Earthquake: 1, Hurricane: 1, Mudslide: 1, Tornado: 1, Other: 1 (Note: some incidents may be assigned to more than one category).
Hospitals and medical centers in South Salt Lake:
PARACELSUS REGIONAL HOSP AND MEDICAL CNT (2500 SOUTH STATE STREET)
Other hospitals and medical centers near South Salt Lake:
UNIVERSITY HOME CARE (Home Health Center, about 1 miles away; SALT LAKE CITY, UT)
A AND E NH (Nursing Home, about 1 miles away; SALT LAKE CITY, UT)
TRINITY CARE CENTER (Nursing Home, about 1 miles away; SALT LAKE CITY, UT)
PARACELSUS HOSPITAL HOME CARE (Home Health Center, about 1 miles away; SALT LAKE CITY, UT)
ROCKY MOUNTAIN MEDICAL CENTER (Hospital, about 1 miles away; SALT LAKE CITY, UT)
MAJESTIC CARE AND REHABILITATION CENTER (Nursing Home, about 1 miles away; SALT LAKE CITY, UT)
AVALON VALLEY REHABILITATION CENTER (Nursing Home, about 1 miles away; SALT LAKE CITY, UT)
Amtrak station near South Salt Lake:
4 miles: SALT LAKE CITY (320 S. RIO GRANDE ST.) . Services: ticket office, fully wheelchair accessible, enclosed waiting area, public restrooms, public payphones, vending machines, free short-term parking, free long-term parking, call for car rental service, taxi stand.
Colleges/universities with over 2000 students nearest to South Salt Lake:
Western Governors University (about 2 miles; Salt Lake City, UT; Full-time enrollment: 31,481)
Westminster College (about 3 miles; Salt Lake City, UT; FT enrollment: 2,870)
Stevens-Henager College-Murray (about 4 miles; Murray, UT; FT enrollment: 6,395)
Salt Lake Community College (about 4 miles; Salt Lake City, UT; FT enrollment: 20,797)
University of Utah (about 5 miles; Salt Lake City, UT; FT enrollment: 28,454)
Latter-day Saints Business College (about 5 miles; Salt Lake City, UT; FT enrollment: 2,059)
Utah Valley University (about 32 miles; Orem, UT; FT enrollment: 24,403)
Public high school in South Salt Lake:
UTAH INTERNATIONAL CHARTER SCHOOL (Location: 350 E BAIRD CIRCLE (3605 SOUTH, Grades: 7-12, Charter school)
User-submitted facts and corrections:
There are two other spanish language stations serving these communities, KUTH 12 and KUTF 3. They are Equity Broadcasting Stations. The main number is 801-519-9784. Address is 525 South 300 west, Ste. 1 Salt Lake City.
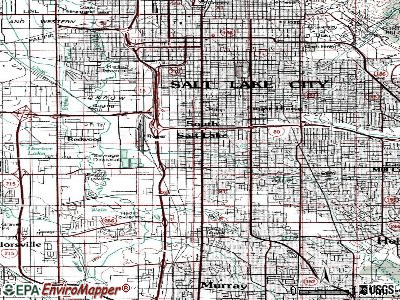
Notable locations in South Salt Lake: Fairclough Industrial Park (A), City of South Salt Lake Fire Department Station 41 (B), City of South Salt Lake Fire Department Station 42 (C), City of South Salt Lake Fire Department Station 43 (D), We R Kids (E). Display/hide their locations on the map
Churches in South Salt Lake include: Full Armor Bible Center (A), Jehovahs Witnesses Granite Park Congregation (B), The Potters House Christian Fellowship Church (C), Potters House Christian Fellowship Church (D), Church of the Living Dead (E), The Church of Jesus Christ of Latter Day Saints (F), New Life Christian Center (G), Saint Anns Catholic Church (H), Salt Lake City Church of God (I). Display/hide their locations on the map
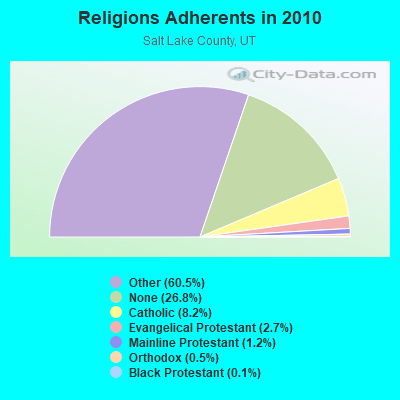
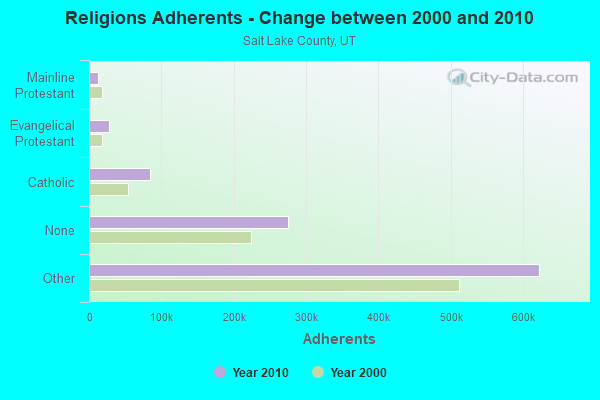
Religion statistics for South Salt Lake, UT (based on Salt Lake County data)
Religion
Adherents
Congregations
Other
622,807
1,452
Catholic
84,342
24
Evangelical Protestant
27,497
144
Mainline Protestant
12,789
38
Orthodox
5,352
7
Black Protestant
1,302
6
None
275,566
-
Source: Clifford Grammich, Kirk Hadaway, Richard Houseal, Dale E.Jones, Alexei Krindatch, Richie Stanley and Richard H.Taylor. 2012. 2010 U.S.Religion Census: Religious Congregations & Membership Study. Association of Statisticians of American Religious Bodies. Jones, Dale E., et al. 2002. Congregations and Membership in the United States 2000. Nashville, TN: Glenmary Research Center. Graphs represent county-level data
220 E Morris Ave (Lat: 40.717444 Lon: -111.884944), Type: Building, Structure height: 18 m, Overall height: 21 m, Call Sign: KBP639, Assigned Frequencies: 453.800 MHz, Grant Date: 08/12/1996, Expiration Date: 08/12/2001, Cancellation Date: 10/14/2001, Certifier: Steve F Foote, Registrant: Cara Enterprises, 1383 Farm Meadow, Salt Lake City, UT 84117-8063, Fax: (801) 278-7239
Lat: 40.703861 Lon: -111.914611, Structure height: 0 m, Call Sign: WPXJ340, Assigned Frequencies: 451.025 MHz, Grant Date: 04/15/2003, Expiration Date: 04/15/2013, Cancellation Date: 06/15/2013, Certifier: Andrew Larsen, Registrant: Cara Enterprises Inc., Salt Lake City, UT 84117-0503, Phone: (801) 278-9728, Fax: (801) 278-7239, Email:
Lat: 40.717833 Lon: -111.882250, Call Sign: WPZT945, Assigned Frequencies: 464.387 MHz, 469.387 MHz, Grant Date: 03/12/2004, Expiration Date: 03/12/2014, Cancellation Date: 05/17/2014, Certifier: Craig Ulibarri, Registrant: Cara Enterprises Inc, Salt Lake City, UT 84117-0503, Phone: (801) 278-9728, Fax: (801) 278-7239
Lat: 40.701111 Lon: -111.924444, Call Sign: WQDT778, Licensee ID: L01071770, Assigned Frequencies: 452.287 MHz, 452.987 MHz, Grant Date: 10/28/2005, Expiration Date: 10/28/2015, Cancellation Date: 01/02/2016, Certifier: James Bailey, Registrant: Cottonwood Youth Academy, 1144 W 3300 S, South Salt Lake City, UT 84119, Phone: (801) 433-2900, Fax: (801) 433-2999
2357 South 900 West (Lat: 40.719389 Lon: -111.917306), Call Sign: WREC860, Assigned Frequencies: 451.237 MHz, 452.987 MHz, 456.237 MHz, 452.837 MHz, 457.837 MHz, Grant Date: 09/20/2019, Expiration Date: 09/20/2029, Certifier: James R Stanley, Registrant: Utah Comm, 1202 South 300 West, Salt Lake City, UT 84101, Phone: (801) 486-0161, Email:
3459 S 700 W (Lat: 40.696222 Lon: -111.910889), Call Sign: WRUZ463, Assigned Frequencies: 451.512 MHz, 456.512 MHz, 452.787 MHz, 457.787 MHz, 452.487 MHz, Grant Date: 10/21/2022, Expiration Date: 10/21/2032, Certifier: Melissa E Shell, Registrant: Utah Communications Inc, 1202 S 300 W, Salt Lake City, UT 84101, Phone: (801) 486-0161, Email:
Aircraft: PIPER PA 46-350P (Category: Land, Seats: 6, Weight: Up to 12,499 Pounds), Engine: LYCOMING TIO 540 SER (250 HP) (Reciprocating) N-Number: 555JV, N555JV, N-555JV, Serial Number: 4636270, Year manufactured: 2000, Airworthiness Date: 03/21/2000, Certificate Issue Date: 03/30/2019 Registrant (LLC): Sky Kings 3 LLC, 825 W 2400 S, South Salt Lake, UT 84119
Aircraft: BALONY KUBICEK SPOL SRO BB60Z (Category: Land, Seats: 13, Weight: Up to 12,499 Pounds), Engine: None N-Number: 783AT, N783AT, N-783AT, Serial Number: 946, Year manufactured: 2012, Airworthiness Date: 09/11/2012, Certificate Issue Date: 09/11/2012 Registrant (LLC): Utah Outventures LLC, 3626 S Wendell Dr, South Salt Lake, UT 84115
Home Mortgage Disclosure Act Aggregated Statistics For Year 2009 (Based on 3 full and 1 partial tracts)
A) FHA, FSA/RHS & VA Home Purchase Loans
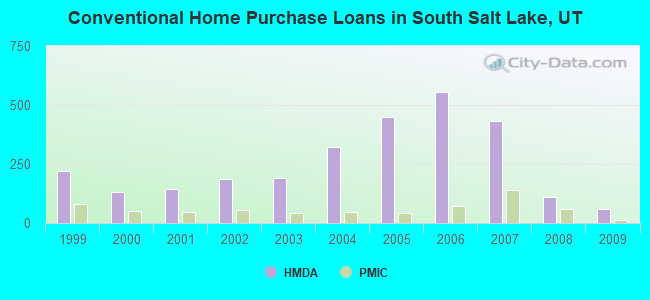
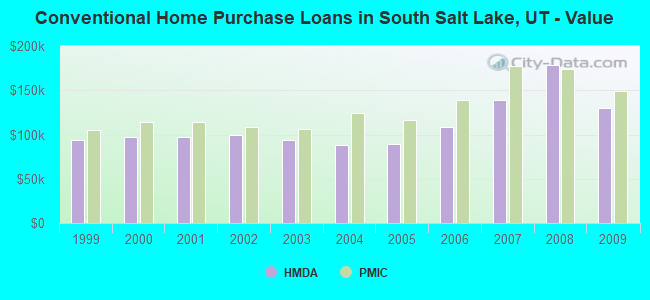
B) Conventional Home Purchase Loans
C) Refinancings
D) Home Improvement Loans
E) Loans on Dwellings For 5+ Families
F) Non-occupant Loans on < 5 Family Dwellings (A B C & D)
G) Loans On Manufactured Home Dwelling (A B C & D)
Number
Average Value
Number
Average Value
Number
Average Value
Number
Average Value
Number
Average Value
Number
Average Value
Number
Average Value
LOANS ORIGINATED
147
$167,222
59
$129,488
385
$154,211
13
$75,329
3
$2,032,947
36
$132,182
2
$129,825
APPLICATIONS APPROVED, NOT ACCEPTED
12
$158,837
3
$176,850
53
$165,502
2
$115,500
0
$0
6
$154,005
0
$0
APPLICATIONS DENIED
22
$167,317
17
$119,336
151
$153,621
12
$39,302
1
$249,280
27
$142,831
4
$49,855
APPLICATIONS WITHDRAWN
10
$190,614
7
$175,470
88
$149,614
5
$79,260
0
$0
6
$153,658
0
$0
FILES CLOSED FOR INCOMPLETENESS
4
$214,465
2
$77,885
18
$172,316
4
$77,088
0
$0
1
$58,830
0
$0
Aggregated Statistics For Year 2008 (Based on 3 full and 1 partial tracts)
A) FHA, FSA/RHS & VA Home Purchase Loans
B) Conventional Home Purchase Loans
C) Refinancings
D) Home Improvement Loans
E) Loans on Dwellings For 5+ Families
F) Non-occupant Loans on < 5 Family Dwellings (A B C & D)
G) Loans On Manufactured Home Dwelling (A B C & D)
Number
Average Value
Number
Average Value
Number
Average Value
Number
Average Value
Number
Average Value
Number
Average Value
Number
Average Value
LOANS ORIGINATED
123
$183,153
109
$178,391
267
$154,767
20
$90,530
8
$2,785,034
55
$199,935
1
$136,000
APPLICATIONS APPROVED, NOT ACCEPTED
6
$159,308
17
$192,321
56
$167,464
2
$22,500
0
$0
9
$214,647
1
$182,470
APPLICATIONS DENIED
22
$174,422
42
$151,513
188
$144,650
38
$84,969
2
$363,445
32
$149,039
4
$58,210
APPLICATIONS WITHDRAWN
23
$174,544
18
$136,914
78
$150,429
7
$124,481
0
$0
13
$120,650
2
$78,985
FILES CLOSED FOR INCOMPLETENESS
4
$227,345
4
$203,482
9
$164,542
4
$116,798
0
$0
6
$200,850
0
$0
Aggregated Statistics For Year 2007 (Based on 3 full and 1 partial tracts)
A) FHA, FSA/RHS & VA Home Purchase Loans
B) Conventional Home Purchase Loans
C) Refinancings
D) Home Improvement Loans
E) Loans on Dwellings For 5+ Families
F) Non-occupant Loans on < 5 Family Dwellings (A B C & D)
G) Loans On Manufactured Home Dwelling (A B C & D)
Number
Average Value
Number
Average Value
Number
Average Value
Number
Average Value
Number
Average Value
Number
Average Value
Number
Average Value
LOANS ORIGINATED
58
$157,121
432
$138,971
345
$130,415
36
$85,821
15
$2,342,643
143
$139,786
5
$73,800
APPLICATIONS APPROVED, NOT ACCEPTED
2
$200,760
65
$128,396
63
$136,560
8
$101,599
1
$30,000
32
$145,735
1
$17,680
APPLICATIONS DENIED
6
$161,477
134
$140,095
186
$142,066
42
$98,855
2
$251,305
63
$165,218
7
$67,183
APPLICATIONS WITHDRAWN
7
$201,787
26
$130,978
81
$139,004
14
$119,820
0
$0
25
$168,074
0
$0
FILES CLOSED FOR INCOMPLETENESS
0
$0
8
$149,464
25
$120,014
1
$40,000
0
$0
2
$97,575
0
$0
Aggregated Statistics For Year 2006 (Based on 3 full and 1 partial tracts)
A) FHA, FSA/RHS & VA Home Purchase Loans
B) Conventional Home Purchase Loans
C) Refinancings
D) Home Improvement Loans
E) Loans on Dwellings For 5+ Families
F) Non-occupant Loans on < 5 Family Dwellings (A B C & D)
G) Loans On Manufactured Home Dwelling (A B C & D)
Number
Average Value
Number
Average Value
Number
Average Value
Number
Average Value
Number
Average Value
Number
Average Value
Number
Average Value
LOANS ORIGINATED
51
$139,010
553
$108,358
375
$100,289
25
$54,049
4
$1,590,825
233
$104,954
2
$59,465
APPLICATIONS APPROVED, NOT ACCEPTED
1
$138,000
90
$107,392
58
$101,230
9
$37,290
0
$0
33
$122,622
1
$99,000
APPLICATIONS DENIED
8
$125,536
186
$101,367
168
$108,635
50
$56,808
2
$54,500
71
$97,750
5
$113,820
APPLICATIONS WITHDRAWN
5
$127,728
77
$102,366
85
$108,712
13
$60,424
1
$1,287,010
31
$97,279
1
$108,000
FILES CLOSED FOR INCOMPLETENESS
1
$96,000
19
$102,890
33
$139,536
0
$0
1
$10,000
2
$120,235
0
$0
Aggregated Statistics For Year 2005 (Based on 3 full and 1 partial tracts)
A) FHA, FSA/RHS & VA Home Purchase Loans
B) Conventional Home Purchase Loans
C) Refinancings
D) Home Improvement Loans
E) Loans on Dwellings For 5+ Families
F) Non-occupant Loans on < 5 Family Dwellings (A B C & D)
G) Loans On Manufactured Home Dwelling (A B C & D)
Number
Average Value
Number
Average Value
Number
Average Value
Number
Average Value
Number
Average Value
Number
Average Value
Number
Average Value
LOANS ORIGINATED
67
$125,277
448
$89,499
266
$104,619
28
$64,091
10
$1,320,667
165
$110,451
2
$72,790
APPLICATIONS APPROVED, NOT ACCEPTED
4
$99,720
77
$89,560
51
$84,730
10
$50,663
0
$0
27
$102,114
1
$20,000
APPLICATIONS DENIED
12
$110,787
154
$82,869
177
$110,108
45
$49,602
0
$0
71
$102,468
7
$70,053
APPLICATIONS WITHDRAWN
5
$131,032
157
$109,295
103
$120,970
20
$104,286
1
$416,000
42
$106,517
0
$0
FILES CLOSED FOR INCOMPLETENESS
0
$0
23
$101,925
40
$108,468
0
$0
0
$0
7
$126,957
0
$0
Aggregated Statistics For Year 2004 (Based on 3 full and 1 partial tracts)
A) FHA, FSA/RHS & VA Home Purchase Loans
B) Conventional Home Purchase Loans
C) Refinancings
D) Home Improvement Loans
E) Loans on Dwellings For 5+ Families
F) Non-occupant Loans on < 5 Family Dwellings (A B C & D)
G) Loans On Manufactured Home Dwelling (A B C & D)
Number
Average Value
Number
Average Value
Number
Average Value
Number
Average Value
Number
Average Value
Number
Average Value
Number
Average Value
LOANS ORIGINATED
84
$108,157
322
$88,617
321
$105,283
20
$54,100
6
$619,483
139
$94,650
2
$71,045
APPLICATIONS APPROVED, NOT ACCEPTED
6
$116,272
90
$91,359
83
$103,457
3
$55,203
0
$0
22
$102,264
2
$55,000
APPLICATIONS DENIED
17
$121,965
115
$81,262
216
$104,923
36
$24,082
0
$0
39
$82,811
8
$37,979
APPLICATIONS WITHDRAWN
11
$115,924
54
$81,195
128
$113,769
9
$44,308
2
$646,620
23
$101,331
0
$0
FILES CLOSED FOR INCOMPLETENESS
5
$100,902
12
$101,037
47
$120,271
0
$0
0
$0
6
$131,527
0
$0
Aggregated Statistics For Year 2003 (Based on 3 full and 1 partial tracts)
A) FHA, FSA/RHS & VA Home Purchase Loans
B) Conventional Home Purchase Loans
C) Refinancings
D) Home Improvement Loans
E) Loans on Dwellings For 5+ Families
F) Non-occupant Loans on < 5 Family Dwellings (A B C & D)
Number
Average Value
Number
Average Value
Number
Average Value
Number
Average Value
Number
Average Value
Number
Average Value
LOANS ORIGINATED
96
$112,177
192
$93,793
823
$100,876
24
$37,002
5
$2,401,762
133
$93,978
APPLICATIONS APPROVED, NOT ACCEPTED
4
$146,680
35
$96,059
106
$98,466
5
$36,894
0
$0
25
$98,335
APPLICATIONS DENIED
13
$128,164
63
$82,757
255
$97,169
18
$30,673
2
$931,790
54
$96,181
APPLICATIONS WITHDRAWN
10
$128,387
46
$100,807
143
$113,028
4
$18,085
0
$0
25
$110,617
FILES CLOSED FOR INCOMPLETENESS
1
$93,730
9
$128,784
26
$109,615
0
$0
0
$0
4
$105,902
Aggregated Statistics For Year 2002 (Based on 3 full and 1 partial tracts)
A) FHA, FSA/RHS & VA Home Purchase Loans
B) Conventional Home Purchase Loans
C) Refinancings
D) Home Improvement Loans
E) Loans on Dwellings For 5+ Families
F) Non-occupant Loans on < 5 Family Dwellings (A B C & D)
Number
Average Value
Number
Average Value
Number
Average Value
Number
Average Value
Number
Average Value
Number
Average Value
LOANS ORIGINATED
114
$117,355
185
$99,694
597
$106,004
16
$7,814
9
$1,389,664
121
$112,303
APPLICATIONS APPROVED, NOT ACCEPTED
6
$122,782
27
$104,641
77
$100,563
7
$17,529
0
$0
13
$91,867
APPLICATIONS DENIED
44
$112,798
73
$88,933
225
$97,970
31
$17,921
0
$0
44
$92,968
APPLICATIONS WITHDRAWN
15
$126,629
22
$106,462
136
$98,791
8
$16,558
0
$0
21
$116,568
FILES CLOSED FOR INCOMPLETENESS
5
$148,826
11
$94,372
43
$99,755
1
$5,980
0
$0
16
$85,724
Aggregated Statistics For Year 2001 (Based on 3 full and 1 partial tracts)
A) FHA, FSA/RHS & VA Home Purchase Loans
B) Conventional Home Purchase Loans
C) Refinancings
D) Home Improvement Loans
E) Loans on Dwellings For 5+ Families
F) Non-occupant Loans on < 5 Family Dwellings (A B C & D)
Number
Average Value
Number
Average Value
Number
Average Value
Number
Average Value
Number
Average Value
Number
Average Value
LOANS ORIGINATED
141
$116,454
144
$97,095
499
$97,330
33
$26,762
2
$404,520
89
$97,682
APPLICATIONS APPROVED, NOT ACCEPTED
9
$110,068
28
$92,494
60
$88,755
3
$21,270
0
$0
10
$114,887
APPLICATIONS DENIED
22
$112,420
76
$75,512
212
$84,728
39
$23,033
0
$0
50
$84,798
APPLICATIONS WITHDRAWN
19
$116,313
25
$117,775
137
$104,461
10
$23,042
0
$0
7
$127,793
FILES CLOSED FOR INCOMPLETENESS
1
$103,000
3
$69,943
41
$96,648
0
$0
0
$0
7
$70,976
Aggregated Statistics For Year 2000 (Based on 3 full and 1 partial tracts)
A) FHA, FSA/RHS & VA Home Purchase Loans
B) Conventional Home Purchase Loans
C) Refinancings
D) Home Improvement Loans
E) Loans on Dwellings For 5+ Families
F) Non-occupant Loans on < 5 Family Dwellings (A B C & D)
Number
Average Value
Number
Average Value
Number
Average Value
Number
Average Value
Number
Average Value
Number
Average Value
LOANS ORIGINATED
140
$109,447
133
$97,007
178
$88,599
43
$27,867
2
$457,920
53
$101,151
APPLICATIONS APPROVED, NOT ACCEPTED
9
$85,446
49
$80,918
38
$87,595
13
$36,170
0
$0
13
$78,128
APPLICATIONS DENIED
19
$93,066
97
$80,841
149
$73,742
28
$20,441
0
$0
41
$90,042
APPLICATIONS WITHDRAWN
13
$100,347
45
$96,419
78
$85,040
4
$49,802
0
$0
18
$93,916
FILES CLOSED FOR INCOMPLETENESS
6
$101,818
3
$93,223
41
$108,296
1
$49,850
0
$0
1
$60,000
Aggregated Statistics For Year 1999 (Based on 2 full and 2 partial tracts)
A) FHA, FSA/RHS & VA Home Purchase Loans
B) Conventional Home Purchase Loans
C) Refinancings
D) Home Improvement Loans
E) Loans on Dwellings For 5+ Families
F) Non-occupant Loans on < 5 Family Dwellings (A B C & D)
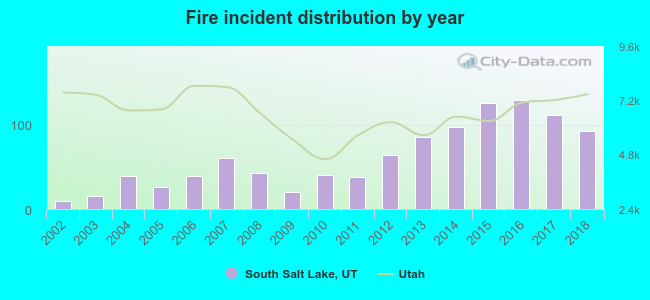
2002 - 2018 National Fire Incident Reporting System (NFIRS) incidents
According to the data from the years 2002 - 2018 the average number of fires per year is 61. The highest number of fire incidents - 129 took place in 2016, and the least - 10 in 2002. The data has a rising trend.
When looking into fire subcategories, the most incidents belonged to: Structure Fires (44.0%), and Outside Fires (34.4%).
Fire incident types reported to NFIRS in South Salt Lake, UT
#8 on the list of "Top 101 cities with the most residents born in Other South Central Asia (population 500+)"
#9 on the list of "Top 101 cities with the highest number of rapes per 100,000 residents, excludes tourist destinations and others with a lot of outsiders visiting based on city industries data (population 5,000+)"
#47 on the list of "Top 101 cities with the largest percentage of people in local jails and other confinement facilities (including police lockups) (population 1,000+)"
#62 on the list of "Top 101 cities with the largest percentage of people in short-term care, detention or diagnostic centers for delinquent children (population 1,000+)"
#73 on the list of "Top 101 cities with the highest number of auto thefts per 100,000 residents, excludes tourist destinations and others with a lot of outsiders visiting based on city industries data (population 5,000+)"
#89 (84115) on the list of "Top 101 zip codes with the largest percentage of Danish first ancestries (pop 5,000+)"
#1 on the list of "Top 101 counties with the most Other adherents"
#1 on the list of "Top 101 counties with the most Other congregations"
#4 on the list of "Top 101 counties with the lowest percentage of residents that smoked 100+ cigarettes in their lives"
#11 on the list of "Top 101 counties with the highest Nitrogen Dioxide air pollution readings in 2012 (ppm)"
#14 on the list of "Top 101 counties with the highest number of births per 1000 residents 2007-2013"


 Recent articles from our blog. Our writers, many of them Ph.D. graduates or candidates, create easy-to-read articles on a wide variety of topics.

 (3.2 miles


 According to the data from the years 2002 - 2018 the average number of fires per year is 61. The highest number of fire incidents - 129 took place in 2016, and the least - 10 in 2002. The data has a rising trend.
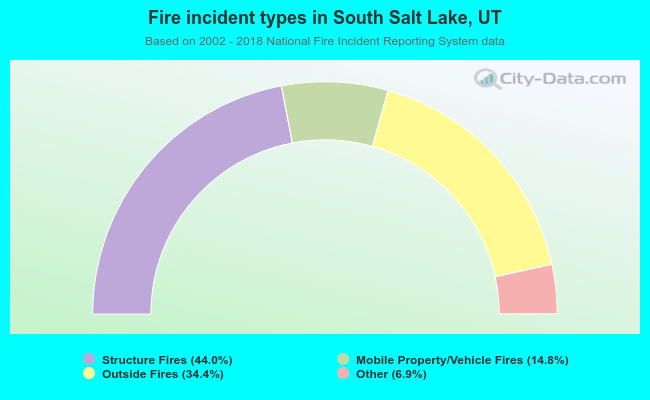 When looking into fire subcategories, the most incidents belonged to: Structure Fires (44.0%), and Outside Fires (34.4%).