South Salt Lake, UT (Utah) Houses and Residents
Estimated median house or condo value in 2022: $430,197 (it was $113,000 in 2000 )
South Salt Lake:
$430,197Utah:
$499,500
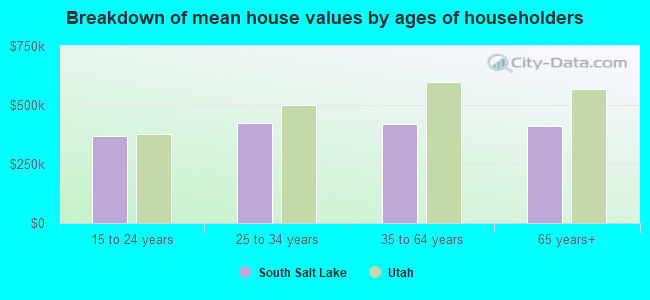
Lower value quartile - upper value quartile: $328,042 - $522,688Mean price in 2022: Detached houses: $394,263 Here:
$394,263State:
$607,750
Townhouses or other attached units: $389,511 Here:
$389,511State:
$444,505
In 2-unit structures: $679,513 Here:
$679,513State:
$433,540
In 3-to-4-unit structures: $287,674 Here:
$287,674State:
$362,850
In 5-or-more-unit structures: $174,836 Here:
$174,836State:
$412,810
Mobile homes: $39,815 Here:
$39,815State:
$113,475
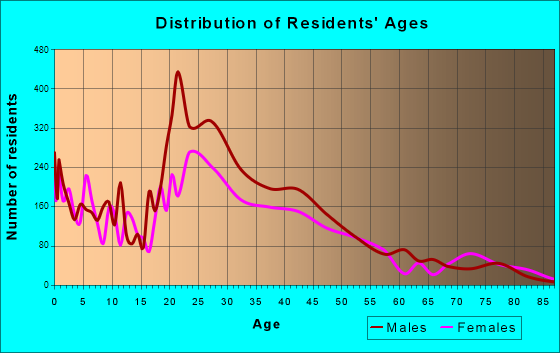
Total population: 24,748 (Urban population: 22,153, Rural population: 0)
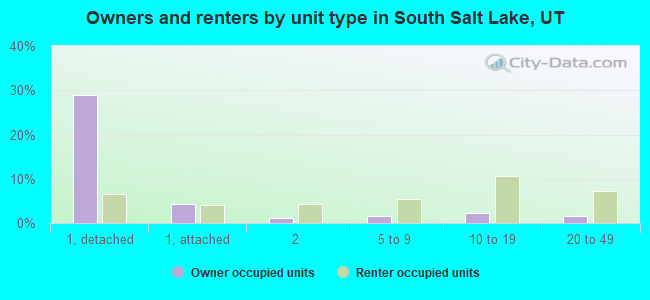
Houses: 12,145 (11,100 occupied: 4,330 owner occupied, 6,701 renter occupied )
% of renters here:
61%State:
29%
Housing density: 1,758 houses/condos per square mile
Median price asked for vacant for-sale houses and condos in 2022: $608,671.
Median contract rent in 2022: $1,129 (lower quartile is $855, upper quartile is $1,474)
Median rent asked for vacant for-rent units in 2022: $1,728
Median gross rent in South Salt Lake, UT in 2022: $1,229
Housing units in South Salt Lake with a mortgage: 3,281 (233 second mortgage, 0 home equity loan, 213 both second mortgage and home equity loan )Houses without a mortgage: 53
Median household income for houses/condos with a mortgage: $90,518
Median household income for apartments without a mortgage: $67,451
Median monthly housing costs: $1,265
Data:
Median house or condo value ($)
Median house or condo value ($ change since 2000)
Median house or condo value ($) - White
Median house or condo value ($) - Black or African American
Median house or condo value ($) - Asian
Median house or condo value ($) - Hispanic or Latino
Median house or condo value ($) - American Indian and Alaska Native
Median house or condo value ($) - Multirace
Median house or condo value ($) - Other Race
Median price asked for mobile homes ($)
Household density (households per square mile)
Mean house or condo value by units in structure - 1, detached ($)
Mean house or condo value by units in structure - 1, attached ($)
Mean house or condo value by units in structure - 2 ($)
Mean house or condo value by units in structure by units in structure - 3 or 4 ($)
Mean house or condo value by units in structure - 5 or more ($)
Mean house or condo value by units in structure - Boat, RV, van, etc. ($)
Mean house or condo value by units in structure - Mobile home ($)
Median contract rent ($)
Median contract rent - Lower quartile ($)
Median contract rent - Upper quartile ($)
Median gross rent ($)
Urban houses (%)
Rural houses (%)
Houses occupied (%)
Houses occupied (% change since 2000)
Houses owner occupied (%)
Houses owner occupied (% change since 2000)
Houses renter occupied (%)
Houses renter occupied (% change since 2000)
Vacant housing units - For rent (%)
Vacant housing units - For rent (% change since 2000)
Vacant housing units - For sale only (%)
Vacant housing units - For sale only (% change since 2000)
Vacant housing units - Rented or sold, not occupied (%)
Vacant housing units - Rented or sold, not occupied (% change since 2000)
Vacant housing units - For seasonal, recreational, or occasional use (%)
Vacant housing units - For seasonal, recreational, or occasional use (% change since 2000)
Vacant housing units - For migrant workers (%)
Vacant housing units - For migrant workers (% change since 2000)
Vacant housing units - Other vacant (%)
Vacant housing units - Other vacant (% change since 2000)
Median monthly housing costs ($)
Median household income for houses/condos with a mortgage ($)
Median household income for houses/condos without a mortgage ($)
Median household income ($)
Median household income ($) - White
Median household income ($) - Black or African American
Median household income ($) - Asian
Median household income ($) - Hispanic or Latino
Median household income ($) - American Indian and Alaska Native
Median household income ($) - Multirace
Median household income ($) - Other Race
Mortgage status - with mortgage (%)
Mortgage status - with second mortgage (%)
Mortgage status - with home equity loan (%)
Mortgage status - with both second mortgage and home equity loan (%)
Mortgage status - without a mortgage (%)
Median year house/condo built
Median year apartment built
Household type by relationship - Male householder living alone (%)
Household type by relationship - Male householder not living alone (%)
Household type by relationship - Female householder living alone (%)
Household type by relationship - Female householder not living alone (%)
Household type by relationship - Opposite-Sex spouse (%)
Household type by relationship - Same-Sex spouse (%)
Household type by relationship - Opposite-Sex unmarried partner (%)
Household type by relationship - Same-Sex unmarried partner (%)
Household type by relationship - In group quarters (%)
Size of family households - 2-person household (%)
Size of family households - 3-person household (%)
Size of family households - 4-person household (%)
Size of family households - 5-person household (%)
Size of family households - 6-person household (%)
Size of family households - 7-or-more-person household (%)
Size of nonfamily households - 1-person household (%)
Size of nonfamily households - 2-person household (%)
Size of nonfamily households - 3-person household (%)
Size of nonfamily households - 4-person household (%)
Size of nonfamily households - 5-person household (%)
Size of nonfamily households - 6-person household (%)
Size of nonfamily households - 7-or-moreperson household (%)
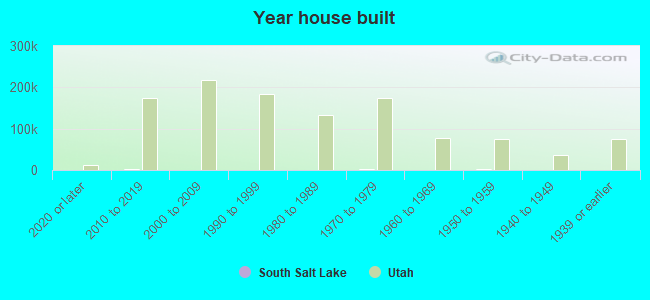
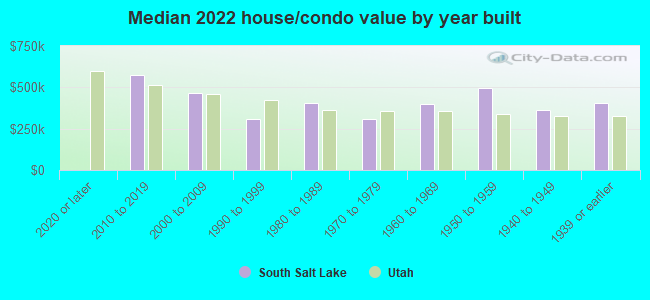
Year house built - Built 2010 or later (%)
Year house built - Built 2000 to 2009 (%)
Year house built - Built 1990 to 1999 (%)
Year house built - Built 1980 to 1989 (%)
Year house built - Built 1970 to 1979 (%)
Year house built - Built 1960 to 1969 (%)
Year house built - Built 1950 to 1959 (%)
Year house built - Built 1940 to 1949 (%)
Year house built - Built 1939 or earlier (%)
Median number of rooms in houses and condos
Median number of rooms in apartments
Median number of bedrooms in owner occupied houses
Mean number of bedrooms in owner occupied houses
Median number of bedrooms in renter occupied houses
Mean number of bedrooms in renter occupied houses
Median number of vehichles in owner occupied houses
Mean number of vehichles in owner occupied houses
Median number of vehichles in renter occupied houses
Mean number of vehichles in renter occupied houses
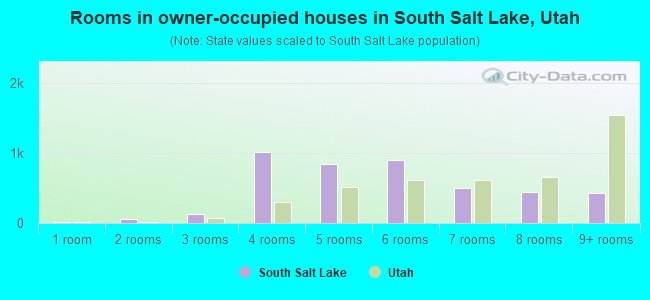
Rooms in owner-occupied houses - 1 room (%)
Rooms in owner-occupied houses - 2 rooms (%)
Rooms in owner-occupied houses - 3 rooms (%)
Rooms in owner-occupied houses - 4 rooms (%)
Rooms in owner-occupied houses - 5 rooms (%)
Rooms in owner-occupied houses - 6 rooms (%)
Rooms in owner-occupied houses - 7 rooms (%)
Rooms in owner-occupied houses - 8 rooms (%)
Rooms in owner-occupied houses - 9+ rooms (%)
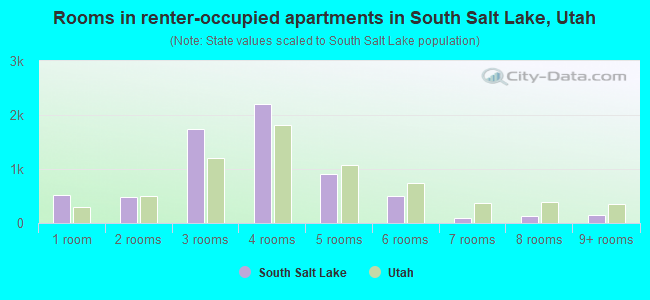
Rooms in renter-occupied houses - 1 room (%)
Rooms in renter-occupied houses - 2 rooms (%)
Rooms in renter-occupied houses - 3 rooms (%)
Rooms in renter-occupied houses - 4 rooms (%)
Rooms in renter-occupied houses - 5 rooms (%)
Rooms in renter-occupied houses - 6 rooms (%)
Rooms in renter-occupied houses - 7 rooms (%)
Rooms in renter-occupied houses - 8 rooms (%)
Rooms in renter-occupied houses - 9+ rooms (%)
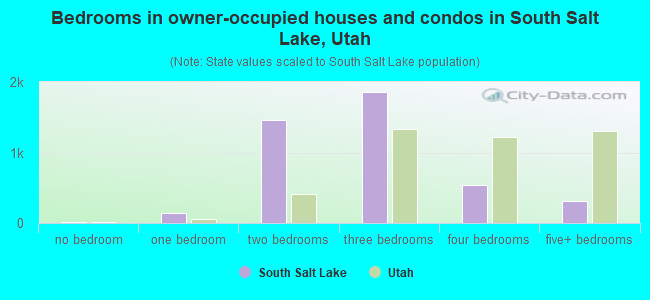
Bedrooms in owner-occupied houses - no bedrooms (%)
Bedrooms in owner-occupied houses - 1 bedroom (%)
Bedrooms in owner-occupied houses - 2 bedrooms (%)
Bedrooms in owner-occupied houses - 3 bedrooms (%)
Bedrooms in owner-occupied houses - 4 bedrooms (%)
Bedrooms in owner-occupied houses - 5+ bedrooms (%)
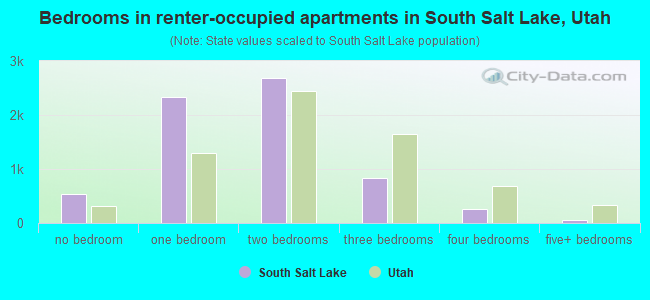
Bedrooms in renter-occupied houses - no bedrooms (%)
Bedrooms in renter-occupied houses - 1 bedroom (%)
Bedrooms in renter-occupied houses - 2 bedrooms (%)
Bedrooms in renter-occupied houses - 3 bedrooms (%)
Bedrooms in renter-occupied houses - 4 bedrooms (%)
Bedrooms in renter-occupied houses - 5+ bedrooms (%)
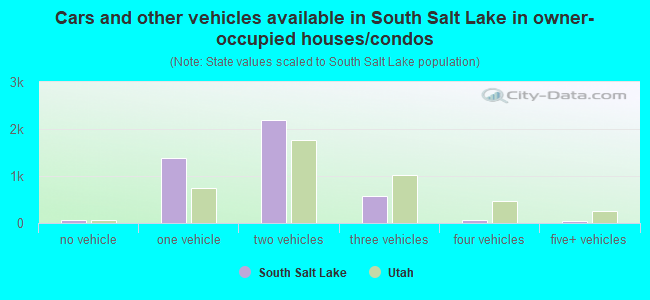
Vehicles available in owner-occupied houses - no vehicle available (%)
Vehicles available in owner-occupied houses - 1 vehicle available(%)
Vehicles available in owner-occupied houses - 2 Vehicles available (%)
Vehicles available in owner-occupied houses - 3 Vehicles available (%)
Vehicles available in owner-occupied houses - 4 Vehicles available (%)
Vehicles available in owner-occupied houses - 5+ Vehicles available (%)
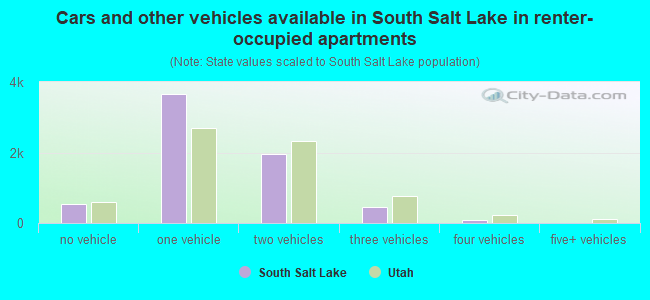
Vehicles available in renter-occupied houses - no vehicle available (%)
Vehicles available in renter-occupied houses - 1 vehicle available (%)
Vehicles available in renter-occupied houses - 2 Vehicles available (%)
Vehicles available in renter-occupied houses - 3 Vehicles available (%)
Vehicles available in renter-occupied houses - 4 Vehicles available (%)
Vehicles available in renter-occupied houses - 5+ Vehicles available (%)
Housing units in structures - 1, detached (%)
Housing units in structures - 1, attached (%)
Housing units in structures - 2 (%)
Housing units in structures - 3 or 4 (%)
Housing units in structures - 5 to 9 (%)
Housing units in structures - 10 to 19 (%)
Housing units in structures - 20 to 49 (%)
Housing units in structures - 50 or more (%)
Housing units in structures - Mobile home (%)
Housing units in structures - Boat, RV, van, etc. (%)
Housing units in structures - Owners - 1, detached (%)
Housing units in structures - Owners - 1, attached (%)
Housing units in structures - Owners - 2 (%)
Housing units in structures - Owners - 3 or 4 (%)
Housing units in structures - Owners - 5 to 9 (%)
Housing units in structures - Owners - 10 to 19 (%)
Housing units in structures - Owners - 20 to 49 (%)
Housing units in structures - Owners - 50 or more (%)
Housing units in structures - Owners - Mobile home (%)
Housing units in structures - Owners - Boat, RV, van, etc. (%)
Housing units in structures - Renters - 1, detached (%)
Housing units in structures - Renters - 1, attached (%)
Housing units in structures - Renters - 2 (%)
Housing units in structures - Renters - 3 or 4 (%)
Housing units in structures - Renters - 5 to 9 (%)
Housing units in structures - Renters - 10 to 19 (%)
Housing units in structures - Renters - 20 to 49 (%)
Housing units in structures - Renters - 50 or more (%)
Housing units in structures - Renters - Mobile home (%)
Housing units in structures - Renters - Boat, RV, van, etc. (%)
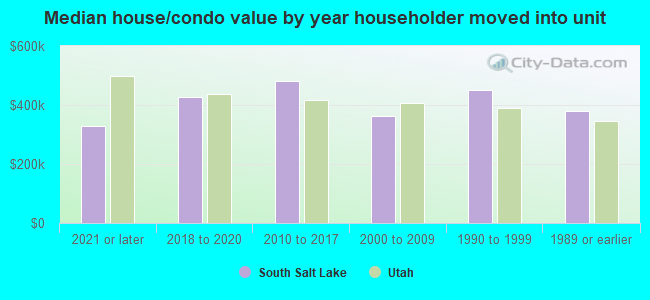
House/condo owner moved in on average (years ago)
Renter moved in on average (years ago)
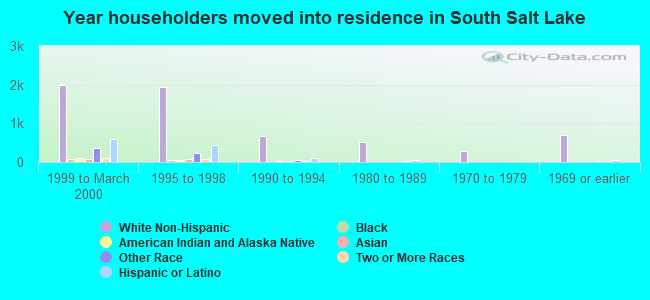
Year householder moved into unit - Moved in 1999 to March 2000 (%)
Year householder moved into unit - Moved in 1999 to March 2000 (%) - White
Year householder moved into unit - Moved in 1999 to March 2000 (%) - Black or African American
Year householder moved into unit - Moved in 1999 to March 2000 (%) - Asian
Year householder moved into unit - Moved in 1999 to March 2000 (%) - Hispanic or Latino
Year householder moved into unit - Moved in 1999 to March 2000 (%) - American Indian and Alaska Native
Year householder moved into unit - Moved in 1999 to March 2000 (%) - Multirace
Year householder moved into unit - Moved in 1999 to March 2000 (%) - Other Race
Year householder moved into unit - Moved in 1995 to 1998 (%)
Year householder moved into unit - Moved in 1995 to 1998 (%) - White
Year householder moved into unit - Moved in 1995 to 1998 (%) - Black or African American
Year householder moved into unit - Moved in 1995 to 1998 (%) - Asian
Year householder moved into unit - Moved in 1995 to 1998 (%) - Hispanic or Latino
Year householder moved into unit - Moved in 1995 to 1998 (%) - American Indian and Alaska Native
Year householder moved into unit - Moved in 1995 to 1998 (%) - Multirace
Year householder moved into unit - Moved in 1995 to 1998 (%) - Other Race
Year householder moved into unit - Moved in 1990 to 1994 (%)
Year householder moved into unit - Moved in 1990 to 1994 (%) - White
Year householder moved into unit - Moved in 1990 to 1994 (%) - Black or African American
Year householder moved into unit - Moved in 1990 to 1994 (%) - Asian
Year householder moved into unit - Moved in 1990 to 1994 (%) - Hispanic or Latino
Year householder moved into unit - Moved in 1990 to 1994 (%) - American Indian and Alaska Native
Year householder moved into unit - Moved in 1990 to 1994 (%) - Multirace
Year householder moved into unit - Moved in 1990 to 1994 (%) - Other Race
Year householder moved into unit - Moved in 1980 to 1989 (%)
Year householder moved into unit - Moved in 1980 to 1989 (%) - White
Year householder moved into unit - Moved in 1980 to 1989 (%) - Black or African American
Year householder moved into unit - Moved in 1980 to 1989 (%) - Asian
Year householder moved into unit - Moved in 1980 to 1989 (%) - Hispanic or Latino
Year householder moved into unit - Moved in 1980 to 1989 (%) - American Indian and Alaska Native
Year householder moved into unit - Moved in 1980 to 1989 (%) - Multirace
Year householder moved into unit - Moved in 1980 to 1989 (%) - Other Race
Year householder moved into unit - Moved in 1970 to 1979 (%)
Year householder moved into unit - Moved in 1970 to 1979 (%) - White
Year householder moved into unit - Moved in 1970 to 1979 (%) - Black or African American
Year householder moved into unit - Moved in 1970 to 1979 (%) - Asian
Year householder moved into unit - Moved in 1970 to 1979 (%) - Hispanic or Latino
Year householder moved into unit - Moved in 1970 to 1979 (%) - American Indian and Alaska Native
Year householder moved into unit - Moved in 1970 to 1979 (%) - Multirace
Year householder moved into unit - Moved in 1970 to 1979 (%) - Other Race
Year householder moved into unit - Moved in 1969 or earlier (%)
Year householder moved into unit - Moved in 1969 or earlier (%) - White
Year householder moved into unit - Moved in 1969 or earlier (%) - Black or African American
Year householder moved into unit - Moved in 1969 or earlier (%) - Asian
Year householder moved into unit - Moved in 1969 or earlier (%) - Hispanic or Latino
Year householder moved into unit - Moved in 1969 or earlier (%) - American Indian and Alaska Native
Year householder moved into unit - Moved in 1969 or earlier (%) - Multirace
Year householder moved into unit - Moved in 1969 or earlier (%) - Other Race
Housing units lacking complete plumbing facilities (%)
Housing units lacking complete kitchen facilities (%)
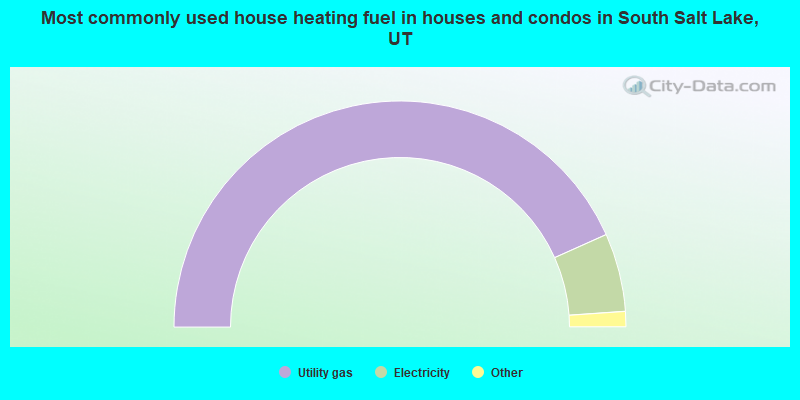
House heating fuel used in houses and condos - Utility gas (%)
House heating fuel used in houses and condos - Bottled, tank, or LP gas (%)
House heating fuel used in houses and condos - Electricity (%)
House heating fuel used in houses and condos - Fuel oil, kerosene, etc. (%)
House heating fuel used in houses and condos - Coal or coke (%)
House heating fuel used in houses and condos - Wood (%)
House heating fuel used in houses and condos - Solar energy (%)
House heating fuel used in houses and condos - Other fuel (%)
House heating fuel used in houses and condos - No fuel used (%)
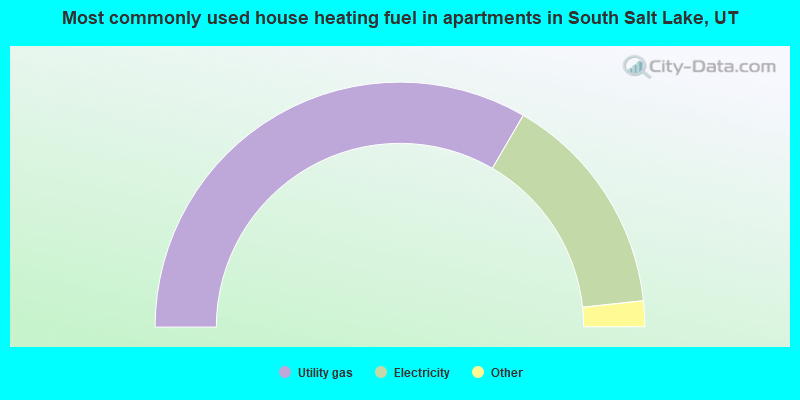
House heating fuel used in apartments - Utility gas (%)
House heating fuel used in apartments - Bottled, tank, or LP gas (%)
House heating fuel used in apartments - Electricity (%)
House heating fuel used in apartments - Fuel oil, kerosene, etc. (%)
House heating fuel used in apartments - Coal or coke (%)
House heating fuel used in apartments - Wood (%)
House heating fuel used in apartments - Solar energy (%)
House heating fuel used in apartments - Other fuel (%)
House heating fuel used in apartments - No fuel used (%)
Median year house/condo built: 1962Median year apartment built: 1983Household type by relationship:
Households: 26,440
Male householders: 5,980 (2,106 living alone ), Female householders: 4,670 (1,842 living alone )3,357 spouses (3,296 opposite-sex spouses ), 949 unmarried partners , (872 opposite-sex unmarried partners ), 6,280 children (5,766 natural , 51 adopted , 463 stepchildren ), 400 grandchildren , 839 brothers or sisters , 585 parents , 0 foster children , 475 other relatives , 1,576 non-relatives In group quarters: 1,323
Size of family households: 2,539 2-persons , 1,463 3-persons , 767 4-persons , 510 5-persons , 222 6-persons , 184 7-or-more-persons .
Size of nonfamily households: 3,995 1-person , 1,110 2-persons , 99 3-persons , 152 4-persons , 28 7-or-more-persons .
2,784 married couples with children. single-parent households (413 men , 1,083 women ).
66.9% of residents of South Salt Lake speak English at home. of residents speak Spanish at home (54% speak English very well , 27% speak English well , 16% speak English not well , 3% don't speak English at all ).of residents speak other Indo-European language at home (75% speak English very well , 11% speak English well , 12% speak English not well , 2% don't speak English at all ).of residents speak Asian or Pacific Island language at home (49% speak English very well , 29% speak English well , 20% speak English not well , 2% don't speak English at all ).of residents speak other language at home (64% speak English very well , 18% speak English well , 18% speak English not well ).
Foreign born population: 6,171 (23.3%)of them are naturalized citizens )
Median number of rooms in houses and condos:
Median number of rooms in apartments
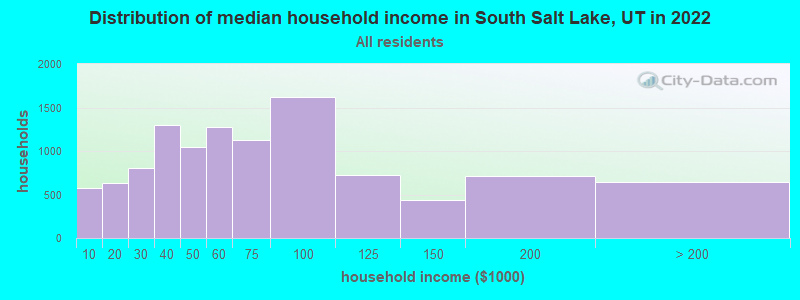
South Salt Lake, UT household income distribution 578 Less than $10,000633 $10,000 to $19,999801 $20,000 to $29,9991,297 $30,000 to $39,9991,049 $40,000 to $49,9991,277 $50,000 to $59,9991,128 $60,000 to $74,9991,624 $75,000 to $99,999727 $100,000 to $124,999435 $125,000 to $149,999707 $150,000 to $199,999645 $200,000 or more
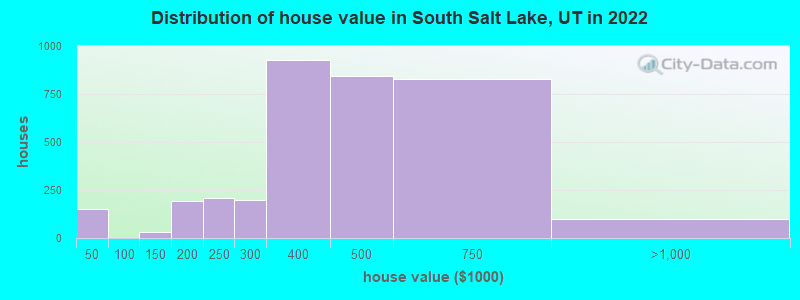
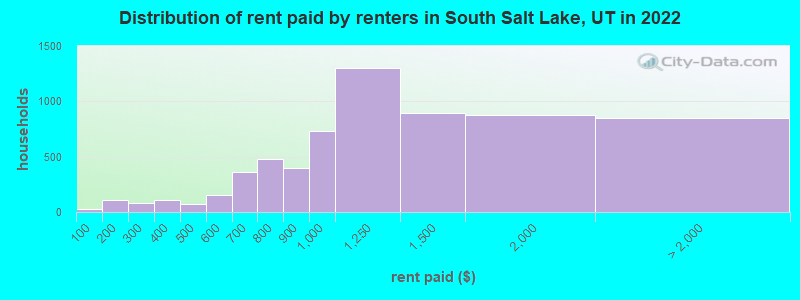
Home value of owner - occupied houses in 2022 in South Salt Lake, UT 40 Less than $10,0007 $10,000 to $14,9997 $25,000 to $29,99997 $35,000 to $39,99929 $125,000 to $149,999103 $150,000 to $174,99989 $175,000 to $199,999208 $200,000 to $249,999200 $250,000 to $299,999925 $300,000 to $399,999843 $400,000 to $499,999827 $500,000 to $749,99998 $750,000 to $999,999Rent paid by renters in 2022 in South Salt Lake, UT 27 Less than $100105 $100 to $14948 $200 to $24930 $250 to $29910 $300 to $34998 $350 to $3994 $400 to $44970 $450 to $49924 $500 to $549133 $550 to $599320 $600 to $64943 $650 to $699157 $700 to $749324 $750 to $799401 $800 to $899731 $900 to $9991,297 $1,000 to $1,249896 $1,250 to $1,499878 $1,500 to $1,999469 $2,000 to $2,49943 $2,500 to $2,999336 No cash rent
Percentage of workers working in this county: 92.3%Number of people working at home: 1,831 (11.9% of all workers )
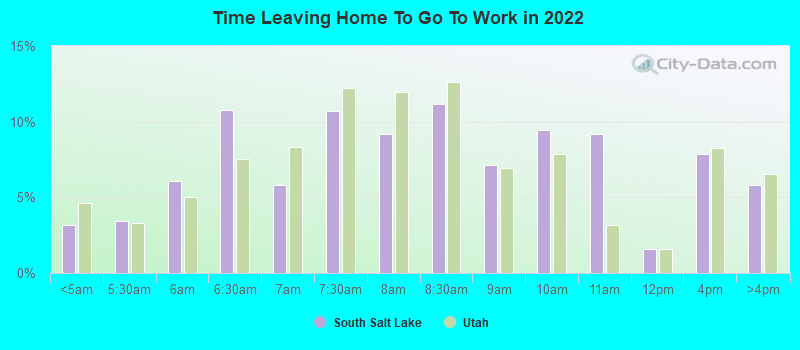
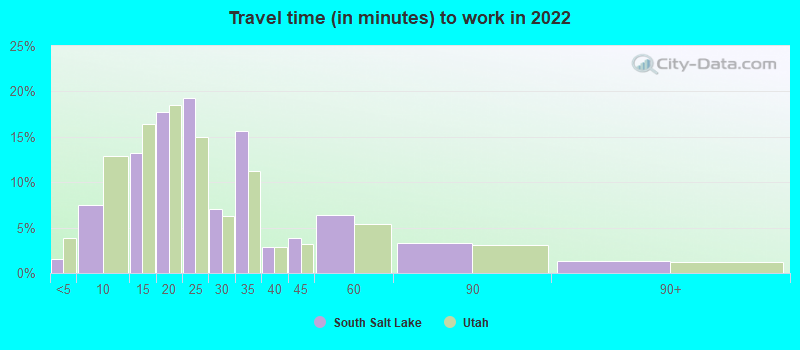
Travel time to work (commute)
Less than 5 minutes: 5285 to 9 minutes: 1,48810 to 14 minutes: 2,29015 to 19 minutes: 2,72320 to 24 minutes: 2,39925 to 29 minutes: 1,21930 to 34 minutes: 1,25335 to 39 minutes: 20240 to 44 minutes: 30545 to 59 minutes: 48460 to 89 minutes: 22090 or more minutes: 128
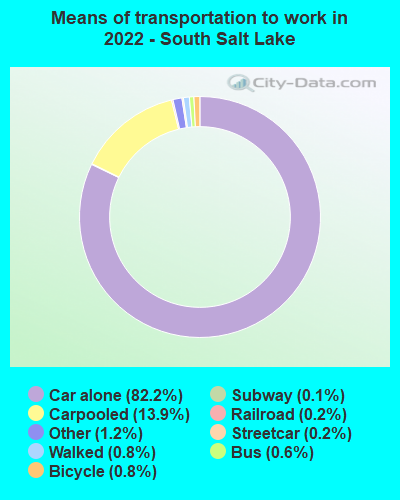
Means of transportation to work:
Drove a car alone: 20,936 (74.8%)Carpooled: 3,796 (13.6%)Bus : 110 (0.4%)Subway or elevated rail : 30 (0.1%)Long-distance train or commuter rail : 22 (0.1%)Light rail, streetcar or trolley : 29 (0.1%)Ferryboat: 1 (0.0%)Taxi: 318 (1.1%)Bicycle: 180 (0.6%)Walked: 203 (0.7%)Worked at home: 1,831 (6.5%)
Unemployment by race in 2022
Unemployment rate for White non-Hispanic residents 2.8% Males1.6% FemalesUnemployment rate for Black residents 2.2% Males1.1% FemalesUnemployment rate for Asian residents 2.1% Males1.0% FemalesUnemployment rate for other race residents 0.9% Males2.4% FemalesUnemployment rate for two or more race residents 16.6% Males12.0% FemalesUnemployment rate for Hispanic or Latino residents 7.4% Males2.9% Females
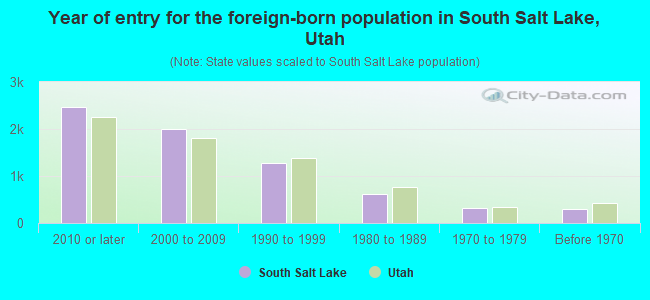
Year of entry for the foreign-born population in South Salt Lake, Utah
2,476 2010 or later 2,010 2000 to 2009 1,284 1990 to 1999 614 1980 to 1989 311 1970 to 1979 300 Before 1970
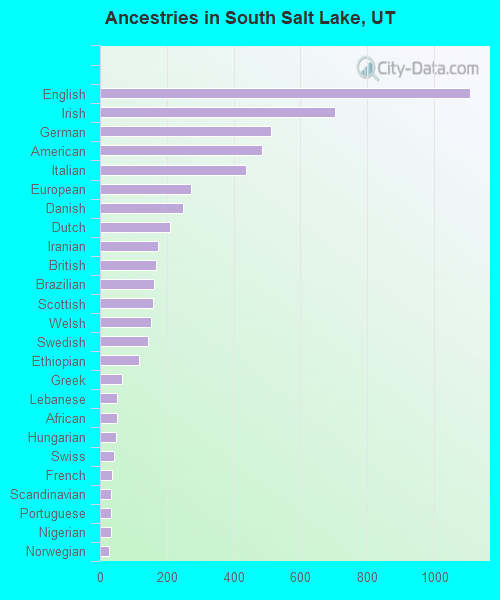
First ancestries reported:
English: 1,109 (7.0%)
Irish: 702 (4.4%)
German: 512 (3.2%)
American: 485 (3.0%)
Italian: 437 (2.7%)
European: 272 (1.7%)
Danish: 247 (1.6%)
Dutch: 209 (1.3%)
Iranian: 174 (1.1%)
British: 168 (1.1%)
Brazilian: 162 (1.0%)
Scottish: 159 (1.0%)
Welsh: 152 (1.0%)
Swedish: 144 (0.9%)
Ethiopian: 117 (0.7%)
Greek: 67 (0.4%)
Lebanese: 51 (0.3%)
African: 50 (0.3%)
Hungarian: 49 (0.3%)
Swiss: 43 (0.3%)
French: 37 (0.2%)
Scandinavian: 33 (0.2%)
Portuguese: 32 (0.2%)
Nigerian: 32 (0.2%)
Norwegian: 28 (0.2%)
Somali: 23 (0.1%)
Finnish: 21 (0.1%)
Canadian: 21 (0.1%)
Scotch-Irish: 15 (0.09%)
Sudanese: 15 (0.09%)
Liberian: 14 (0.09%)
Iraqi: 13 (0.08%)
Basque: 13 (0.08%)
Polish: 11 (0.07%)
Yugoslavian: 11 (0.07%)
Russian: 10 (0.06%)
Austrian: 10 (0.06%)
Belgian: 10 (0.06%)
Armenian: 5 (0.03%)
Northern European: 5 (0.03%)
Australian: 4 (0.03%)
French Canadian: 2 (0.01%) Most common places of birth for foreign-born residents (%): Mexico South Salt Lake:
28.3% (1,767)Utah:
36.1% (99,740)
Bhutan South Salt Lake:
10.4% (646)Utah:
0.2% (519)
Peru South Salt Lake:
5.8% (360)Utah:
2.9% (7,901)
Honduras South Salt Lake:
4.6% (284)Utah:
0.9% (2,365)
Nepal South Salt Lake:
4.5% (282)Utah:
0.4% (988)
Spain South Salt Lake:
4.4% (272)Utah:
0.5% (1,315)
China, excluding Hong Kong and Taiwan South Salt Lake:
4.3% (267)Utah:
2.9% (8,017)
Brazil South Salt Lake:
3.8% (238)Utah:
2.8% (7,644)
Iran South Salt Lake:
3.2% (198)Utah:
0.8% (2,137)
Malaysia South Salt Lake:
2.7% (171)Utah:
0.2% (528)
Burma (Myanmar) South Salt Lake:
2.1% (134)Utah:
0.4% (1,109)
Dominican Republic South Salt Lake:
2.0% (126)Utah:
0.7% (1,814)
Ethiopia South Salt Lake:
1.9% (118)Utah:
0.3% (692)
Guatemala South Salt Lake:
1.7% (108)Utah:
2.1% (5,902)
Place of birth for U.S.-born residents:
This state: 12,313Other state: 7,578Northeast: 804Midwest: 1,474South: 1,307West: 3,986 75.2% of South Salt Lake residents lived in the same house 1 years ago.
Out of people who lived in different houses, 42.0% lived in this county.
Out of people who lived in different counties, 36.5% lived in Utah.
South Salt Lake:
75.2%State average:
85.7%
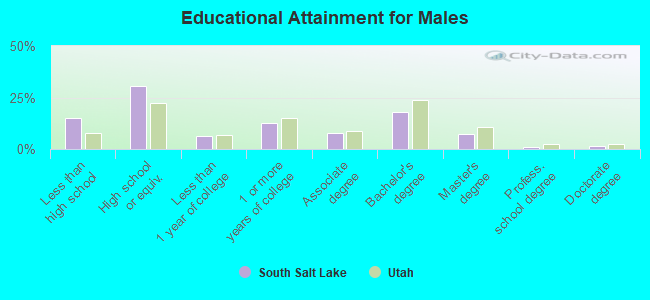
Education attainment for males 25 years and older:
No schooling: 323Nursery to 4th grade: 45th and 6th grade: 1997th and 8th grade: 529th grade: 10710th grade: 10711th grade: 23312th grade, no diploma: 412High school graduate (or equivalency): 2,923Less than 1 year of college: 594Some college more than 1 year, no degree: 1,183Associate degree: 749Bachelor's degree: 1,716Master's degree: 670Professional school degree: 98Doctorate degree: 145
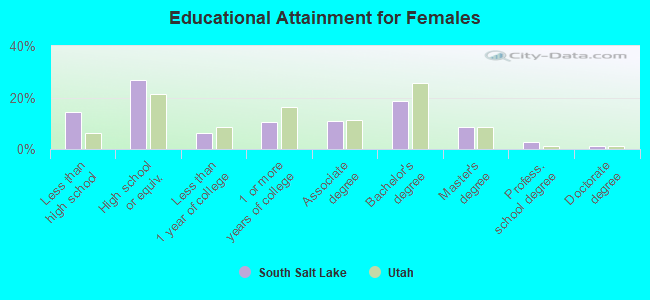
Education attainment for females 25 years and older:
No schooling: 268Nursery to 4th grade: 495th and 6th grade: 1877th and 8th grade: 2079th grade: 6910th grade: 14511th grade: 6912th grade, no diploma: 167High school graduate (or equivalency): 2,141Less than 1 year of college: 506Some college more than 1 year, no degree: 850Associate degree: 868Bachelor's degree: 1,491Master's degree: 684Professional school degree: 220Doctorate degree: 88
Housing units in structures:
One, detached: 4,632One, attached: 1,096Two: 6363 or 4: 7775 to 9: 93610 to 19: 1,41620 to 49: 1,10050 or more: 1,415Mobile homes: 78Boats, RVs, vans, etc.: 54Housing units lacking complete plumbing facilities in 2022: 1.7%Housing units lacking complete kitchen facilities in 2022: 1.3%House/condo owner moved in on average 7 years ago
Renter moved in on average 3 years ago
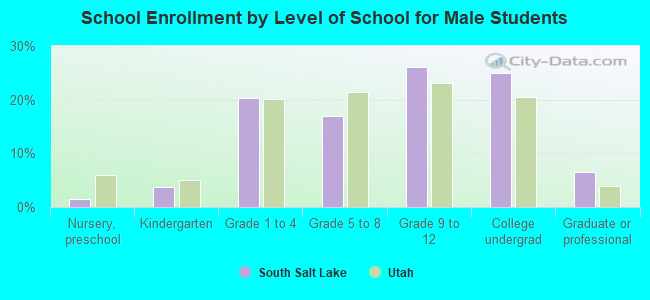
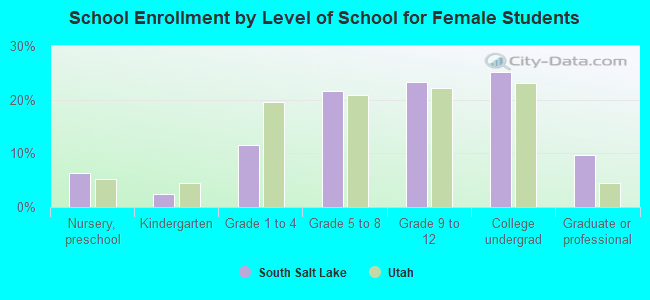
Private vs. public school enrollment:
Students in private schools in grades 1 to 8 (elementary and middle school): 60 Students in private schools in grades 9 to 12 (high school): 78 Students in private undergraduate colleges: 161