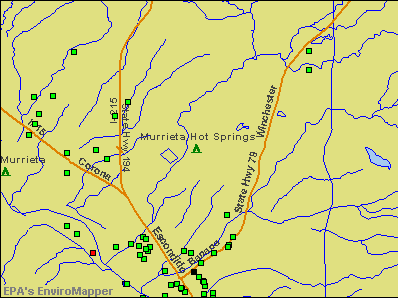
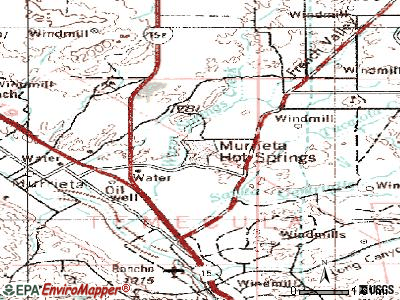
Murrieta Hot Springs, California
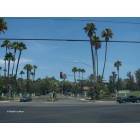
Murrieta Hot Springs: Entrance to Calvary Chapel Bible College - Murrieta Hot Springs & Margarita Rd
- add
your
Submit your own pictures of this place and show them to the world
- OSM Map
- General Map
- Google Map
- MSN Map
| Males: 1,756 | |
| Females: 2,131 |
| Median resident age: | 60.7 years |
| California median age: | 33.3 years |
Zip codes: 92563.
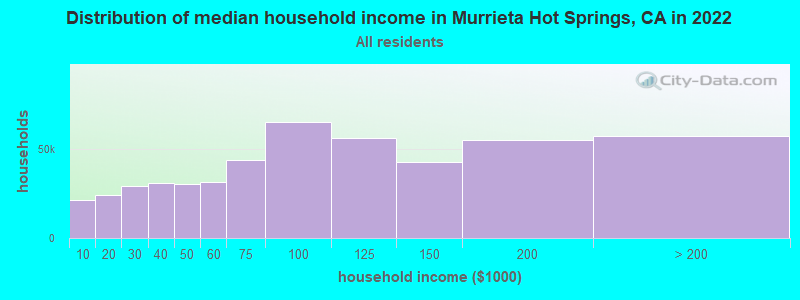
| Murrieta Hot Springs: | $55,242 |
| CA: | $91,551 |
Estimated per capita income in 2022: $37,939 (it was $19,991 in 2000)
Murrieta Hot Springs CDP income, earnings, and wages data
Estimated median house or condo value in 2022: $411,819 (it was $100,100 in 2000)
| Murrieta Hot Springs: | $411,819 |
| CA: | $715,900 |
Mean prices in 2022: all housing units: $586,167; detached houses: $631,165; townhouses or other attached units: $625,082; in 2-unit structures: $464,831; in 3-to-4-unit structures: $482,529; in 5-or-more-unit structures: $526,423; mobile homes: $178,284; occupied boats, rvs, vans, etc.: $86,227
Murrieta Hot Springs, CA residents, houses, and apartments details
Detailed information about poverty and poor residents in Murrieta Hot Springs, CA

Compare current foreclosures near Murrieta Hot Springs, CA:


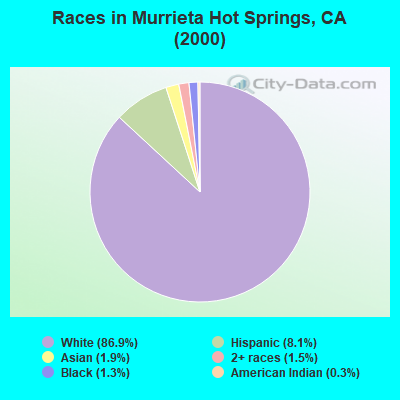
- 2,56186.9%White alone
- 2398.1%Hispanic
- 561.9%Asian alone
- 431.5%Two or more races
- 391.3%Black alone
- 90.3%American Indian alone
- 10.03%Native Hawaiian and Other
Pacific Islander alone
According to our research of California and other state lists, there were 2 registered sex offenders living in Murrieta Hot Springs, California as of May 09, 2024.
The ratio of all residents to sex offenders in Murrieta Hot Springs is 1,944 to 1.
The ratio of registered sex offenders to all residents in this city is much lower than the state average.
 Recent articles from our blog. Our writers, many of them Ph.D. graduates or candidates, create easy-to-read articles on a wide variety of topics.

 | Pictures of the Inland Empire (278 replies) |
| Temecula vs Winchita vs Murrieta vs French Valley? Moving asap! (7 replies) |
| Moped/scooter dealers in Temecula (5 replies) |
| Things I Wish I Knew BEFORE Moving to Murrieta (81 replies) |
| Commute from Temecula to Irvine and Vice Versa (34 replies) |
| Driving on the 101 and 134 (13 replies) |
Latest news from Murrieta Hot Springs, CA collected exclusively by city-data.com from local newspapers, TV, and radio stations
Ancestries: German (16.0%), English (13.4%), Irish (10.8%), United States (6.5%), Italian (5.6%), French (4.2%).
Current Local Time: PST time zone
Elevation: 1160 feet
Land area: 1.28 square miles.
Population density: 3,041 people per square mile (average).
345 residents are foreign born (6.1% Europe, 3.0% Latin America, 1.5% Asia).
| This place: | 11.7% |
| California: | 26.2% |
| Murrieta Hot Springs CDP: | 1.2% ($1,232) |
| California: | 0.8% ($1,564) |
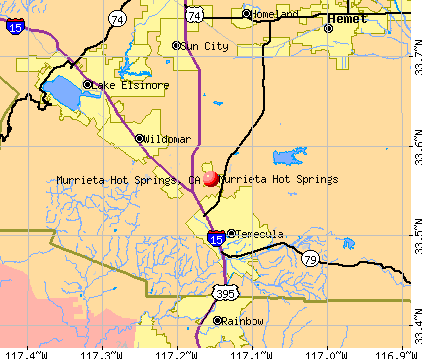
Nearest city with pop. 50,000+: Temecula, CA  (4.5 miles , pop. 57,716).
Nearest city with pop. 200,000+: Riverside, CA (30.0 miles , pop. 255,166).
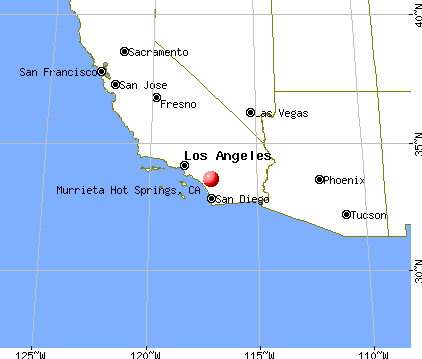
Nearest city with pop. 1,000,000+: San Diego, CA (54.2 miles , pop. 1,223,400).
Nearest cities:
), ), Latitude: 33.56 N, Longitude: 117.16 W
Area code commonly used in this area: 909
| Here: | 5.2% |
| California: | 5.1% |
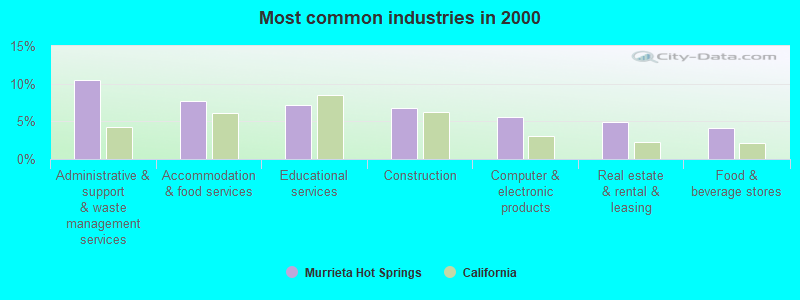
- Administrative & support & waste management services (10.5%)
- Accommodation & food services (7.7%)
- Educational services (7.2%)
- Construction (6.7%)
- Computer & electronic products (5.5%)
- Real estate & rental & leasing (5.0%)
- Food & beverage stores (4.1%)
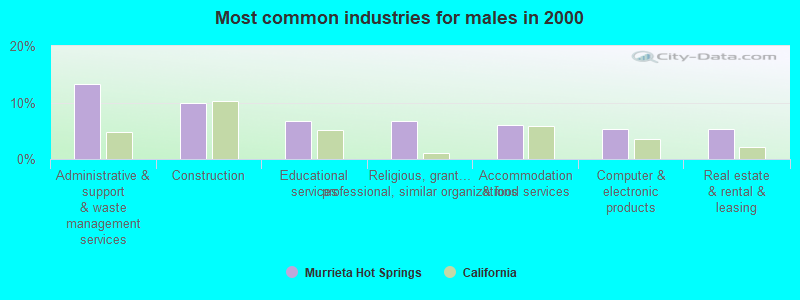
- Administrative & support & waste management services (13.3%)
- Construction (9.8%)
- Educational services (6.8%)
- Religious, grantmaking, civic, professional, similar organizations (6.8%)
- Accommodation & food services (5.9%)
- Computer & electronic products (5.3%)
- Real estate & rental & leasing (5.3%)
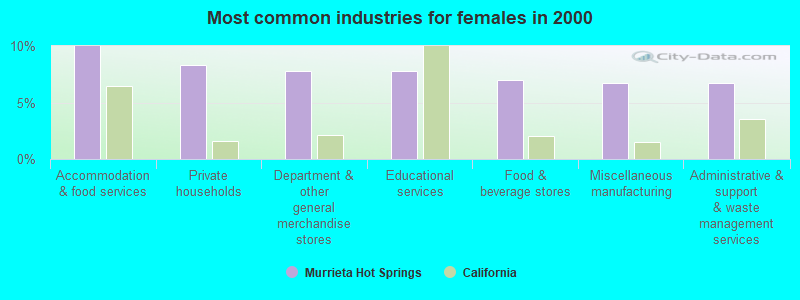
- Accommodation & food services (10.0%)
- Private households (8.4%)
- Department & other general merchandise stores (7.8%)
- Educational services (7.8%)
- Food & beverage stores (7.0%)
- Miscellaneous manufacturing (6.7%)
- Administrative & support & waste management services (6.7%)
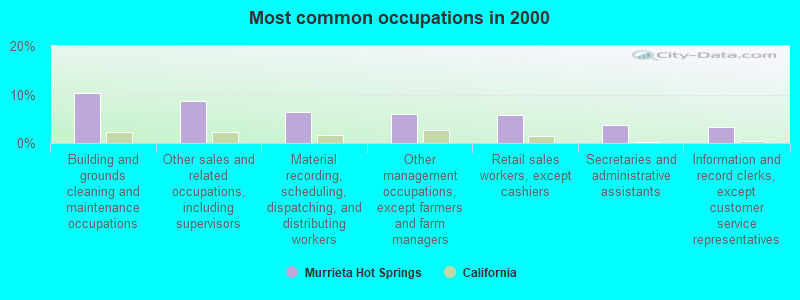
- Building and grounds cleaning and maintenance occupations (10.3%)
- Other sales and related occupations, including supervisors (8.6%)
- Material recording, scheduling, dispatching, and distributing workers (6.5%)
- Other management occupations, except farmers and farm managers (5.9%)
- Retail sales workers, except cashiers (5.8%)
- Secretaries and administrative assistants (3.7%)
- Information and record clerks, except customer service representatives (3.3%)
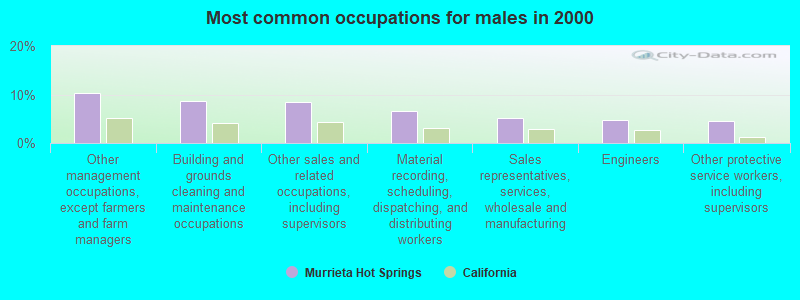
- Other management occupations, except farmers and farm managers (10.2%)
- Building and grounds cleaning and maintenance occupations (8.6%)
- Other sales and related occupations, including supervisors (8.4%)
- Material recording, scheduling, dispatching, and distributing workers (6.6%)
- Sales representatives, services, wholesale and manufacturing (5.1%)
- Engineers (4.7%)
- Other protective service workers, including supervisors (4.5%)
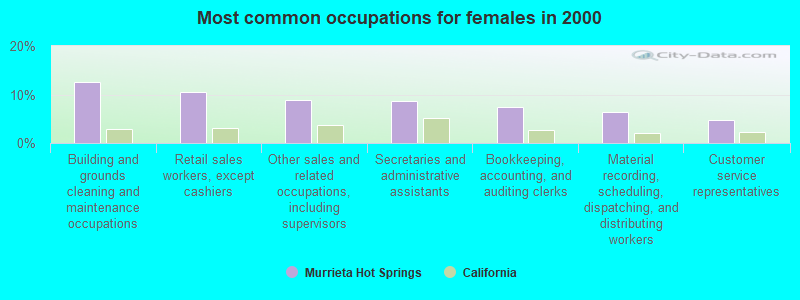
- Building and grounds cleaning and maintenance occupations (12.5%)
- Retail sales workers, except cashiers (10.6%)
- Other sales and related occupations, including supervisors (8.9%)
- Secretaries and administrative assistants (8.6%)
- Bookkeeping, accounting, and auditing clerks (7.5%)
- Material recording, scheduling, dispatching, and distributing workers (6.4%)
- Customer service representatives (4.7%)
Average climate in Murrieta Hot Springs, California
Based on data reported by over 4,000 weather stations


|
|

(lower is better)
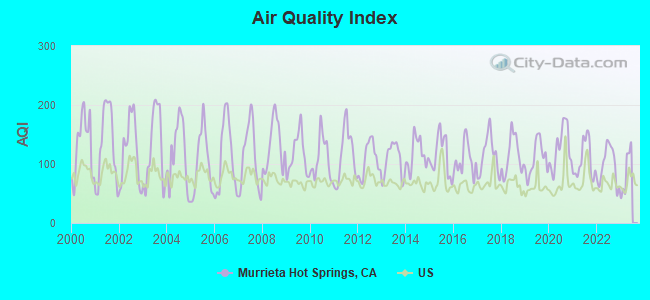
Air Quality Index (AQI) level in 2022 was 96.9. This is worse than average.
| City: | 96.9 |
| U.S.: | 72.6 |
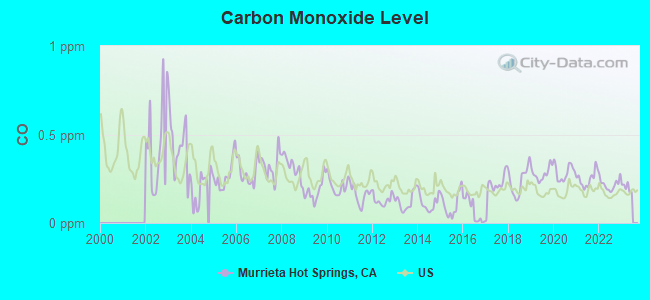
Carbon Monoxide (CO) [ppm] level in 2022 was 0.218. This is about average. Closest monitor was 5.0 miles away from the city center.
| City: | 0.218 |
| U.S.: | 0.251 |
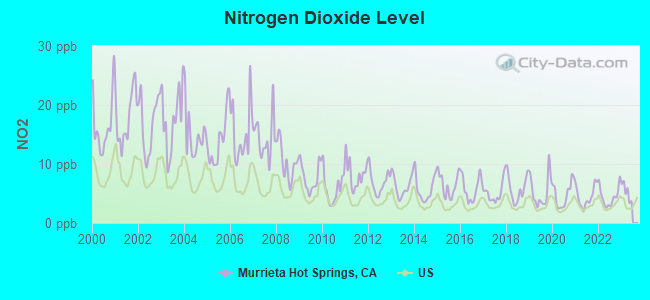
Nitrogen Dioxide (NO2) [ppb] level in 2022 was 4.47. This is about average. Closest monitor was 5.0 miles away from the city center.
| City: | 4.47 |
| U.S.: | 5.11 |
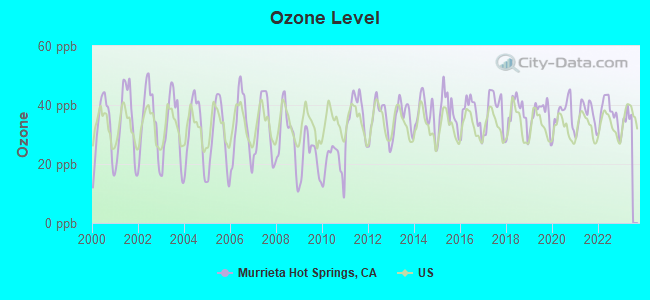
Ozone [ppb] level in 2022 was 37.3. This is about average. Closest monitor was 5.0 miles away from the city center.
| City: | 37.3 |
| U.S.: | 33.3 |
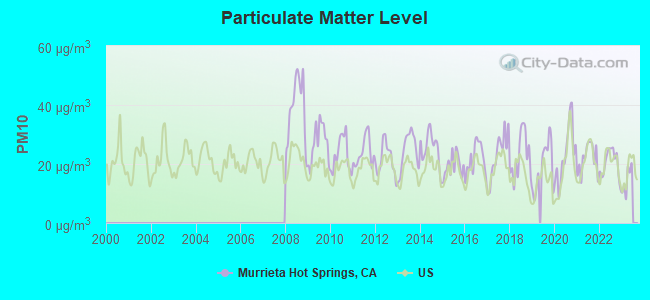
Particulate Matter (PM10) [µg/m3] level in 2022 was 20.2. This is about average. Closest monitor was 5.0 miles away from the city center.
| City: | 20.2 |
| U.S.: | 19.2 |
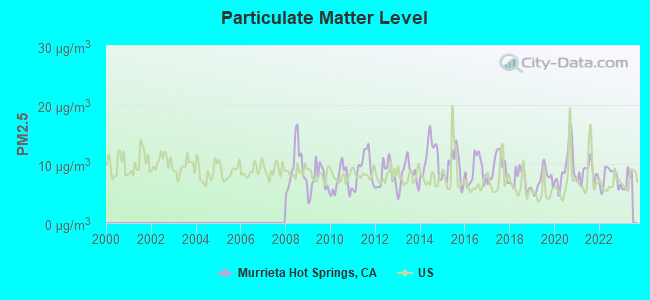
Particulate Matter (PM2.5) [µg/m3] level in 2022 was 7.70. This is about average. Closest monitor was 8.8 miles away from the city center.
| City: | 7.70 |
| U.S.: | 8.11 |
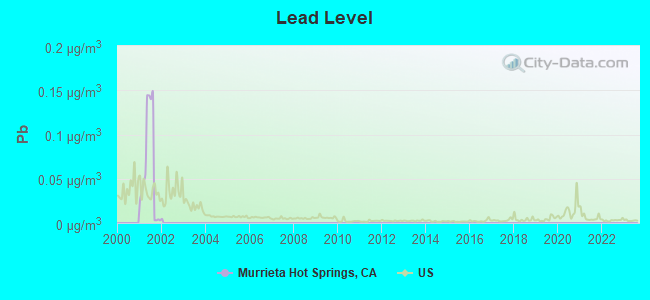
Lead (Pb) [µg/m3] level in 2001 was 0.0626. This is significantly worse than average. Closest monitor was 16.2 miles away from the city center.
| City: | 0.0626 |
| U.S.: | 0.0093 |
Earthquake activity:
Murrieta Hot Springs-area historical earthquake activity is significantly above California state average. It is 6842% greater than the overall U.S. average.On 6/28/1992 at 11:57:34, a magnitude 7.6 (6.2 MB, 7.6 MS, 7.3 MW, Depth: 0.7 mi, Class: Major, Intensity: VIII - XII) earthquake occurred 55.9 miles away from Murrieta Hot Springs center, causing 3 deaths (1 shaking deaths, 2 other deaths) and 400 injuries, causing $100,000,000 total damage and $40,000,000 insured losses
On 7/21/1952 at 11:52:14, a magnitude 7.7 (7.7 UK) earthquake occurred 144.9 miles away from the city center, causing $50,000,000 total damage
On 10/16/1999 at 09:46:44, a magnitude 7.4 (6.3 MB, 7.4 MS, 7.2 MW, 7.3 ML) earthquake occurred 77.7 miles away from Murrieta Hot Springs center
On 5/19/1940 at 04:36:40, a magnitude 7.2 (7.2 UK) earthquake occurred 87.5 miles away from Murrieta Hot Springs center, causing $33,000,000 total damage
On 4/21/1918 at 22:32:30, a magnitude 6.8 (6.8 UK, Class: Strong, Intensity: VII - IX) earthquake occurred 23.8 miles away from the city center
On 12/31/1934 at 18:45:56, a magnitude 7.1 (7.1 UK) earthquake occurred 101.1 miles away from Murrieta Hot Springs center
Magnitude types: body-wave magnitude (MB), local magnitude (ML), surface-wave magnitude (MS), moment magnitude (MW)
Natural disasters:
The number of natural disasters in Riverside County (46) is a lot greater than the US average (15).Major Disasters (Presidential) Declared: 27
Emergencies Declared: 1
Causes of natural disasters: Fires: 22, Floods: 20, Storms: 8, Winter Storms: 8, Landslides: 6, Mudslides: 5, Heavy Rains: 2, Earthquake: 1, Flash Flood: 1, Freeze: 1, Hurricane: 1, Tornado: 1, Tropical Storm: 1, Other: 1 (Note: some incidents may be assigned to more than one category).
Hospitals and medical centers near Murrieta Hot Springs:
- DAVITA-MURRIETA (Dialysis Facility, about 2 miles away; MURRIETA, CA)
- SOUTHWEST HEALTHCARE SYSTEM Acute Care Hospitals (about 2 miles away; MURRIETA, CA)
- RANCHO SPRINGS MEDICAL CENTER D/P SNF (Nursing Home, about 2 miles away; MURRIETA, CA)
- DAVITA-TEMECULA DIALYSIS CENTER (Dialysis Facility, about 3 miles away; TEMECULA, CA)
- COUNTRY VILLA MURRIETA HEALTHCARE CENTER (Nursing Home, about 3 miles away; MURRIETA, CA)
- LOMA LINDA UNIVERSITY MEDICAL CENTER-MURRIETA Acute Care Hospitals (about 4 miles away; MURRIETA, CA)
- ACKLEY HOME HEALTH (Home Health Center, about 4 miles away; TEMECULA, CA)
Colleges/universities with over 2000 students nearest to Murrieta Hot Springs:
- Mt San Jacinto Community College District (about 20 miles; San Jacinto, CA; Full-time enrollment: 8,426)
- Moreno Valley College (about 23 miles; Moreno Valley, CA; FT enrollment: 4,650)
- MiraCosta College (about 28 miles; Oceanside, CA; FT enrollment: 11,189)
- Palomar College (about 29 miles; San Marcos, CA; FT enrollment: 15,037)
- Saddleback College (about 30 miles; Mission Viejo, CA; FT enrollment: 13,716)
- California Baptist University (about 30 miles; Riverside, CA; FT enrollment: 6,085)
- California State University-San Marcos (about 31 miles; San Marcos, CA; FT enrollment: 8,070)
Points of interest:
Notable location: Rancho California Country Club (A). Display/hide its location on the map
Park in Murrieta Hot Springs: Park E (1). Display/hide its location on the map
| This place: | 1.9 people |
| California: | 2.9 people |
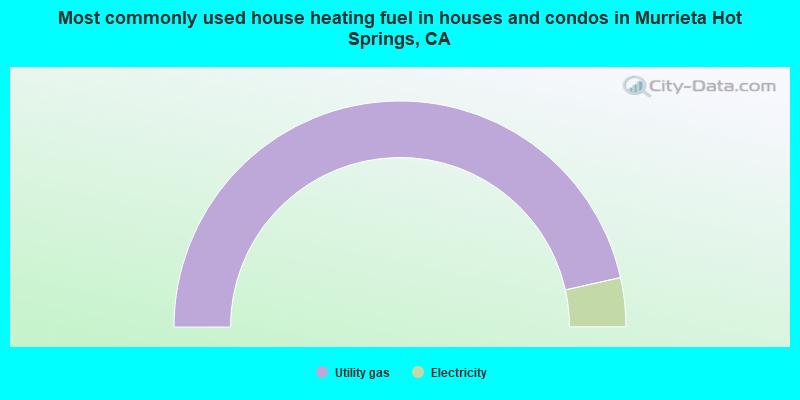
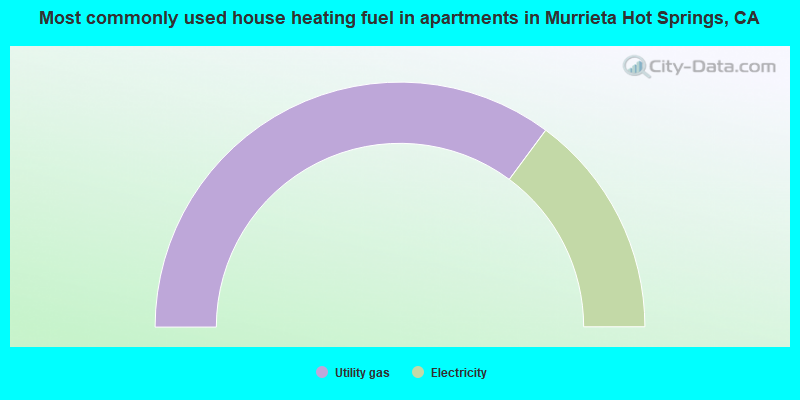
| This place: | 57.4% |
| Whole state: | 69.4% |
| This place: | 2.7% |
| Whole state: | 5.9% |
Likely homosexual households (counted as self-reported same-sex unmarried-partner households)
- Lesbian couples: 0.1% of all households
- Gay men: 0.4% of all households
| This place: | 6.3% |
| Whole state: | 14.2% |
| This place: | 3.7% |
| Whole state: | 6.3% |
For population 15 years and over in Murrieta Hot Springs:
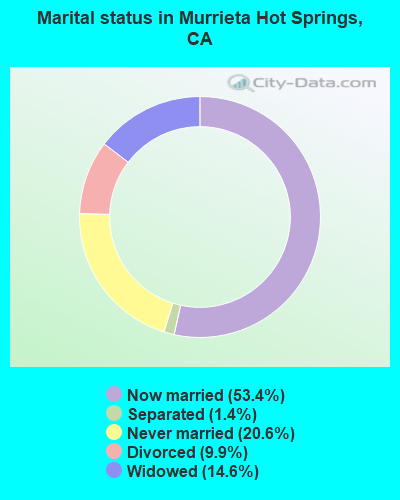
- Never married: 20.6%
- Now married: 53.4%
- Separated: 1.4%
- Widowed: 14.6%
- Divorced: 9.9%
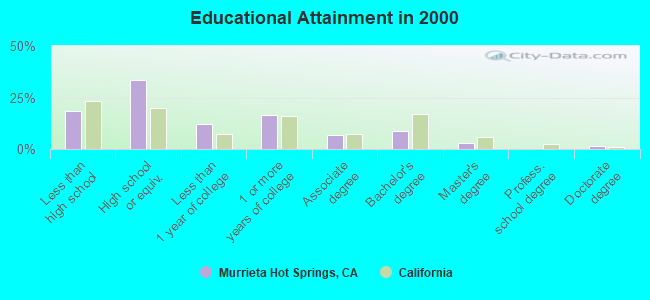
For population 25 years and over in Murrieta Hot Springs:
- High school or higher: 81.6%
- Bachelor's degree or higher: 12.8%
- Graduate or professional degree: 4.3%
- Unemployed: 16.1%
- Mean travel time to work (commute): 26.9 minutes
| Here: | 9.6 |
| California average: | 16.1 |


Graphs represent county-level data. Detailed 2008 Election Results
Religion statistics for Murrieta Hot Springs, CA (based on Riverside County data)


| Religion | Adherents | Congregations |
|---|---|---|
| Catholic | 602,765 | 51 |
| Evangelical Protestant | 240,306 | 741 |
| Other | 77,581 | 194 |
| Mainline Protestant | 29,535 | 103 |
| Black Protestant | 19,170 | 40 |
| Orthodox | 3,647 | 11 |
| None | 1,216,637 | - |
Food Environment Statistics:
| Riverside County: | 1.60 / 10,000 pop. |
| California: | 2.14 / 10,000 pop. |
| Here: | 0.05 / 10,000 pop. |
| California: | 0.04 / 10,000 pop. |
| Riverside County: | 0.44 / 10,000 pop. |
| California: | 0.62 / 10,000 pop. |
| Riverside County: | 1.51 / 10,000 pop. |
| California: | 1.49 / 10,000 pop. |
| Riverside County: | 5.45 / 10,000 pop. |
| State: | 7.42 / 10,000 pop. |
| Here: | 7.7% |
| California: | 7.3% |
| This county: | 24.5% |
| State: | 21.3% |
| Here: | 15.2% |
| State: | 17.9% |
7.19% of this county's 2021 resident taxpayers lived in other counties in 2020 ($71,521 average adjusted gross income)
| Here: | 7.19% |
| California average: | 5.19% |
0.03% of residents moved from foreign countries ($210 average AGI)
Riverside County: 0.03% California average: 0.03%
Top counties from which taxpayers relocated into this county between 2020 and 2021:
| from Los Angeles County, CA | |
| from San Bernardino County, CA | |
| from Orange County, CA |
6.28% of this county's 2020 resident taxpayers moved to other counties in 2021 ($64,593 average adjusted gross income)
| Here: | 6.28% |
| California average: | 6.14% |
0.02% of residents moved to foreign countries ($200 average AGI)
Riverside County: 0.02% California average: 0.02%
Top counties to which taxpayers relocated from this county between 2020 and 2021:
| to San Bernardino County, CA | |
| to Los Angeles County, CA | |
| to Orange County, CA |
Strongest AM radio stations in Murrieta Hot Springs:
- KPLS (830 AM; 50 kW; ORANGE, CA; Owner: CRN LICENSES, LLC)
- KFI (640 AM; 50 kW; LOS ANGELES, CA; Owner: CAPSTAR TX LIMITED PARTNERSHIP)
- KFMB (760 AM; 50 kW; SAN DIEGO, CA; Owner: MIDWEST TELEVISION, INC.)
- KLAC (570 AM; 50 kW; LOS ANGELES, CA; Owner: AMFM RADIO LICENSES, L.L.C.)
- KCBQ (1170 AM; 50 kW; SAN DIEGO, CA; Owner: RADIO 1210, INC.)
- KTNQ (1020 AM; 50 kW; LOS ANGELES, CA; Owner: KTNQ-AM LICENSE CORP.)
- KPRZ (1210 AM; 20 kW; SAN MARCOS, CA; Owner: RADIO 1210, INC.)
- KXTA (1150 AM; 50 kW; LOS ANGELES, CA; Owner: CITICASTERS LICENSES, L.P.)
- KDIS (1110 AM; 50 kW; PASADENA, CA; Owner: ABC,INC.)
- KFWB (980 AM; 50 kW; LOS ANGELES, CA; Owner: INFINITY BROADCASTING OPERATIONS, INC.)
- KSPN (710 AM; 50 kW; LOS ANGELES, CA; Owner: KABC-AM RADIO, INC.)
- KNX (1070 AM; 50 kW; LOS ANGELES, CA; Owner: INFINITY BROADCASTING OPERATIONS, INC.)
- KMPC (1540 AM; 50 kW; LOS ANGELES, CA; Owner: ROSE CITY RADIO CORPORATION)
Strongest FM radio stations in Murrieta Hot Springs:
- KRTM (88.9 FM; TEMECULA, CA; Owner: PENFOLD COMMUNICATIONS, INC.)
- KXFG (92.9 FM; SUN CITY, CA; Owner: INFINITY RADIO OPERATIONS INC.)
- KGBB (103.3 FM; TEMECULA, CA; Owner: CLEAR CHANNEL BROADCASTING LICENSES, INC.)
- KMYT (94.5 FM; TEMECULA, CA; Owner: CLEAR CHANNEL BROADCASTING LICENSES, INC.)
- KWVE (107.9 FM; SAN CLEMENTE, CA; Owner: CALVARY CHAPEL OF COSTA MESA)
- K252BF (98.3 FM; TEMECULA, CA; Owner: ENTRAVISION HOLDINGS, LLC)
- KLRD (90.1 FM; YUCAIPA, CA; Owner: EDUCATIONAL MEDIA FOUNDATION)
- KXRS (105.7 FM; HEMET, CA; Owner: LAZER BROADCASTING CORPORATION)
- KWRP (96.1 FM; SAN JACINTO, CA; Owner: MAGIC BROADCASTING, INC.)
- KUOR-FM (89.1 FM; REDLANDS, CA; Owner: UNIVERSITY OF REDLANDS)
- KPLM-FM2 (106.1 FM; SAN JACINTO, CA; Owner: RM BROADCASTING L.L.C.)
- KATY-FM (101.3 FM; IDYLLWILD, CA; Owner: ALL PRO BROADCASTING, INC.)
- K201AR (88.1 FM; BANNING, CA; Owner: KSGN, INC.)
- K232CX (94.3 FM; DESERT HOT SPRINGS, CA; Owner: MCC RADIO, LLC)
- KOLA (99.9 FM; SAN BERNARDINO, CA; Owner: INLAND EMPIRE BROADCASTING CORP.)
- KVCR (91.9 FM; SAN BERNARDINO, CA; Owner: SAN BERNARDINO COMMUNITY COLLEGE DISTRICT)
- KUCR (88.3 FM; RIVERSIDE, CA; Owner: THE REGENTS OF THE UNIV. OF CA)
- KLVJ (100.1 FM; JULIAN, CA; Owner: EDUCATIONAL MEDIA FOUNDATION)
- KCXX (103.9 FM; LAKE ARROWHEAD, CA; Owner: ALL-PRO BROADCASTING, INC.)
- K295AI (106.9 FM; MUSCOY, CA; Owner: ASSOCIATION FOR COMMUNITY EDUCATION, INC.)
TV broadcast stations around Murrieta Hot Springs:
- K47FL (Channel 47; FALLBROOK, CA; Owner: CHANNEL 51 OF SAN DIEGO, INC.)
- KDIG-LP (Channel 67; ENCINITAS, CA; Owner: STEPHEN M. CILURZO tr/as BRIMARC BROADCASTING)
FCC Registered Amateur Radio Licenses:
2- Call Sign: KF6NWS, Grant Date: 10/14/1997, Expiration Date: 10/14/2007, Cancellation Date: 10/15/2009, Registrant: Norah S Zarow, 38093 Via La Colina, Murrieta Hot Springs, CA 92563
- Call Sign: KF6NWT, Licensee ID: L00409755, Grant Date: 10/14/1997, Expiration Date: 10/14/2007, Cancellation Date: 10/15/2009, Certifier: Merle C Zarow, Registrant: Merle C Zarow, 38093 Via La Colina, Murrieta Hot Springs, CA 92563
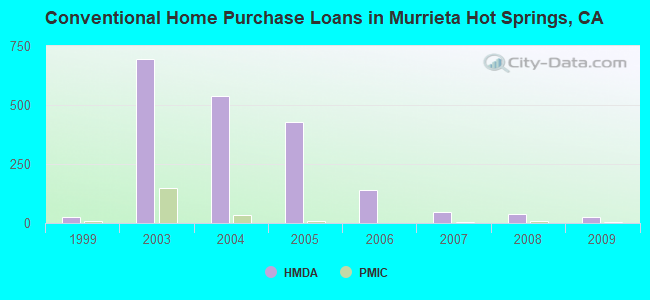
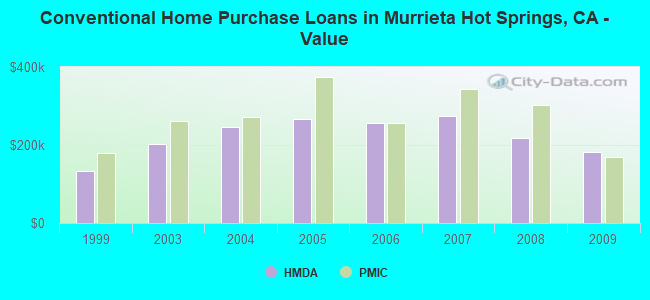
| Home Mortgage Disclosure Act Aggregated Statistics For Year 2009 (Based on 1 partial tract) | ||||||||||||
| A) FHA, FSA/RHS & VA Home Purchase Loans | B) Conventional Home Purchase Loans | C) Refinancings | D) Home Improvement Loans | F) Non-occupant Loans on < 5 Family Dwellings (A B C & D) | G) Loans On Manufactured Home Dwelling (A B C & D) | |||||||
|---|---|---|---|---|---|---|---|---|---|---|---|---|
| Number | Average Value | Number | Average Value | Number | Average Value | Number | Average Value | Number | Average Value | Number | Average Value | |
| LOANS ORIGINATED | 38 | $223,049 | 24 | $182,513 | 44 | $217,784 | 2 | $57,570 | 9 | $164,994 | 10 | $129,631 |
| APPLICATIONS APPROVED, NOT ACCEPTED | 4 | $212,925 | 1 | $41,120 | 7 | $211,769 | 0 | $0 | 1 | $41,120 | 1 | $134,150 |
| APPLICATIONS DENIED | 5 | $181,956 | 7 | $134,961 | 20 | $240,784 | 1 | $14,390 | 5 | $161,396 | 4 | $74,015 |
| APPLICATIONS WITHDRAWN | 8 | $217,294 | 2 | $184,010 | 16 | $196,091 | 1 | $12,850 | 2 | $106,910 | 2 | $94,320 |
| FILES CLOSED FOR INCOMPLETENESS | 0 | $0 | 1 | $276,020 | 4 | $226,675 | 0 | $0 | 0 | $0 | 0 | $0 |
Detailed HMDA statistics for the following Tracts: 0432.12
| Private Mortgage Insurance Companies Aggregated Statistics For Year 2009 (Based on 1 partial tract) | ||||||||
| A) Conventional Home Purchase Loans | B) Refinancings | C) Non-occupant Loans on < 5 Family Dwellings (A & B) | D) Loans On Manufactured Home Dwelling (A & B) | |||||
|---|---|---|---|---|---|---|---|---|
| Number | Average Value | Number | Average Value | Number | Average Value | Number | Average Value | |
| LOANS ORIGINATED | 3 | $168,763 | 2 | $219,220 | 1 | $103,830 | 0 | $0 |
| APPLICATIONS APPROVED, NOT ACCEPTED | 2 | $122,075 | 0 | $0 | 1 | $65,790 | 1 | $65,790 |
| APPLICATIONS DENIED | 2 | $191,210 | 0 | $0 | 0 | $0 | 0 | $0 |
| APPLICATIONS WITHDRAWN | 0 | $0 | 0 | $0 | 0 | $0 | 0 | $0 |
| FILES CLOSED FOR INCOMPLETENESS | 1 | $127,470 | 0 | $0 | 0 | $0 | 0 | $0 |
Detailed PMIC statistics for the following Tracts: 0432.12
Murrieta Hot Springs compared to California state average:
- Median household income below state average.
- Median house value below state average.
- Black race population percentage significantly below state average.
- Hispanic race population percentage significantly below state average.
- Median age significantly above state average.
- Foreign-born population percentage significantly below state average.
- Renting percentage significantly below state average.
- Length of stay since moving in significantly above state average.
- Number of rooms per house significantly below state average.
- House age significantly below state average.
- Number of college students above state average.
- Percentage of population with a bachelor's degree or higher below state average.
Murrieta Hot Springs on our top lists:
- #59 on the list of "Top 101 cities with the largest percentage of mobile homes (200+ housing units)"
- #3 on the list of "Top 101 counties with the highest lead air pollution readings in 2012 (µg/m3)"
- #4 on the list of "Top 101 counties with the highest ground withdrawal of fresh water for public supply"
- #11 on the list of "Top 101 counties with the most Catholic adherents"
- #11 on the list of "Top 101 counties with the highest total withdrawal of fresh water for public supply"
- #12 on the list of "Top 101 counties with the highest carbon monoxide air pollution readings in 2012 (ppm)"