Lost Creek, West Virginia
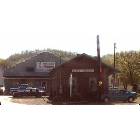
Submit your own pictures of this town and show them to the world
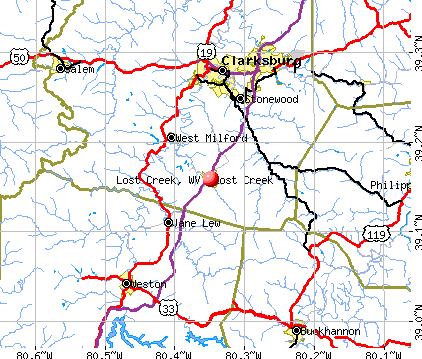
- OSM Map
- General Map
- Google Map
- MSN Map
Population change since 2000: -24.4%
 |
| Males: 137 | |
| Females: 216 |
| Median resident age: | 39.7 years |
| West Virginia median age: | 42.9 years |
Zip codes: 26385.
| Lost Creek: | $57,443 |
| WV: | $54,329 |
Estimated per capita income in 2022: $32,669 (it was $15,711 in 2000)
Lost Creek town income, earnings, and wages data
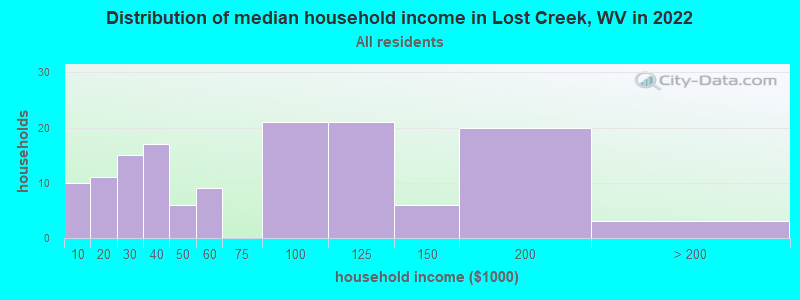
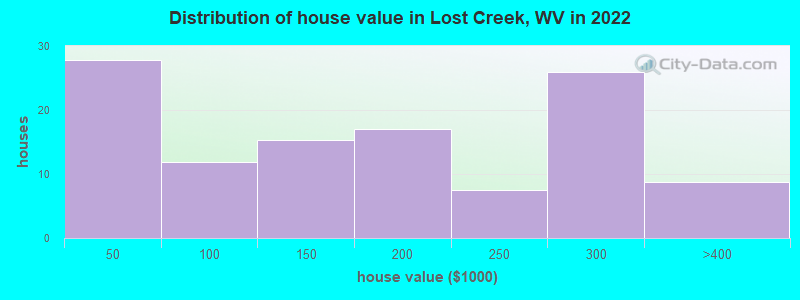
Estimated median house or condo value in 2022: $134,955 (it was $54,200 in 2000)
| Lost Creek: | $134,955 |
| WV: | $155,100 |
Mean prices in 2022: all housing units: $141,515; detached houses: $162,742; mobile homes: $31,308
Detailed information about poverty and poor residents in Lost Creek, WV
Compare current foreclosures near Lost Creek, WV:
| Photo | Address | Area | Beds / Baths | Price | Details |
|---|---|---|---|---|---|

|
#1
Lena Ln
Lost Creek, WV 26385
|
- sq. feet
|
- baths - beds |
show details | |

|
#2
Rooting Creek Rd
Lost Creek, WV 26385
|
- sq. feet
|
- baths - beds |
show details | |

|
#3
Duck Creek Rd
Lost Creek, WV 26385
|
- sq. feet
|
- baths - beds |
show details | |

|
#4
Kimberly Way
Lost Creek, WV 26385
|
- sq. feet
|
- baths - beds |
show details | |

|
#5
Pine Ln
Weston, WV 26452
|
1,512 sq. feet
|
2 baths 3 beds |
$118,500
|
show details |

|
#6
Willow St
Weston, WV 26452
|
- sq. feet
|
1 baths 3 beds |
$43,900
|
show details |

|
#7
High St
Shinnston, WV 26431
|
1,165 sq. feet
|
1 baths 3 beds |
show details | |

|
#8
Elizabeth St
Buckhannon, WV 26201
|
- sq. feet
|
1 baths 3 beds |
show details | |

|
#9
Keith Fork Rd
Weston, WV 26452
|
1,440 sq. feet
|
1 baths 3 beds |
show details | |

|
#10
W 2nd St
Weston, WV 26452
|
1,076 sq. feet
|
1 baths 2 beds |
show details |
| Photo | Address | Area | Beds / Baths | Price | Details |
|---|---|---|---|---|---|

|
#11
George Washington Hwy
Bridgeport, WV 26330
|
2,392 sq. feet
|
1 baths 4 beds |
show details | |

|
#12
Broad St
Weston, WV 26452
|
1,304 sq. feet
|
1 baths 2 beds |
show details | |

|
#13
Briercliff Rd
Bridgeport, WV 26330
|
1,362 sq. feet
|
1 baths 3 beds |
show details | |

|
#14
Cole St
Philippi, WV 26416
|
1,344 sq. feet
|
1 baths 3 beds |
show details | |

|
#15
Pocahontas St
Buckhannon, WV 26201
|
936 sq. feet
|
1 baths 2 beds |
show details | |

|
#16
12th St
Weston, WV 26452
|
- sq. feet
|
2 baths 4 beds |
show details | |

|
#17
Tuna St
Clarksburg, WV 26301
|
- sq. feet
|
1 baths 2 beds |
show details | |

|
#18
Lang Ave
Clarksburg, WV 26301
|
956 sq. feet
|
1 baths 4 beds |
show details | |

|
#19
Heavner Grove Rd
Buckhannon, WV 26201
|
1,512 sq. feet
|
2 baths 3 beds |
show details | |

|
#20
Justamere Ln
Buckhannon, WV 26201
|
- sq. feet
|
- baths - beds |
show details |
| Photo | Address | Area | Beds / Baths | Price | Details |
|---|---|---|---|---|---|

|
#21
Indian Run Rd
Salem, WV 26426
|
- sq. feet
|
- baths - beds |
show details | |

|
#22
Broadway St
Flemington, WV 26347
|
- sq. feet
|
- baths - beds |
show details | |

|
#23
Camp Rd
Philippi, WV 26416
|
- sq. feet
|
- baths - beds |
show details | |

|
#24
Linn Hollow Rd
Shinnston, WV 26431
|
- sq. feet
|
- baths - beds |
show details | |

|
#25
Heavenly Way
Buckhannon, WV 26201
|
- sq. feet
|
- baths - beds |
show details | |

|
#26
Water St
Salem, WV 26426
|
- sq. feet
|
- baths - beds |
show details | |

|
#27
Indian Fork Rd
New Milton, WV 26411
|
- sq. feet
|
- baths - beds |
show details | |

|
#28
Benedum Dr
Shinnston, WV 26431
|
- sq. feet
|
- baths - beds |
show details | |

|
#29
Union Camp Rd
Shinnston, WV 26431
|
- sq. feet
|
- baths - beds |
show details | |

|
#30
College Hill Dr
Philippi, WV 26416
|
- sq. feet
|
- baths - beds |
show details |
| Photo | Address | Area | Beds / Baths | Price | Details |
|---|---|---|---|---|---|

|
#31
Jack Run Rd
Lumberport, WV 26386
|
- sq. feet
|
- baths - beds |
show details | |

|
#32
Meadland Rd
Bridgeport, WV 26330
|
- sq. feet
|
- baths - beds |
show details | |

|
#33
S Kanawha St
Buckhannon, WV 26201
|
- sq. feet
|
- baths - beds |
show details | |

|
#34
Hawk Crest Dr
Mount Clare, WV 26408
|
- sq. feet
|
- baths - beds |
show details | |

|
#35
Turkey Run Rd
Salem, WV 26426
|
- sq. feet
|
- baths - beds |
show details | |

|
#36
Locust Ave Apt 2
Clarksburg, WV 26301
|
- sq. feet
|
- baths - beds |
show details | |

|
#37
Buckhannon Pike
Mount Clare, WV 26408
|
- sq. feet
|
- baths - beds |
show details | |

|
#38
Robin Ln
Mount Clare, WV 26408
|
- sq. feet
|
- baths - beds |
show details | |

|
#39
Country Club Rd
Clarksburg, WV 26301
|
- sq. feet
|
- baths - beds |
show details | |

|
#40
S 5th St
Clarksburg, WV 26301
|
- sq. feet
|
- baths - beds |
show details |
| Photo | Address | Area | Beds / Baths | Price | Details |
|---|---|---|---|---|---|

|
#41
Buckhannon Ave
Clarksburg, WV 26301
|
- sq. feet
|
- baths - beds |
show details | |

|
#42
Buckhannon Run Rd
Buckhannon, WV 26201
|
- sq. feet
|
- baths - beds |
show details | |

|
#43
Pratt Ave
Clarksburg, WV 26301
|
- sq. feet
|
- baths - beds |
show details | |

|
#44
Wilsonburg Rd
Clarksburg, WV 26301
|
- sq. feet
|
- baths - beds |
show details | |

|
#45
Tupelo Ln
Bridgeport, WV 26330
|
- sq. feet
|
- baths - beds |
show details | |

|
#46
Buddys Hollow Rd
Wallace, WV 26448
|
- sq. feet
|
- baths - beds |
show details | |

|
#47
Batton Hollow Rd
Mount Clare, WV 26408
|
- sq. feet
|
- baths - beds |
show details | |

|
#48
Pecks Run Rd
Buckhannon, WV 26201
|
- sq. feet
|
- baths - beds |
show details | |

|
#49
Suds Run Rd
Mount Clare, WV 26408
|
- sq. feet
|
- baths - beds |
show details | |

|
Check over 1 million property listings on Foreclosure.com!
|
browse all offers | |||


- 37397.6%White alone
- 51.3%Hispanic
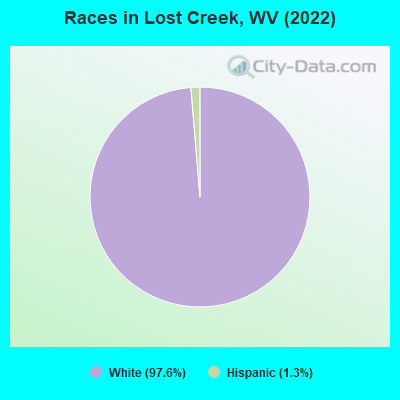
Races in Lost Creek detailed stats: ancestries, foreign born residents, place of birth
According to our research of West Virginia and other state lists, there were 7 registered sex offenders living in Lost Creek, West Virginia as of April 27, 2024.
The ratio of all residents to sex offenders in Lost Creek is 79 to 1.
 Recent articles from our blog. Our writers, many of them Ph.D. graduates or candidates, create easy-to-read articles on a wide variety of topics.

 | Possible relocation for work in Clarksburg - good schools important - 40 min top commute (9 replies) |
| Looking for a house to rent in Clarksburg area (0 replies) |
| Music, The Appalachians and West Virginia (27 replies) |
| Harpers Ferry recommendations (3 replies) |
| Newsweek: The Voters of Appalachia... (29 replies) |
| What Did you do or doing on 08/08/2008?? (10 replies) |
Latest news from Lost Creek, WV collected exclusively by city-data.com from local newspapers, TV, and radio stations
Ancestries: German (23.6%), English (16.4%), Irish (13.6%), American (10.0%), Romanian (10.0%), Polish (6.4%).
Current Local Time: EST time zone
Elevation: 1020 feet
Land area: 1.01 square miles.
Population density: 349 people per square mile (very low).
8 residents are foreign born
| This town: | 1.7% |
| West Virginia: | 1.1% |
Median real estate property taxes paid for housing units with mortgages in 2022: $1,315 (0.7%)
Median real estate property taxes paid for housing units with no mortgage in 2022: $545 (0.5%)
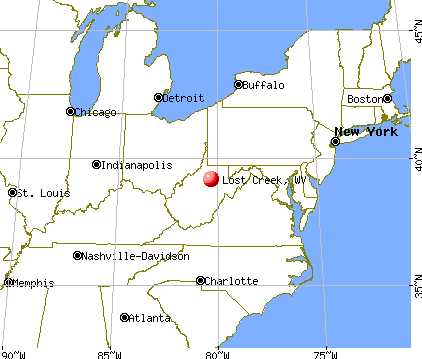
Nearest city with pop. 50,000+: Charleston, WV  (89.1 miles , pop. 53,421).
Nearest city with pop. 200,000+: Pittsburgh, PA (90.9 miles , pop. 334,563).
Nearest city with pop. 1,000,000+: Philadelphia, PA (283.4 miles , pop. 1,517,550).
Nearest cities:
), ), ), ), ), Latitude: 39.16 N, Longitude: 80.35 W
Area code commonly used in this area: 304
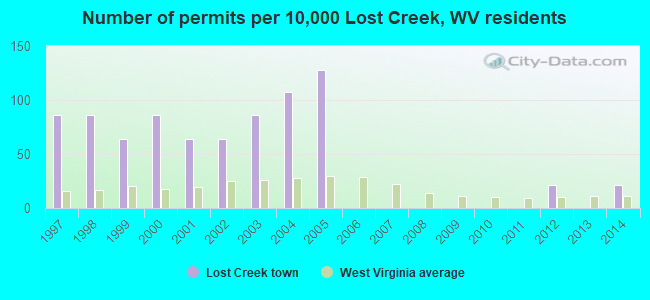
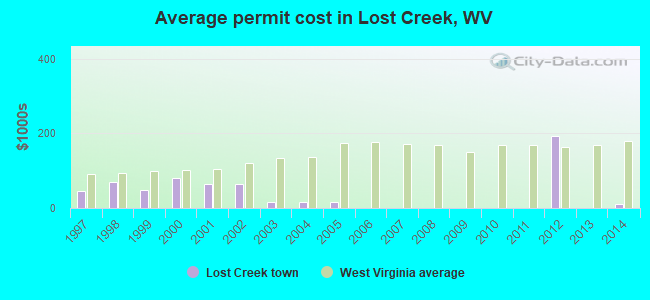
Single-family new house construction building permits:
- 2014: 1 building, cost: $12,000
- 2012: 1 building, cost: $193,000
- 2005: 6 buildings, average cost: $15,400
- 2004: 5 buildings, average cost: $15,400
- 2003: 4 buildings, average cost: $15,400
- 2002: 3 buildings, average cost: $65,000
- 2001: 3 buildings, average cost: $65,000
- 2000: 4 buildings, average cost: $81,200
- 1999: 3 buildings, average cost: $47,700
- 1998: 4 buildings, average cost: $70,000
- 1997: 4 buildings, average cost: $45,300
| Here: | 3.5% |
| West Virginia: | 4.0% |
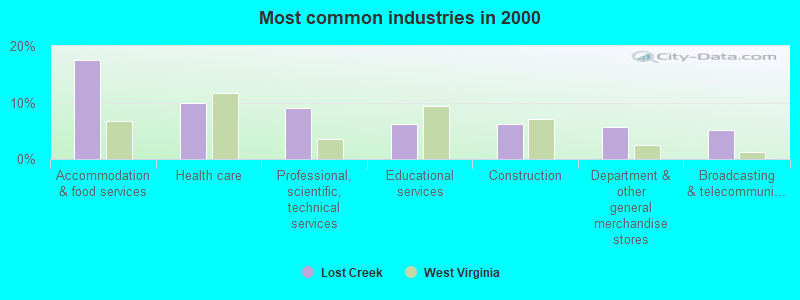
- Accommodation & food services (17.5%)
- Health care (10.0%)
- Professional, scientific, technical services (9.0%)
- Educational services (6.2%)
- Construction (6.2%)
- Department & other general merchandise stores (5.7%)
- Broadcasting & telecommunications (5.2%)
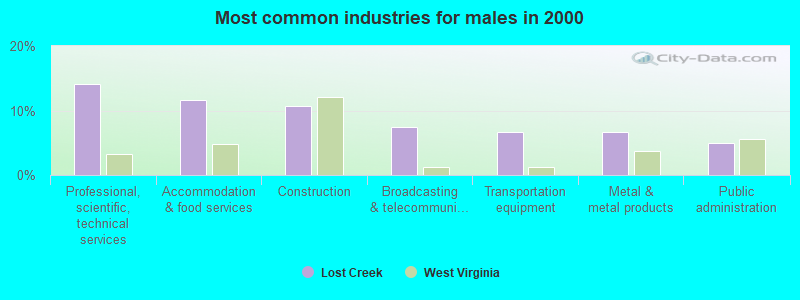
- Professional, scientific, technical services (14.0%)
- Accommodation & food services (11.6%)
- Construction (10.7%)
- Broadcasting & telecommunications (7.4%)
- Transportation equipment (6.6%)
- Metal & metal products (6.6%)
- Public administration (5.0%)
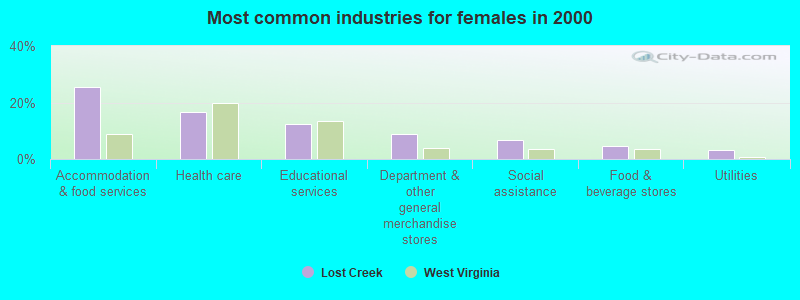
- Accommodation & food services (25.6%)
- Health care (16.7%)
- Educational services (12.2%)
- Department & other general merchandise stores (8.9%)
- Social assistance (6.7%)
- Food & beverage stores (4.4%)
- Utilities (3.3%)

- Cashiers (6.6%)
- Metal workers and plastic workers (6.6%)
- Preschool, kindergarten, elementary, and middle school teachers (4.7%)
- Cooks and food preparation workers (4.3%)
- Other food preparation and serving workers, including supervisors (4.3%)
- Other management occupations, except farmers and farm managers (3.8%)
- Driver/sales workers and truck drivers (3.8%)
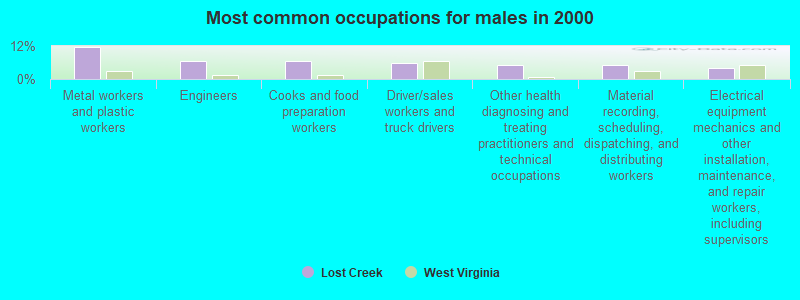
- Metal workers and plastic workers (11.6%)
- Engineers (6.6%)
- Cooks and food preparation workers (6.6%)
- Driver/sales workers and truck drivers (5.8%)
- Other health diagnosing and treating practitioners and technical occupations (5.0%)
- Material recording, scheduling, dispatching, and distributing workers (5.0%)
- Electrical equipment mechanics and other installation, maintenance, and repair workers, including supervisors (4.1%)

- Cashiers (12.2%)
- Other food preparation and serving workers, including supervisors (10.0%)
- Preschool, kindergarten, elementary, and middle school teachers (8.9%)
- Waiters and waitresses (7.8%)
- Other management occupations, except farmers and farm managers (6.7%)
- Registered nurses (5.6%)
- Customer service representatives (5.6%)
Average climate in Lost Creek, West Virginia
Based on data reported by over 4,000 weather stations


Tornado activity:
Lost Creek-area historical tornado activity is slightly below West Virginia state average. It is 73% smaller than the overall U.S. average.
On 10/1/1986, a category F3 (max. wind speeds 158-206 mph) tornado 25.1 miles away from the Lost Creek town center injured one person and caused between $50,000 and $500,000 in damages.
On 6/3/1980, a category F3 tornado 35.1 miles away from the town center injured 19 people and caused between $500,000 and $5,000,000 in damages.
Earthquake activity:
Lost Creek-area historical earthquake activity is significantly above West Virginia state average. It is 35% smaller than the overall U.S. average.On 8/23/2011 at 17:51:04, a magnitude 5.8 (5.8 MW, Depth: 3.7 mi, Class: Moderate, Intensity: VI - VII) earthquake occurred 156.5 miles away from the city center
On 9/25/1998 at 19:52:52, a magnitude 5.2 (4.8 MB, 4.3 MS, 5.2 LG, 4.5 MW, Depth: 3.1 mi) earthquake occurred 161.4 miles away from the city center
On 7/27/1980 at 18:52:21, a magnitude 5.2 (5.1 MB, 4.7 MS, 5.0 UK, 5.2 UK) earthquake occurred 205.0 miles away from the city center
On 8/9/2020 at 12:07:37, a magnitude 5.1 (5.1 MW, Depth: 4.7 mi) earthquake occurred 190.0 miles away from the city center
On 1/31/1986 at 16:46:43, a magnitude 5.0 (5.0 MB) earthquake occurred 174.3 miles away from Lost Creek center
On 8/25/2011 at 05:07:52, a magnitude 4.5 (4.5 ML, Depth: 4.2 mi, Class: Light, Intensity: IV - V) earthquake occurred 153.6 miles away from the city center
Magnitude types: regional Lg-wave magnitude (LG), body-wave magnitude (MB), local magnitude (ML), surface-wave magnitude (MS), moment magnitude (MW)
Natural disasters:
The number of natural disasters in Harrison County (21) is greater than the US average (15).Major Disasters (Presidential) Declared: 15
Emergencies Declared: 4
Causes of natural disasters: Floods: 12, Storms: 11, Landslides: 7, Mudslides: 5, Winter Storms: 4, Tornadoes: 3, Hurricanes: 2, Blizzard: 1, Snowfall: 1, Wind: 1, Other: 1 (Note: some incidents may be assigned to more than one category).

Hospitals and medical centers near Lost Creek:
- NUTTER FORT GROUP HOME (Hospital, about 8 miles away; NUTTER FORT, WV)
- HEARTLAND OF CLARKSBURG (Nursing Home, about 8 miles away; CLARKSBURG, WV)
- CLARKSBURG NURSING AND REHABILITATION CENTER, LLC (Nursing Home, about 8 miles away; CLARKSBURG, WV)
- FOWLER GROUP HOME (Hospital, about 8 miles away; CLARKSBURG, WV)
- MONTICELLO GROUP HOME (Hospital, about 9 miles away; CLARKSBURG, WV)
- ADAMSTON GROUP HOME (Hospital, about 10 miles away; CLARKSBURG, WV)
- GENTLE DIALYSIS CENTER (Dialysis Facility, about 10 miles away; BRIDGEPORT, WV)
Colleges/universities with over 2000 students nearest to Lost Creek:
- Fairmont State University (about 25 miles; Fairmont, WV; Full-time enrollment: 3,714)
- West Virginia University (about 40 miles; Morgantown, WV; FT enrollment: 27,429)
- Waynesburg University (about 52 miles; Waynesburg, PA; FT enrollment: 2,080)
- West Virginia University at Parkersburg (about 63 miles; Parkersburg, WV; FT enrollment: 2,619)
- California University of Pennsylvania (about 68 miles; California, PA; FT enrollment: 7,773)
- West Liberty University (about 71 miles; West Liberty, WV; FT enrollment: 2,728)
- Frostburg State University (about 83 miles; Frostburg, MD; FT enrollment: 4,944)
Public high school in Lost Creek:
- SOUTH HARRISON HIGH SCHOOL (Students: 408, Location: ROUTE 1, Grades: 9-12)
Public elementary/middle schools in Lost Creek:
- SOUTH HARRISON MIDDLE SCHOOL (Students: 336, Location: RT. 1 BOX 58B, Grades: 6-8)
- LOST CREEK ELEMENTARY SCHOOL (Students: 170, Location: COLLEGE STREET, Grades: PK-5)
Points of interest:
Notable location: Lost Creek Volunteer Fire Department (A). Display/hide its location on the map
Churches in Lost Creek include: Horizons Church (A), Lost Creek Methodist Church (B), Brick Seventh Day Baptist Church (C). Display/hide their locations on the map
Cemetery: Brick Church Cemetery (1). Display/hide its location on the map
Streams, rivers, and creeks: Bonds Run (A). Display/hide its location on the map
| This town: | 2.7 people |
| West Virginia: | 2.4 people |
| This town: | 75.1% |
| Whole state: | 65.8% |
| This town: | 11.9% |
| Whole state: | 6.6% |
Likely homosexual households (counted as self-reported same-sex unmarried-partner households)
- Lesbian couples: 1.6% of all households
- Gay men: 0.0% of all households
Banks with branches in Lost Creek (2011 data):
- The Harrison County Bank: at Main Street, branch established on 1911/02/01. Info updated 2006/11/03: Bank assets: $93.8 mil, Deposits: $84.2 mil, local headquarters, positive income, 5 total offices, Holding Company: Harrison Bankshares, Inc.
For population 15 years and over in Lost Creek:
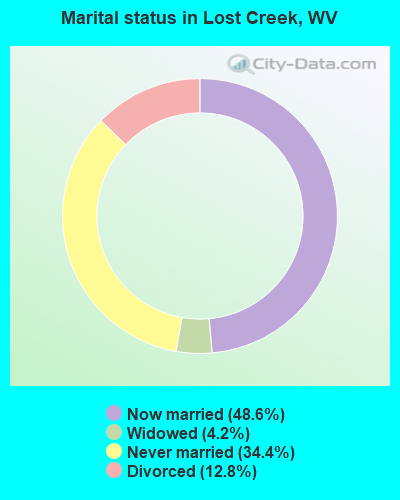
- Never married: 34.4%
- Now married: 48.6%
- Separated: 0.0%
- Widowed: 4.2%
- Divorced: 12.8%
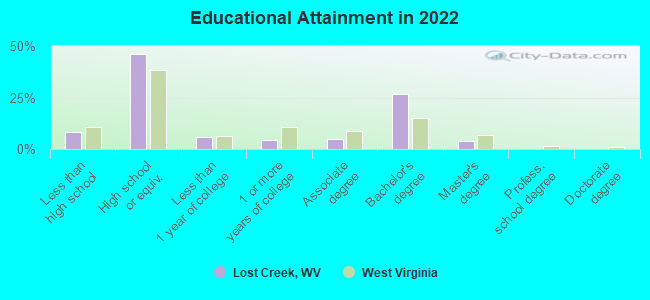
For population 25 years and over in Lost Creek:
- High school or higher: 90.2%
- Bachelor's degree or higher: 26.9%
- Graduate or professional degree: 3.4%
- Unemployed: 10.2%
- Mean travel time to work (commute): 30.5 minutes
| Here: | 9.0 |
| West Virginia average: | 11.1 |
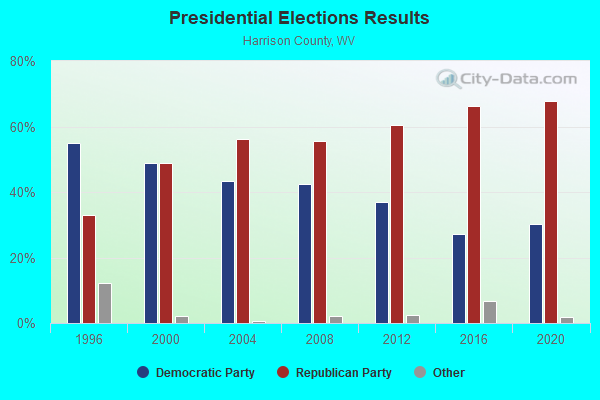
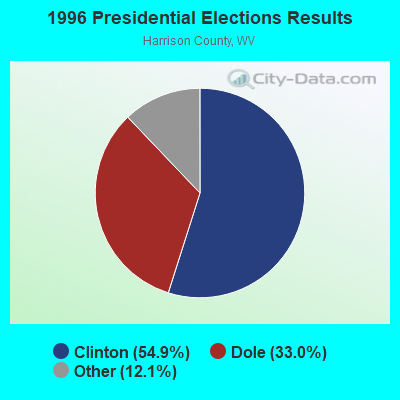
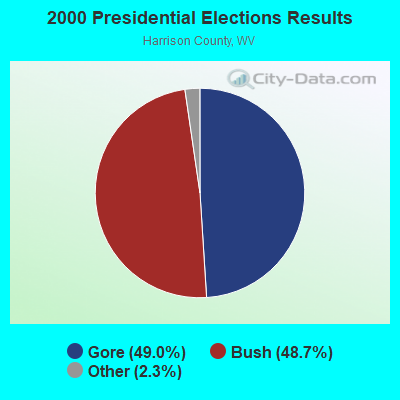
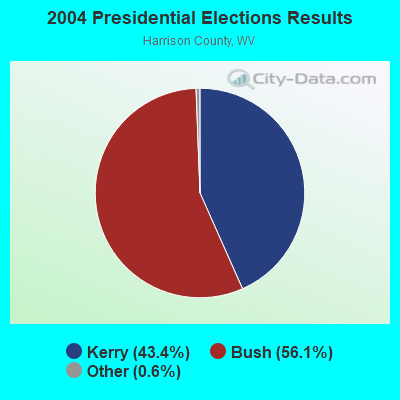
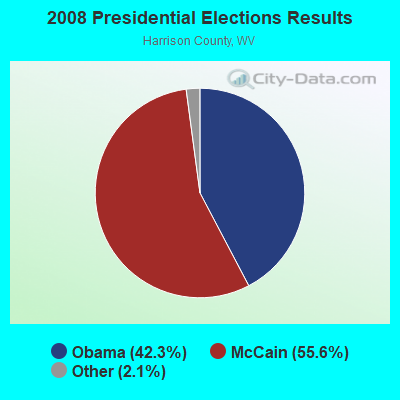
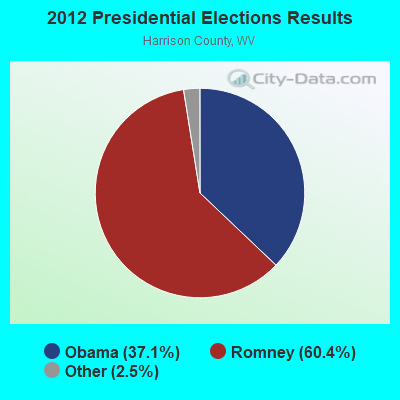


Graphs represent county-level data. Detailed 2008 Election Results
Religion statistics for Lost Creek, WV (based on Harrison County data)

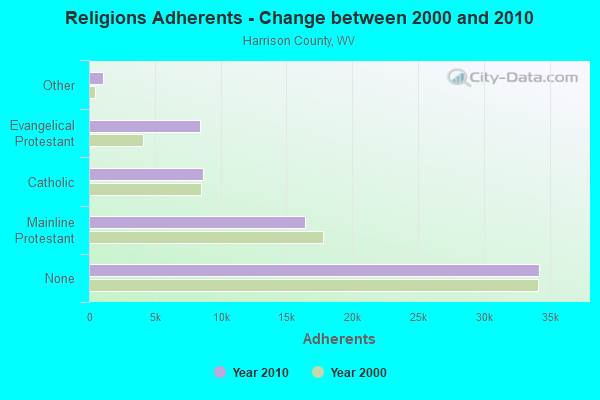
| Religion | Adherents | Congregations |
|---|---|---|
| Mainline Protestant | 16,442 | 93 |
| Catholic | 8,647 | 7 |
| Evangelical Protestant | 8,406 | 51 |
| Other | 1,069 | 4 |
| Black Protestant | 192 | 2 |
| Orthodox | 110 | 1 |
| None | 34,233 | - |
Food Environment Statistics:
| This county: | 1.90 / 10,000 pop. |
| West Virginia: | 2.41 / 10,000 pop. |
| Harrison County: | 0.29 / 10,000 pop. |
| West Virginia: | 0.28 / 10,000 pop. |
| This county: | 1.17 / 10,000 pop. |
| State: | 1.09 / 10,000 pop. |
| Harrison County: | 4.83 / 10,000 pop. |
| State: | 5.38 / 10,000 pop. |
| Here: | 8.06 / 10,000 pop. |
| State: | 6.22 / 10,000 pop. |
| Harrison County: | 14.1% |
| West Virginia: | 12.2% |
| This county: | 32.7% |
| West Virginia: | 31.1% |
| Harrison County: | 12.2% |
| West Virginia: | 13.1% |
Health and Nutrition:
| Here: | 50.0% |
| State: | 51.8% |
| Lost Creek: | 47.2% |
| West Virginia: | 49.7% |
| Lost Creek: | 29.1 |
| West Virginia: | 28.6 |
| Here: | 19.3% |
| West Virginia: | 20.4% |
| This city: | 9.2% |
| West Virginia: | 9.7% |
| Lost Creek: | 6.8 |
| West Virginia: | 6.9 |
| Lost Creek: | 36.2% |
| West Virginia: | 34.8% |
| Here: | 58.2% |
| State: | 58.4% |
| Here: | 78.2% |
| State: | 78.6% |
More about Health and Nutrition of Lost Creek, WV Residents
| Local government employment and payroll (March 2022) | |||||
| Function | Full-time employees | Monthly full-time payroll | Average yearly full-time wage | Part-time employees | Monthly part-time payroll |
|---|---|---|---|---|---|
| Judicial and Legal | 0 | $0 | 1 | $1,452 | |
| Other and Unallocable | 0 | $0 | 1 | $886 | |
| Streets and Highways | 0 | $0 | 4 | $751 | |
| Other Government Administration | 0 | $0 | 2 | $416 | |
| Totals for Government | 0 | $0 | 8 | $3,505 | |
Lost Creek government finances - Expenditure in 2017 (per resident):
- Current Operations - Regular Highways: $81,000 ($229.46)
Financial Administration: $60,000 ($169.97)
Central Staff Services: $16,000 ($45.33)
General - Other: $7,000 ($19.83)
Parks and Recreation: $4,000 ($11.33)
Libraries: $3,000 ($8.50)
Local Fire Protection: $3,000 ($8.50)
- Total Salaries and Wages: $89,000 ($252.12)
Lost Creek government finances - Revenue in 2017 (per resident):
- Miscellaneous - General Revenue - Other: $80,000 ($226.63)
Rents: $6,000 ($17.00)
- Tax - Occupation and Business License - Other: $42,000 ($118.98)
Property: $37,000 ($104.82)
Public Utilities Sales: $8,000 ($22.66)
Other License: $1,000 ($2.83)
Lost Creek government finances - Cash and Securities in 2017 (per resident):
- Other Funds - Cash and Securities: $75,000 ($212.46)
Businesses in Lost Creek, WV
- U-Haul: 1
Strongest AM radio stations in Lost Creek:
- WPDX (750 AM; daytime; 1 kW; CLARKSBURG, WV; Owner: TSCHUDY BROADCASTING CORP.)
- WBUC (1460 AM; 5 kW; BUCKHANNON, WV; Owner: CAT RADIO, INC.)
- WMMN (920 AM; 5 kW; FAIRMONT, WV; Owner: FANTASIA BROADCASTING, INC.)
- WHAW (980 AM; 1 kW; WESTON, WV; Owner: STEPHEN R. PETERS)
- WWVA (1170 AM; 53 kW; WHEELING, WV; Owner: CAPSTAR TX LIMITED PARTNERSHIP)
- WXKX (1340 AM; 1 kW; CLARKSBURG, WV; Owner: BURBACH OF DE, LLC)
- WOBG (1400 AM; 1 kW; CLARKSBURG, WV; Owner: BURBACH OF DE, LLC)
- KDKA (1020 AM; 50 kW; PITTSBURGH, PA; Owner: INFINITY BROADCASTING OPERATIONS, INC.)
- WTVN (610 AM; 50 kW; COLUMBUS, OH; Owner: CITICASTERS LICENSES, L.P.)
- WAJR (1440 AM; 5 kW; MORGANTOWN, WV; Owner: WEST VIRGINIA RADIO CORPORATION)
- WKNR (850 AM; 50 kW; CLEVELAND, OH; Owner: CARON BROADCASTING, INC.)
- WSVA (550 AM; 10 kW; HARRISONBURG, VA; Owner: M. BELMONT VERSTANDIG, INC.)
- WCBM (680 AM; 50 kW; BALTIMORE, MD; Owner: WCBM MARYLAND, INC.)
Strongest FM radio stations in Lost Creek:
- WPDX-FM (104.9 FM; CLARKSBURG, WV; Owner: TSCHUDY BROADCASTING CORP.)
- WAJR-FM (103.3 FM; SALEM, WV; Owner: WEST VIRGINIA RADIO CORPORATION OF SALEM)
- WKJL (88.1 FM; CLARKSBURG, WV; Owner: HE'S ALIVE, INC.)
- WWLW (106.5 FM; CLARKSBURG, WV; Owner: WEST VIRGINIA RADIO CORPORATION OF CLARKSBURG)
- WZWA (90.1 FM; CLARKSBURG, WV; Owner: MARANATHA BROADCASTING, INC.)
- W220BZ (91.9 FM; CLARKSBURG, WV; Owner: EDUCATIONAL MEDIA FOUNDATION)
- WFBY (102.3 FM; WESTON, WV; Owner: WEST VIRGINIA RADIO CORPORATION)
- WVPW (88.9 FM; BUCKHANNON, WV; Owner: WEST VIRGINIA EDUCATIONAL BROADCASTING AUTHORITY)
- WDCI (104.1 FM; BRIDGEPORT, WV; Owner: WDCI RADIO, INC)
- WOBG-FM (105.7 FM; SALEM, WV; Owner: BURBACH OF DE, LLC)
- WOTR (96.3 FM; LOST CREEK, WV; Owner: ALLMAN ELECTRONICS LAB)
- WGIE (92.7 FM; CLARKSBURG, WV; Owner: BURBACH OF DE, LLC)
- WDBS (97.1 FM; SUTTON, WV; Owner: SUMMIT MEDIA BROADCASTING, L.L.C.)
- WBHZ (91.9 FM; ELKINS, WV; Owner: AMERICAN FAMILY ASSOCIATION)
- WBTQ (93.5 FM; BUCKHANNON, WV; Owner: ELKINS RADIO CORPORATION)
- WBRB (101.3 FM; BUCKHANNON, WV; Owner: CAT RADIO, INC.)
- WKKW (97.9 FM; FAIRMONT, WV; Owner: DESCENDANTS TRUST, LAUREN M.KELLEY, TRUSTEE)
- WVPM (90.9 FM; MORGANTOWN, WV; Owner: WEST VIRGINIA EDUCATIONAL BROADCASTING AUTHORITY)
- WDNE-FM (98.9 FM; ELKINS, WV; Owner: WEST VIRGINIA RADIO CORPORATION OF ELKINS)
- WGYE (102.7 FM; MANNINGTON, WV; Owner: BURBACH OF DE, LLC)
TV broadcast stations around Lost Creek:
- WDTV (Channel 5; WESTON, WV; Owner: WITHERS BROADCASTING COMPANY)
- WBOY-TV (Channel 12; CLARKSBURG, WV; Owner: WEST VIRGINIA MEDIA HOLDINGS, LLC)
- WVFX (Channel 46; CLARKSBURG, WV; Owner: DAVIS TELEVISION CLARKSBURG, LLC)
- Lost Creek, West Virginia
- Fatal accident count13
- Vehicles involved in fatal accidents17
- Fatal accidents involving drunk persons:2
- Fatalities17
- Persons involved in fatal accidents28
- Pedestrians involved in fatal accidents0
- West Virginia average
- Fatal accident count3505
- Vehicles involved in fatal accidents5137
- Fatal accidents involving drunk persons1185
- Fatalities3923
- Persons involved in fatal accidents8696
- Pedestrians involved in fatal accidents196
- National Bridge Inventory (NBI) Statistics
- 30Number of bridges
- 233ft / 70.6mTotal length
- $4,897,000Total costs
- 175,868Total average daily traffic
- 33,215Total average daily truck traffic
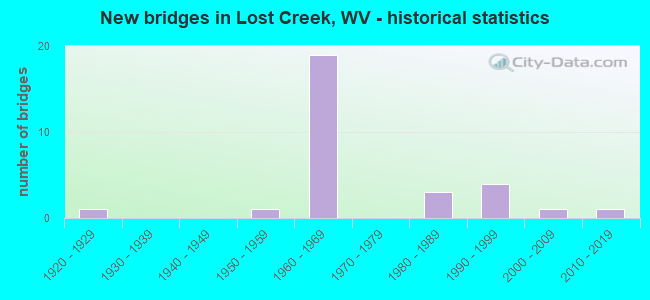
- New bridges - historical statistics
- 11920-1929
- 11950-1959
- 191960-1969
- 31980-1989
- 41990-1999
- 12000-2009
- 12010-2019
FCC Registered Cell Phone Towers:
2 (See the full list of FCC Registered Cell Phone Towers in Lost Creek)FCC Registered Antenna Towers:
33 (See the full list of FCC Registered Antenna Towers)FCC Registered Broadcast Land Mobile Towers:
4- I79 Maintenance Garage .5 Mi Ne (Lat: 39.171750 Lon: -80.343972), Call Sign: KUU445,
Assigned Frequencies: 47.2800 MHz, 47.3200 MHz, 47.3600 MHz, Grant Date: 05/23/2015, Expiration Date: 05/28/2025, Registrant: Wv Division Of Highways, Buckhannon, WV 26201, Phone: (304) 473-5337, Fax: (304) 473-4256, Email:
- JOHNSTOWN TANK, 100 Ft South Of County Route At Helen Hornick Prop (Lat: 39.125250 Lon: -80.295083), Type: Tank, Structure height: 10.7 m, Call Sign: WQCB285,
Assigned Frequencies: 154.478 MHz, Grant Date: 11/11/2014, Expiration Date: 01/21/2025, Certifier: Bill Hoover, Registrant: Federal License Management, 1784 E. 3rd Street Suite 269, Williamsport, PA 17701-3862, Phone: (866) 908-2220, Fax: (570) 322-6825, Email:
- 2500 Ft West Of Stevens Run Rd And Cr 20 (Lat: 39.160611 Lon: -80.305972), Type: Tower, Structure height: 5 m, Overall height: 6.1 m, Call Sign: WQFU467,
Assigned Frequencies: 173.203 MHz, Grant Date: 10/05/2006, Expiration Date: 10/05/2016, Cancellation Date: 12/10/2016, Certifier: William C Hoover, Registrant: Cara Enterprises, Inc., Salt Lake City, UT 84117-0503, Phone: (801) 278-9728, Fax: (801) 278-7239, Email:
- Brushy Fork Tank (Lat: 39.251139 Lon: -80.264111), Type: Tank, Structure height: 10.1 m, Overall height: 12.1 m, Call Sign: WQGN324,
Assigned Frequencies: 451.562 MHz, Grant Date: 03/07/2007, Expiration Date: 03/07/2017, Cancellation Date: 05/13/2017, Certifier: William C Hoover, Registrant: Cara Enterprises, Inc., Salt Lake City, UT 84117-0503, Phone: (801) 278-9728, Fax: (801) 278-7239, Email:
FCC Registered Microwave Towers:
6- LOST CREEK, Off Rt 270 West (Lat: 39.133611 Lon: -80.370667), Type: Gtower, Structure height: 121.9 m, Overall height: 126.7 m, Call Sign: WPJF791, Licensee ID: L00127162,
Assigned Frequencies: 6625.00 MHz, Grant Date: 01/11/2011, Expiration Date: 02/01/2021, Cancellation Date: 10/02/2015, Registrant: Hardy Cellular Telephone Company
- Lost Creek, Secondary Route 25/7 (Lat: 39.134806 Lon: -80.347583), Type: Tower, Structure height: 54.9 m, Overall height: 60.7 m, Call Sign: WPOL569, Licensee ID: L00169810,
Assigned Frequencies: 2115.20 MHz, Grant Date: 12/16/1999, Expiration Date: 12/16/2009, Cancellation Date: 03/18/2002, Certifier: Stephen J Easley, Registrant: Acc West Virginia License LLC
- FOUND CREEK, 32 Virginia Avenue (Lat: 39.153917 Lon: -80.360167), Type: Ltower, Structure height: 59.7 m, Overall height: 60.7 m, Call Sign: WQUH326,
Assigned Frequencies: 10855.0 MHz, 10815.0 MHz, 10935.0 MHz, 10895.0 MHz, Grant Date: 07/08/2014, Expiration Date: 07/08/2024, Certifier: John E Monday, Registrant: At&t Services, Inc., 208 S Akard St, 20f, Dallas, TX 75202, Phone: (855) 699-7073, Email:
- LOST CREEK, 9082 Rockford Road (Lat: 39.135278 Lon: -80.347250), Type: Ltower, Structure height: 54.9 m, Overall height: 60.4 m, Call Sign: WQUH340,
Assigned Frequencies: 11385.0 MHz, Grant Date: 07/08/2014, Expiration Date: 07/08/2024, Certifier: John E Monday, Registrant: At&t Services, Inc., 208 S Akard St, 20f, Dallas, TX 75202, Phone: (855) 699-7073, Fax: (214) 746-6410, Email:
- ROMINES MILLS, 111 Angus Road (Lat: 39.141861 Lon: -80.231972), Type: Mtower, Structure height: 59.4 m, Overall height: 60.7 m, Call Sign: WRCJ405,
Assigned Frequencies: 11055.0 MHz, 11055.0 MHz, 11055.0 MHz, 11055.0 MHz, 11055.0 MHz, 11055.0 MHz, 11055.0 MHz, 11055.0 MHz, Grant Date: 10/18/2018, Expiration Date: 10/18/2028, Certifier: Steven T Campbell, Registrant: Wilkinson Barker Knauer, LLP, 1800 M Street Nw, Suite 800n, Washington, DC 20036, Phone: (202) 383-3420, Fax: (202) 783-5851, Email:
- A4J1433A, Access Road Off Mt Clare Rd (Lat: 39.184611 Lon: -80.339111), Type: Ltower, Structure height: 45.7 m, Call Sign: WRWJ676,
Assigned Frequencies: 10755.0 MHz, 10835.0 MHz, 10755.0 MHz, 10835.0 MHz, 10755.0 MHz, 10835.0 MHz, 10755.0 MHz, 10835.0 MHz, 10755.0 MHz, 10835.0 MHz... (+20 more), Grant Date: 02/28/2023, Expiration Date: 02/28/2033, Certifier: Jenny Knopf, Registrant: T-Mobile Usa, Inc., 12920 Se 38th Street, Bellevue, WA 98006, Phone: (425) 383-8401, Fax: (425) 383-4040, Email:
FCC Registered Amateur Radio Licenses:
37 (See the full list of FCC Registered Amateur Radio Licenses in Lost Creek)FAA Registered Aircraft Manufacturers and Dealers:
1- PRICKETT JUSTIN DUANE, 35 Hidden Pond Rd, Lost Creek, WV 26385
Certificate: D007147 (Individual), Certificate Issue Date: 11/21/2019, Expiration Date: 11/20/2020
FAA Registered Aircraft:
4- Aircraft: PIPER PA-28-140 (Category: Land, Seats: 4, Weight: Up to 12,499 Pounds, Speed: 107 mph), Engine: LYCOMING 0-320 SERIES (180 HP) (Reciprocating)
N-Number: 6009W, N6009W, N-6009W, Serial Number: 28-20009, Year manufactured: 1964, Airworthiness Date: 03/17/1964, Certificate Issue Date: 02/08/2018
Registrant (Individual): Robert R Partain, 3220 Duck Creek Rd, Lost Creek, WV 26385 - Aircraft: FILER TAYLOR MONOPLANE (Category: Land, Weight: Up to 12,499 Pounds), Engine: LYCOMING 0-145A SERIES (55 HP) (Reciprocating)
N-Number: 81955, N81955, N-81955, Serial Number: RWF-1, Airworthiness Date: 07/08/1980, Certificate Issue Date: 02/05/2018
Registrant (Individual): Robert R Partain, 3220 Duck Creek Rd, Lost Creek, WV 26385
Deregistered: Cancel Date: 11/19/2014 - Aircraft: PIPER PA-22-108 (Category: Land, Seats: 2, Weight: Up to 12,499 Pounds, Speed: 94 mph), Engine: LYCOMING 0-235 SERIES (115 HP) (Reciprocating)
N-Number: 5011Z, N5011Z, N-5011Z, Serial Number: 22-8624, Year manufactured: 1961, Airworthiness Date: 06/07/1961, Certificate Issue Date: 06/13/2014
Registrant (Individual): Robert Johnson, Rr 2 Box 247b, Lost Creek, WV 26385
Deregistered: Cancel Date: 10/03/2020 - Aircraft: PIPER PA-28-180 (Category: Land, Seats: 4, Weight: Up to 12,499 Pounds, Speed: 107 mph), Engine: LYCOMING O&VO-360 SER (180 HP) (Reciprocating)
N-Number: 8385W, N8385W, N-8385W, Serial Number: 28-2588, Year manufactured: 1965, Airworthiness Date: 07/08/1965, Certificate Issue Date: 05/01/2014
Registrant (Individual): Robert J Johnson, Rr 2 Box 247b, Lost Creek, WV 26385
Deregistered: Cancel Date: 09/04/2020
2003 - 2018 National Fire Incident Reporting System (NFIRS) incidents
- Fire incident types reported to NFIRS in Lost Creek, WV
- 19851.7%Structure Fires
- 9725.3%Mobile Property/Vehicle Fires
- 7720.1%Outside Fires
- 112.9%Other
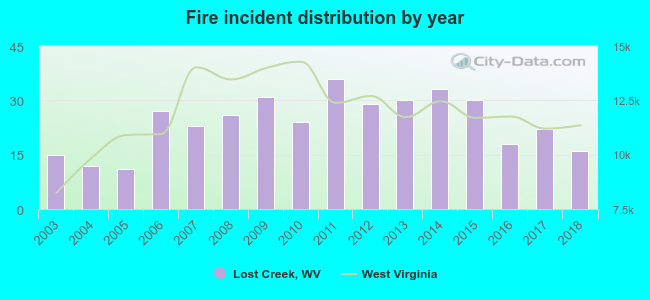 According to the data from the years 2003 - 2018 the average number of fires per year is 24. The highest number of reported fire incidents - 36 took place in 2011, and the least - 11 in 2005. The data has a growing trend.
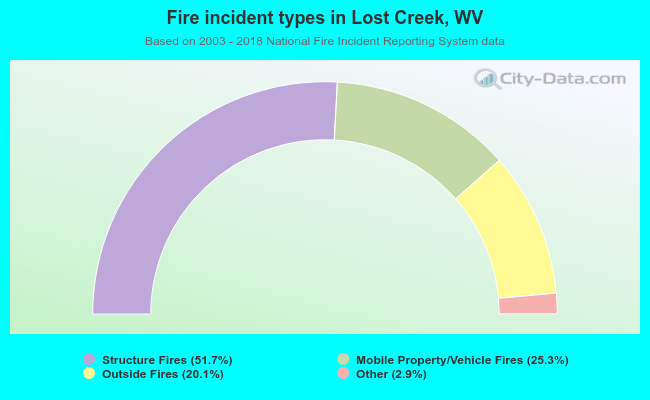 When looking into fire subcategories, the most incidents belonged to: Structure Fires (51.7%), and Mobile Property/Vehicle Fires (25.3%).
| Most common first names in Lost Creek, WV among deceased individuals | ||
| Name | Count | Lived (average) |
|---|---|---|
| William | 32 | 74.2 years |
| Mary | 25 | 76.5 years |
| John | 25 | 75.7 years |
| Robert | 22 | 72.4 years |
| James | 16 | 72.9 years |
| Charles | 14 | 75.9 years |
| Virginia | 12 | 75.8 years |
| George | 10 | 78.8 years |
| Martha | 8 | 81.1 years |
| Kenneth | 8 | 76.3 years |
| Most common last names in Lost Creek, WV among deceased individuals | ||
| Last name | Count | Lived (average) |
|---|---|---|
| Nutter | 16 | 78.0 years |
| Stutler | 15 | 79.4 years |
| Post | 11 | 88.3 years |
| Queen | 10 | 81.1 years |
| Bond | 10 | 79.8 years |
| Bise | 10 | 74.2 years |
| Randolph | 10 | 86.4 years |
| Davis | 9 | 73.9 years |
| Swisher | 9 | 82.9 years |
| Davisson | 8 | 71.1 years |
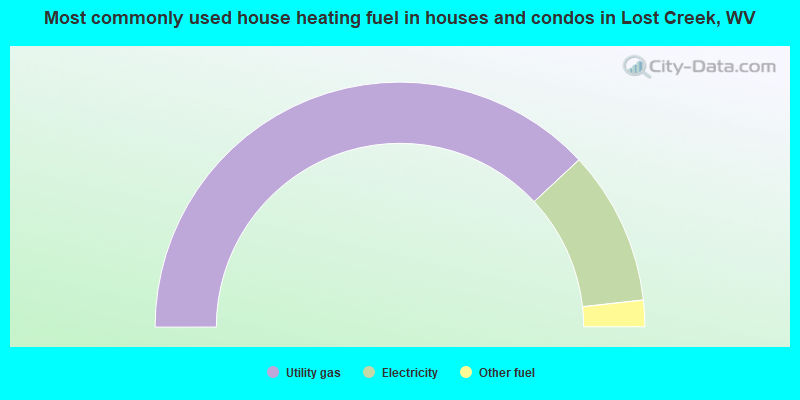
- 76.1%Utility gas
- 20.4%Electricity
- 3.5%Other fuel
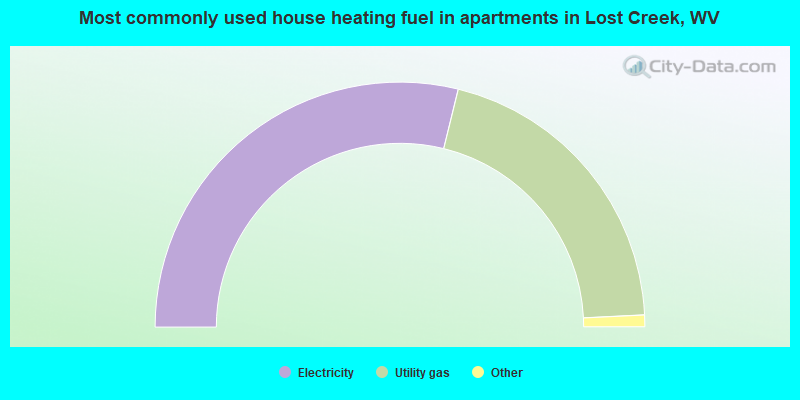
- 58.6%Electricity
- 41.4%Utility gas
Lost Creek compared to West Virginia state average:
- Black race population percentage significantly below state average.
- Hispanic race population percentage below state average.
- Median age below state average.
- Length of stay since moving in above state average.
- Number of rooms per house above state average.
- Percentage of population with a bachelor's degree or higher above state average.

|
Total of 10 patent applications in 2008-2024.