Estimated zip code population in 2022: 2,854 Zip code population in 2010: 3,872 Zip code population in 2000: 3,805
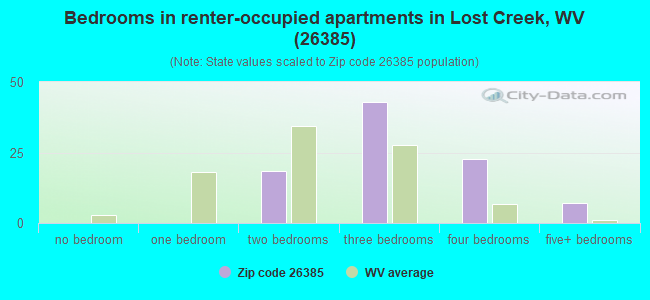
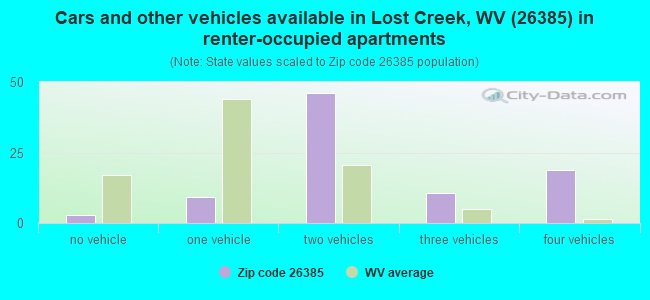
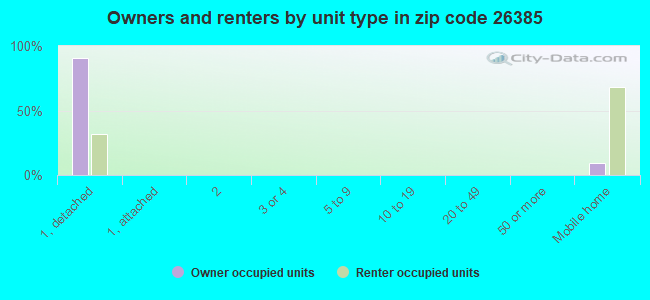
Houses and condos: 1,439 Renter-occupied apartments: 87
% of renters here:
8%
State:
26%
March 2022 cost of living index in zip code 26385: 86.0 (less than average, U.S. average is 100)
Land area: 61.6 sq. mi. Water area: 0.1 sq. mi.
Population density: 46 people per square mile
(very low).
OSM Map
General Map
Google Map
MSN Map
OSM Map
General Map
Google Map
MSN Map
OSM Map
General Map
Google Map
MSN Map
OSM Map
General Map
Google Map
MSN Map
Please wait while loading the map...
Real estate property taxes paid for housing units in 2022:
This zip code:
0.6% ($944)
West Virginia:
0.5% ($821)
Median real estate property taxes paid for housing units with mortgages in 2022: $1,092 (0.6%) Median real estate property taxes paid for housing units with no mortgage in 2022: $680 (0.6%)
Business Search- 14 Million verified businesses
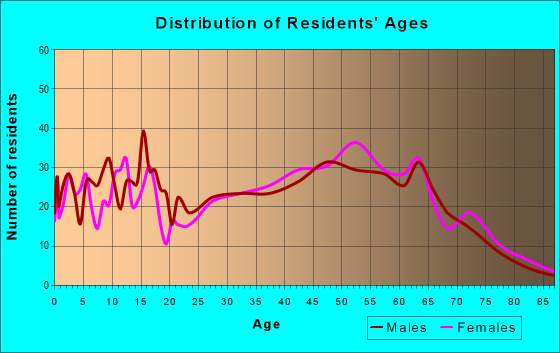
Males: 1,391
(48.7%)
Females: 1,463
(51.3%)
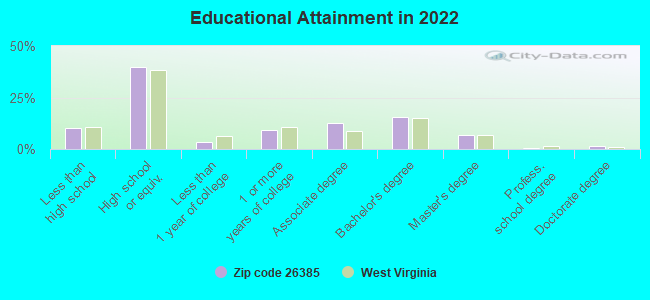
For population 25 years and over in 26385:
High school or higher: 89.7%
Bachelor's degree or higher: 24.6%
Graduate or professional degree: 8.9%
Unemployed: 3.7%
Mean travel time to work (commute): 26.0 minutes
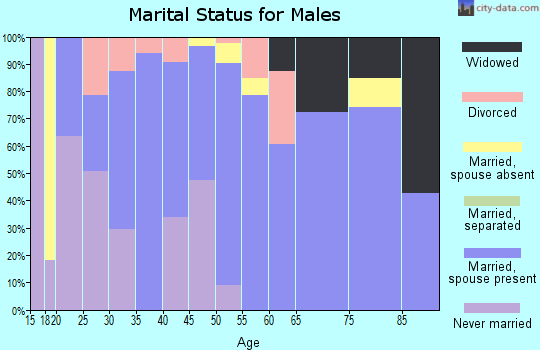
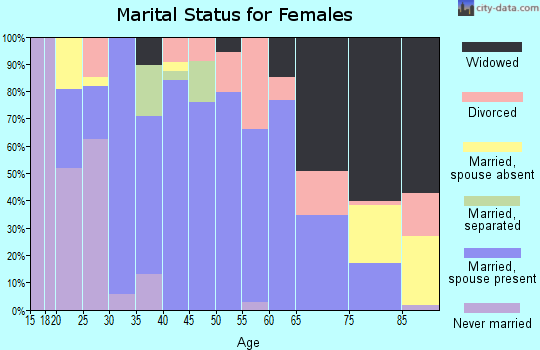
For population 15 years and over in 26385:
Never married: 34.3%
Now married: 47.3%
Separated: 1.4%
Widowed: 7.9%
Divorced: 9.1%
Zip code 26385 compared to state average:
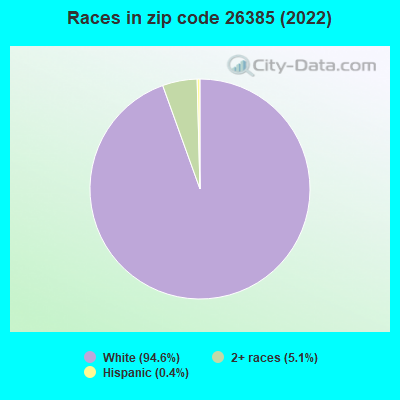
Black race population percentage significantly below state average.
Hispanic race population percentage significantly below state average.
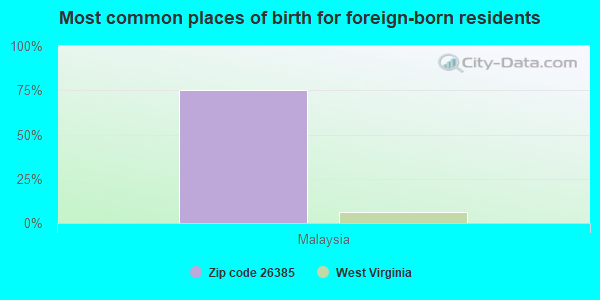
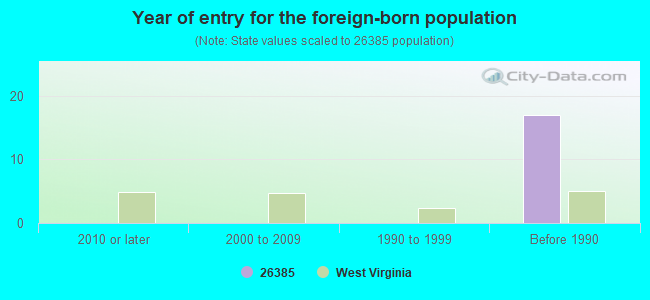
Foreign-born population percentage significantly below state average.
Renting percentage significantly below state average.
Length of stay since moving in significantly above state average.
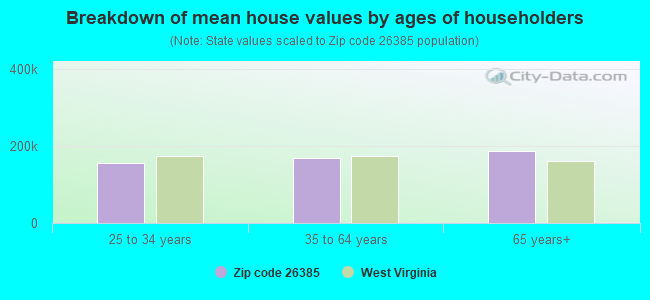
Estimated median house/condo value in 2022: $160,844
26385:
$160,844
West Virginia:
$155,100
According to our research of West Virginia and other state lists, there were 7 registered sex offenders living in 26385 zip code as of May 11, 2024. The ratio of all residents to sex offenders in zip code 26385 is 544 to 1. The ratio of registered sex offenders to all residents in this zip code is lower than the state average.
Median resident age:
This zip code:
43.7 years
West Virginia median age:
42.9 years
Average household size:
This zip code:
2.5 people
West Virginia:
2.3 people
Averages for the 2020 tax year for zip code 26385, filed in 2021:
Average Adjusted Gross Income (AGI) in 2020: $57,915 (Individual Income Tax Returns)
Here:
$57,915
State:
$56,292
Salary/wage: $52,882 (reported on 79.2% of returns)
Here:
$52,882
State:
$49,093
(% of AGI for various income ranges: 1049.0% for AGIs below $25k, 3141.5% for AGIs $25k-50k, 6438.8% for AGIs $50k-75k, 8561.2% for AGIs $75k-100k, 16372.5% for AGIs $100k-200k)
Taxable interest for individuals: $957 (reported on 28.0% of returns)
This zip code:
$957
West Virginia:
$1,141
(% of AGI for various income ranges: 10.3% for AGIs below $25k, 10.3% for AGIs $25k-50k, 75.9% for AGIs $50k-75k, 33.1% for AGIs $75k-100k, 65.6% for AGIs $100k-200k)
Ordinary dividends: $4,352 (reported on 13.7% of returns)
Here:
$4,352
State:
$5,456
(% of AGI for various income ranges: 27.9% for AGIs below $25k, 31.8% for AGIs $25k-50k, 55.3% for AGIs $50k-75k, 101.9% for AGIs $75k-100k, 331.2% for AGIs $100k-200k)
Net capital gain/loss in AGI: +$6,661 (reported on 10.7% of returns)
Here:
+$6,661
State:
+$11,656
(% of AGI for various income ranges: 7.7% for AGIs below $25k, 23.6% for AGIs $25k-50k, 36.5% for AGIs $50k-75k, 58.1% for AGIs $75k-100k, 585.0% for AGIs $100k-200k)
Profit/loss from business: +$13,530 (reported on 11.9% of returns)
Here:
+$13,530
State:
+$12,084
(% of AGI for various income ranges: 62.8% for AGIs below $25k, 19.4% for AGIs $25k-50k, 244.7% for AGIs $50k-75k, 123.8% for AGIs $75k-100k, 1114.4% for AGIs $100k-200k)
Taxable individual retirement arrangement distribution: $15,200 (reported on 8.9% of returns)
26385:
$15,200
West Virginia:
$15,311
(% of AGI for various income ranges: 64.9% for AGIs below $25k, 144.5% for AGIs $25k-50k, 230.0% for AGIs $50k-75k, 258.1% for AGIs $75k-100k, 466.2% for AGIs $100k-200k)
Total itemized deductions: $27,850 (reported on 2.4% of returns)
Here:
$27,850
State:
$31,950
(% of AGI for various income ranges: 696.2% for AGIs $100k-200k)
Charity contributions: $13,300 (reported on 1.8% of returns)
Here:
$13,300
State:
$12,364
(% of AGI for various income ranges: 249.4% for AGIs $100k-200k)
Taxes paid: $8,300 (reported on 2.4% of returns)
26385:
$8,300
State:
$7,665
(% of AGI for various income ranges: 207.5% for AGIs $100k-200k)
Earned income credit: $2,100 (reported on 13.7% of returns)
Here:
$2,100
State:
$2,258
(% of AGI for various income ranges: 84.1% for AGIs below $25k, 47.0% for AGIs $25k-50k)
Percentage of individuals using paid preparers for their 2020 taxes: 90.5%
Here:
90%
State:
93%
(% for various income ranges: 90.7% for AGIs below $25k, 92.5% for AGIs $25k-50k, 87.5% for AGIs $50k-75k, 90.5% for AGIs $75k-100k, 88.0% for AGIs $100k-200k, 100.0% for AGIs over 200k)
Averages for the 2012 tax year for zip code 26385, filed in 2013:
Average Adjusted Gross Income (AGI) in 2012: $50,055 (Individual Income Tax Returns)
Here:
$50,055
State:
$48,628
Salary/wage: $44,049 (reported on 86.9% of returns)
Here:
$44,049
State:
$42,328
(% of AGI for various income ranges: 72.8% for AGIs below $25k, 82.1% for AGIs $25k-50k, 80.3% for AGIs $50k-75k, 85.2% for AGIs $75k-100k, 91.8% for AGIs $100k-200k)
Taxable interest for individuals: $760 (reported on 30.0% of returns)
This zip code:
$760
West Virginia:
$1,211
(% of AGI for various income ranges: 0.7% for AGIs below $25k, 0.4% for AGIs $25k-50k, 0.6% for AGIs $50k-75k, 0.3% for AGIs $75k-100k, 0.6% for AGIs $100k-200k)
Ordinary dividends: $2,109 (reported on 14.4% of returns)
Here:
$2,109
State:
$4,262
(% of AGI for various income ranges: 1.6% for AGIs below $25k, 0.7% for AGIs $25k-50k, 0.7% for AGIs $50k-75k, 0.3% for AGIs $75k-100k, 0.6% for AGIs $100k-200k)
Net capital gain/loss in AGI: +$2,400 (reported on 8.8% of returns)
Here:
+$2,400
State:
+$8,875
(% of AGI for various income ranges: 0.3% for AGIs $50k-75k, 1.5% for AGIs $100k-200k)
Profit/loss from business: +$17,310 (reported on 12.5% of returns)
Here:
+$17,310
State:
+$13,636
(% of AGI for various income ranges: 4.2% for AGIs below $25k, 2.1% for AGIs $25k-50k, 1.6% for AGIs $50k-75k, 2.7% for AGIs $75k-100k, 11.1% for AGIs $100k-200k)
Taxable individual retirement arrangement distribution: $14,264 (reported on 6.9% of returns)
26385:
$14,264
West Virginia:
$11,787
(% of AGI for various income ranges: 3.0% for AGIs below $25k, 1.6% for AGIs $25k-50k, 2.1% for AGIs $50k-75k, 5.5% for AGIs $75k-100k)
Total itemized deductions: $19,152 (18% of AGI, reported on 19.4% of returns)
Here:
$19,152
State:
$21,148
Here:
18.3% of AGI
State:
18.1% of AGI
(% of AGI for various income ranges: 5.8% for AGIs $25k-50k, 6.3% for AGIs $50k-75k, 7.6% for AGIs $75k-100k, 10.8% for AGIs $100k-200k, 11.1% for AGIs over 200k)
Charity contributions: $5,225 (reported on 12.5% of returns)
Here:
$5,225
State:
$4,508
(% of AGI for various income ranges: 0.6% for AGIs $25k-50k, 1.2% for AGIs $50k-75k, 1.5% for AGIs $75k-100k, 2.7% for AGIs $100k-200k)
Taxes paid: $6,910 (reported on 19.4% of returns)
26385:
$6,910
State:
$8,103
(% of AGI for various income ranges: 0.9% for AGIs $25k-50k, 1.7% for AGIs $50k-75k, 2.6% for AGIs $75k-100k, 4.6% for AGIs $100k-200k, 6.0% for AGIs over 200k)
Earned income credit: $1,934 (reported on 18.1% of returns)
Here:
$1,934
State:
$2,140
(% of AGI for various income ranges: 5.6% for AGIs below $25k, 1.1% for AGIs $25k-50k)
Percentage of individuals using paid preparers for their 2012 taxes: 41.2%
Here:
41%
State:
49%
(% for various income ranges: 33.9% for AGIs below $25k, 40.0% for AGIs $25k-50k, 46.4% for AGIs $50k-75k, 50.0% for AGIs $75k-100k, 60.0% for AGIs $100k-200k)
Averages for the 2004 tax year for zip code 26385, filed in 2005:
Average Adjusted Gross Income (AGI) in 2004: $36,594 (Individual Income Tax Returns)
Here:
$36,594
State:
$37,498
Salary/wage: $31,926 (reported on 86.3% of returns)
Here:
$31,926
State:
$33,645
(% of AGI for various income ranges: 89.6% for AGIs below $10k, 76.6% for AGIs $10k-25k, 83.1% for AGIs $25k-50k, 86.4% for AGIs $50k-75k, 83.2% for AGIs $75k-100k, 40.5% for AGIs over 100k)
Taxable interest for individuals: $1,054 (reported on 42.4% of returns)
This zip code:
$1,054
West Virginia:
$1,465
(% of AGI for various income ranges: 3.0% for AGIs below $10k, 2.4% for AGIs $10k-25k, 1.0% for AGIs $25k-50k, 1.1% for AGIs $50k-75k, 1.2% for AGIs $75k-100k, 0.7% for AGIs over 100k)
Taxable dividends: $1,712 (reported on 19.0% of returns)
Here:
$1,712
State:
$2,913
(% of AGI for various income ranges: 1.8% for AGIs below $10k, 1.5% for AGIs $10k-25k, 0.8% for AGIs $25k-50k, 0.7% for AGIs $50k-75k, 1.1% for AGIs $75k-100k, 0.4% for AGIs over 100k)
Net capital gain/loss: +$3,794 (reported on 11.7% of returns)
Here:
+$3,794
State:
+$6,331
(% of AGI for various income ranges: -0.7% for AGIs below $10k, 0.1% for AGIs $10k-25k, 0.1% for AGIs $25k-50k, 0.7% for AGIs $50k-75k, 0.6% for AGIs $75k-100k, 5.1% for AGIs over 100k)
Profit/loss from business: +$10,723 (reported on 12.2% of returns)
Here:
+$10,723
State:
+$11,074
(% of AGI for various income ranges: 2.1% for AGIs below $10k, 2.5% for AGIs $10k-25k, 1.5% for AGIs $25k-50k, 1.7% for AGIs $50k-75k, 0.0% for AGIs $75k-100k, 12.8% for AGIs over 100k)
IRA payment deduction: $1,800 (reported on 1.6% of returns)
26385:
$1,800
West Virginia:
$2,796
Total itemized deductions: $16,198 (19% of AGI, reported on 15.7% of returns)
Here:
$16,198
State:
$16,976
Here:
19.3% of AGI
State:
19.0% of AGI
(% of AGI for various income ranges: 4.2% for AGIs $10k-25k, 4.5% for AGIs $25k-50k, 6.2% for AGIs $50k-75k, 11.2% for AGIs $75k-100k, 11.1% for AGIs over 100k)
Charity contributions deductions: $3,202 (4% of AGI, reported on 13.2% of returns)
Here:
$3,202
State:
$3,529
Here:
4.1% of AGI
State:
3.7% of AGI
(% of AGI for various income ranges: 0.7% for AGIs $10k-25k, 0.6% for AGIs $25k-50k, 1.0% for AGIs $50k-75k, 2.4% for AGIs $75k-100k, 1.7% for AGIs over 100k)
Total tax: $4,128 (reported on 72.3% of returns)
26385:
$4,128
State:
$5,372
(% of AGI for various income ranges: 2.9% for AGIs below $10k, 3.6% for AGIs $10k-25k, 6.4% for AGIs $25k-50k, 8.4% for AGIs $50k-75k, 10.6% for AGIs $75k-100k, 12.5% for AGIs over 100k)
Earned income credit: $1,730 (reported on 18.5% of returns)
Here:
$1,730
State:
$1,662
Percentage of individuals using paid preparers for their 2004 taxes: 47.6%
Here:
48%
State:
55%
(% for various income ranges: 36.8% for AGIs below $10k, 47.6% for AGIs $10k-25k, 51.1% for AGIs $25k-50k, 47.4% for AGIs $50k-75k, 59.0% for AGIs $75k-100k, 66.7% for AGIs over 100k)
Household received Food Stamps/SNAP in the past 12 months: 87 Household did not receive Food Stamps/SNAP in the past 12 months: 1,044
Women who had a birth in the past 12 months: 18 (19 now married, 0 unmarried) Women who did not have a birth in the past 12 months: 649 (267 now married, 381 unmarried)
Housing units in zip code 26385 with a mortgage: 614 (63 second mortgage, 31 home equity loan, 28 both second mortgage and home equity loan) Median monthly owner costs for units with a mortgage: $1,117 Median monthly owner costs for units without a mortgage: $402
Residents with income below the poverty level in 2022:
This zip code:
9.1%
Whole state:
17.9%
Residents with income below 50% of the poverty level in 2022:
This zip code:
4.8%
Whole state:
9.7%
Median number of rooms in houses and condos:
Here:
6.5
State:
6.5
Median number of rooms in apartments:
Here:
5.5
State:
4.7
Notable locations in this zip code not listed on our city pages
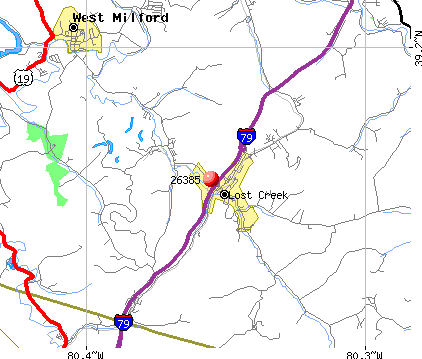
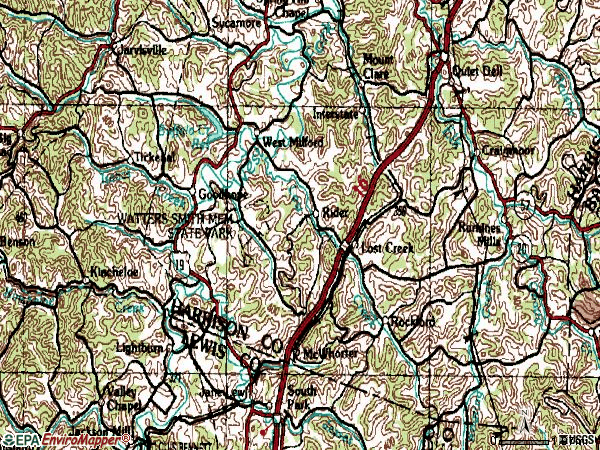
Notable locations in zip code 26385: Milford Road (A), Johnstown Volunteer Fire Department (B), Lost Creek Volunteer Fire Department (C). Display/hide their locations on the map
Churches in zip code 26385 include: Horizons Church (A), McWhorter United Methodist Church (B), Lost Creek Methodist Church (C), Johnstown United Methodist Church (D), Isaacs Creek Baptist Church (E), Gnatty Creek Presbyterian Church (F), Brick Seventh Day Baptist Church (G), Rockford United Methodist Church (H), New Bethel United Methodist Church (I). Display/hide their locations on the map
Cemeteries: Sheets Mill Cemetery (1), Rockford Cemetery (2), Pleasant Hill Cemetery (3), Old Johnstown Cemetery (4), New Johnstown Cemetery (5), New Bethel Cemetery (6), Gnatty Creek Cemetery (7). Display/hide their locations on the map
Streams, rivers, and creeks: Stouts Run (A), Rooting Creek (B), Raccoon Creek (C), Peeltree Run (D), Lost Creek (E), Duck Creek (F), Buffalo Creek (G), Bonds Run (H). Display/hide their locations on the map
CNG DAVIS COMPRESSOR STATION (ROUTE 25 in MCWHORTER, WV)
AIR MINOR (AIRS/AFS) CRITERIA AND HAZARDOUS AIR POLLUTANT INVENTORY (Inventory of air pollution sources) Business SIC classification: NATURAL GAS TRANSMISSION Business NAICS classification: PIPELINE TRANSPORTATION OF NATURAL GAS. Alternative names: CNG - DAVIS CS
EVANS SERVICE CENTER (RT 19 SOUTH 1.5 MI. FROM WEST in LOST CREEK, WV)
Conditionally Exempt Small Quantity Generators, less than 100 kg/month of hazardous waste (Resource Conservation and Recovery Act (tracking hazardous waste)) Organizations: OPERNAME (CONTACT/OPERATOR)
, CARL EVANS (CONTACT/OWNER)
DOMINION TRANSMISSION - DAVIS STATION (RT 25 2 MI N OF JANE LEW in MC WHORTER, WV)
Conditionally Exempt Small Quantity Generators, less than 100 kg/month of hazardous waste (Resource Conservation and Recovery Act (tracking hazardous waste)) - notification Organizations: DOMINION RESOURCES INC (CONTACT/OWNER)
Alternative names: CNG TRANS CORP DAVIS STATION
Housing units lacking complete plumbing facilities: 5.6% Housing units lacking complete kitchen facilities: 5.3%
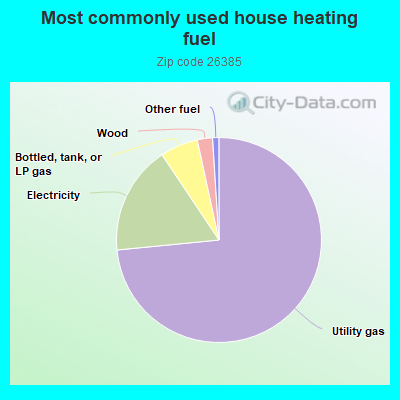
73.6%Utility gas
17.2%Electricity
6.0%Bottled, tank, or LP gas
2.4%Wood
1.0%Other fuel
Population in 1990: 3,740. Population change in the 1990s: +65 (+1.7%).
Place of birth for U.S.-born residents:
This state: 2,430
Northeast: 41
Midwest: 68
South: 204
West: 60
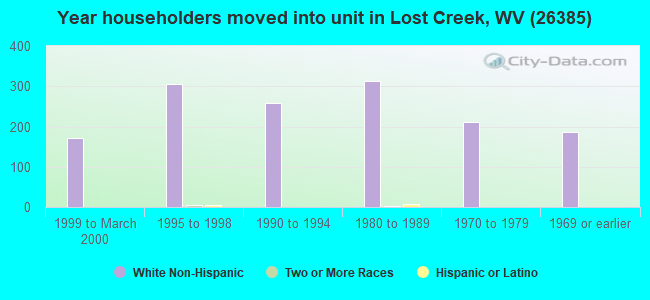
68% of the 26385 zip code residents lived in the same house 5 years ago. Out of people who lived in different houses, 65% lived in this county. Out of people who lived in different counties, 50% lived in West Virginia.
92% of the 26385 zip code residents lived in the same house 1 year ago. Out of people who lived in different houses, 49% moved from this county. Out of people who lived in different houses, 9% moved from different county within same state. Out of people who lived in different houses, 33% moved from different state. Out of people who lived in different houses, 8% moved from abroad.
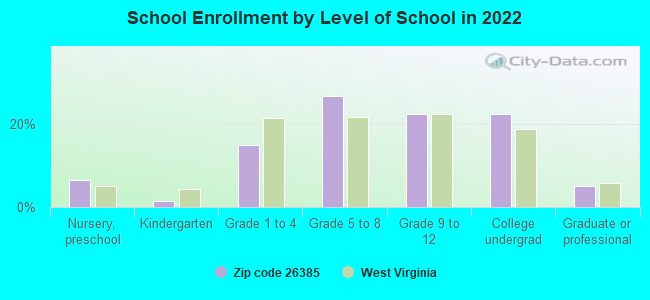
Private vs. public school enrollment:
Students in private schools in grades 1 to 8 (elementary and middle school):
Here:
0.0%
West Virginia:
12.2%
Students in private schools in grades 9 to 12 (high school): 6
Here:
6.2%
West Virginia:
8.8%
Students in private undergraduate colleges: 24
Here:
23.1%
West Virginia:
17.3%
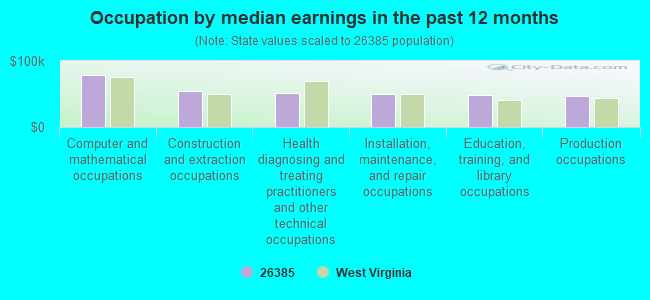
Occupation by median earnings in the past 12 months ($)
78,792Computer and mathematical occupations
54,656Construction and extraction occupations
51,731Health diagnosing and treating practitioners and other technical occupations
49,793Installation, maintenance, and repair occupations
48,293Education, training, and library occupations
46,501Production occupations
Top industries in this zip code by the number of employees in 2005:
Finance and Insurance: Commercial Banking (20-49 employees: 1 establishment)
Mining: Bituminous Coal and Lignite Surface Mining (20-49: 1)
Health Care and Social Assistance: Child Day Care Services (10-19: 1, 5-9: 1)
Other Services (except Public Administration): Religious Organizations (10-19: 1, 1-4: 3)
Construction: Painting and Wall Covering Contractors (10-19: 1, 1-4: 1)
Construction: Framing Contractors (10-19: 1)
Construction: Electrical Contractors (5-9: 1)
Construction: Masonry Contractors (5-9: 1)
Health Care and Social Assistance: Residential Mental Retardation Facilities (5-9: 1)
People in group quarters in 2010:
8 people in nursing facilities/skilled-nursing facilities
Fatal accident statistics in 2014:
Fatal accident count: 3
Vehicles involved in fatal accidents: 4
Fatal accidents caused by drunken drivers: 0
Fatalities: 3
Persons involved in fatal accidents: 5
Pedestrians involved in fatal accidents: 0
Fatal accident statistics in 2012:
Fatal accident count: 1
Vehicles involved in fatal accidents: 2
Fatal accidents caused by drunken drivers: 0
Fatalities: 1
Persons involved in fatal accidents: 5
Pedestrians involved in fatal accidents: 0
2003 - 2018 National Fire Incident Reporting System (NFIRS) incidents
Based on the data from the years 2003 - 2018 the average number of fires per year is 25. The highest number of reported fires - 36 took place in 2011, and the least - 11 in 2005. The data has a declining trend.
When looking into fire subcategories, the most reports belonged to: Structure Fires (50.4%), and Mobile Property/Vehicle Fires (26.1%).
Fire incident types reported to NFIRS in Zip Code 26385
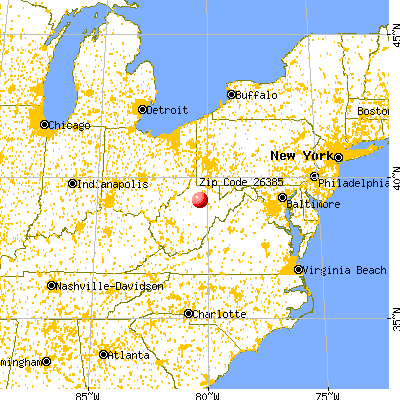


 Nearest zip codes: 26408, 26451, 26378, 26323, 26301, 26422.


 Based on the data from the years 2003 - 2018 the average number of fires per year is 25. The highest number of reported fires - 36 took place in 2011, and the least - 11 in 2005. The data has a declining trend.
 When looking into fire subcategories, the most reports belonged to: Structure Fires (50.4%), and Mobile Property/Vehicle Fires (26.1%).