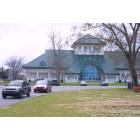
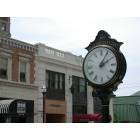
Elizabeth City, North Carolina Submit your own pictures of this city and show them to the world
OSM Map
General Map
Google Map
MSN Map
OSM Map
General Map
Google Map
MSN Map
OSM Map
General Map
Google Map
MSN Map
OSM Map
General Map
Google Map
MSN Map
Please wait while loading the map...
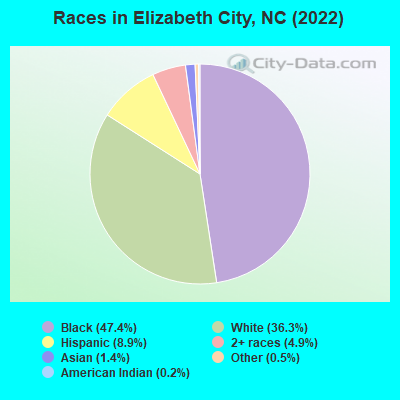
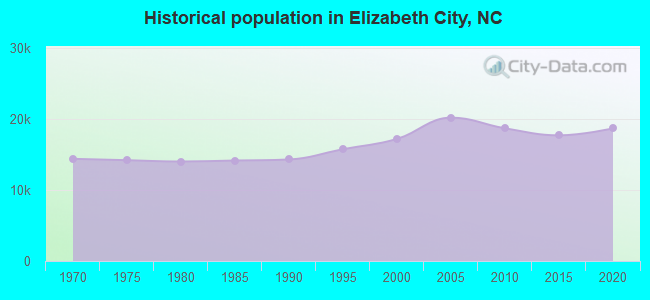
Population in 2022: 18,756 (98% urban, 2% rural). Population change since 2000: +9.1%Males: 8,516 Females: 10,240
March 2022 cost of living index in Elizabeth City: 82.5 (low, U.S. average is 100) Percentage of residents living in poverty in 2022: 19.0%for White Non-Hispanic residents , 19.7% for Black residents , 38.9% for Hispanic or Latino residents , 25.0% for American Indian residents , 100.0% for Native Hawaiian and other Pacific Islander residents , 18.6% for other race residents , 41.4% for two or more races residents )
Profiles of local businesses
Business Search - 14 Million verified businesses
Data:
Median household income ($)
Median household income (% change since 2000)
Household income diversity
Ratio of average income to average house value (%)
Ratio of average income to average rent
Median household income ($) - White
Median household income ($) - Black or African American
Median household income ($) - Asian
Median household income ($) - Hispanic or Latino
Median household income ($) - American Indian and Alaska Native
Median household income ($) - Multirace
Median household income ($) - Other Race
Median household income for houses/condos with a mortgage ($)
Median household income for apartments without a mortgage ($)
Races - White alone (%)
Races - White alone (% change since 2000)
Races - Black alone (%)
Races - Black alone (% change since 2000)
Races - American Indian alone (%)
Races - American Indian alone (% change since 2000)
Races - Asian alone (%)
Races - Asian alone (% change since 2000)
Races - Hispanic (%)
Races - Hispanic (% change since 2000)
Races - Native Hawaiian and Other Pacific Islander alone (%)
Races - Native Hawaiian and Other Pacific Islander alone (% change since 2000)
Races - Two or more races (%)
Races - Two or more races (% change since 2000)
Races - Other race alone (%)
Races - Other race alone (% change since 2000)
Racial diversity
Unemployment (%)
Unemployment (% change since 2000)
Unemployment (%) - White
Unemployment (%) - Black or African American
Unemployment (%) - Asian
Unemployment (%) - Hispanic or Latino
Unemployment (%) - American Indian and Alaska Native
Unemployment (%) - Multirace
Unemployment (%) - Other Race
Population density (people per square mile)
Population - Males (%)
Population - Females (%)
Population - Males (%) - White
Population - Males (%) - Black or African American
Population - Males (%) - Asian
Population - Males (%) - Hispanic or Latino
Population - Males (%) - American Indian and Alaska Native
Population - Males (%) - Multirace
Population - Males (%) - Other Race
Population - Females (%) - White
Population - Females (%) - Black or African American
Population - Females (%) - Asian
Population - Females (%) - Hispanic or Latino
Population - Females (%) - American Indian and Alaska Native
Population - Females (%) - Multirace
Population - Females (%) - Other Race
Coronavirus confirmed cases (May 02, 2024)
Deaths caused by coronavirus (May 02, 2024)
Coronavirus confirmed cases (per 100k population) (May 02, 2024)
Deaths caused by coronavirus (per 100k population) (May 02, 2024)
Daily increase in number of cases (May 02, 2024)
Weekly increase in number of cases (May 02, 2024)
Cases doubled (in days) (May 02, 2024)
Hospitalized patients (Apr 18, 2022)
Negative test results (Apr 18, 2022)
Total test results (Apr 18, 2022)
COVID Vaccine doses distributed (per 100k population) (Sep 19, 2023)
COVID Vaccine doses administered (per 100k population) (Sep 19, 2023)
COVID Vaccine doses distributed (Sep 19, 2023)
COVID Vaccine doses administered (Sep 19, 2023)
Likely homosexual households (%)
Likely homosexual households (% change since 2000)
Likely homosexual households - Lesbian couples (%)
Likely homosexual households - Lesbian couples (% change since 2000)
Likely homosexual households - Gay men (%)
Likely homosexual households - Gay men (% change since 2000)
Cost of living index
Median gross rent ($)
Median contract rent ($)
Median monthly housing costs ($)
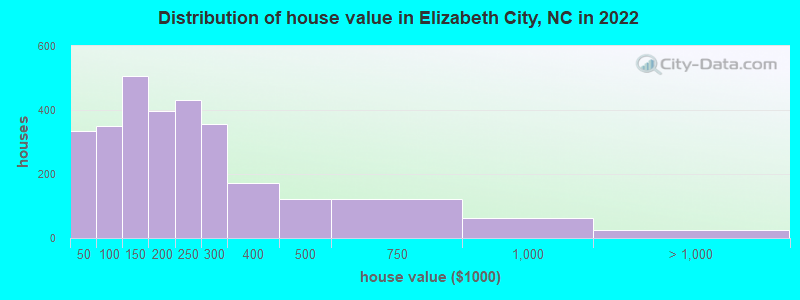
Median house or condo value ($)
Median house or condo value ($ change since 2000)
Mean house or condo value by units in structure - 1, detached ($)
Mean house or condo value by units in structure - 1, attached ($)
Mean house or condo value by units in structure - 2 ($)
Mean house or condo value by units in structure by units in structure - 3 or 4 ($)
Mean house or condo value by units in structure - 5 or more ($)
Mean house or condo value by units in structure - Boat, RV, van, etc. ($)
Mean house or condo value by units in structure - Mobile home ($)
Median house or condo value ($) - White
Median house or condo value ($) - Black or African American
Median house or condo value ($) - Asian
Median house or condo value ($) - Hispanic or Latino
Median house or condo value ($) - American Indian and Alaska Native
Median house or condo value ($) - Multirace
Median house or condo value ($) - Other Race
Median resident age
Resident age diversity
Median resident age - Males
Median resident age - Females
Median resident age - White
Median resident age - Black or African American
Median resident age - Asian
Median resident age - Hispanic or Latino
Median resident age - American Indian and Alaska Native
Median resident age - Multirace
Median resident age - Other Race
Median resident age - Males - White
Median resident age - Males - Black or African American
Median resident age - Males - Asian
Median resident age - Males - Hispanic or Latino
Median resident age - Males - American Indian and Alaska Native
Median resident age - Males - Multirace
Median resident age - Males - Other Race
Median resident age - Females - White
Median resident age - Females - Black or African American
Median resident age - Females - Asian
Median resident age - Females - Hispanic or Latino
Median resident age - Females - American Indian and Alaska Native
Median resident age - Females - Multirace
Median resident age - Females - Other Race
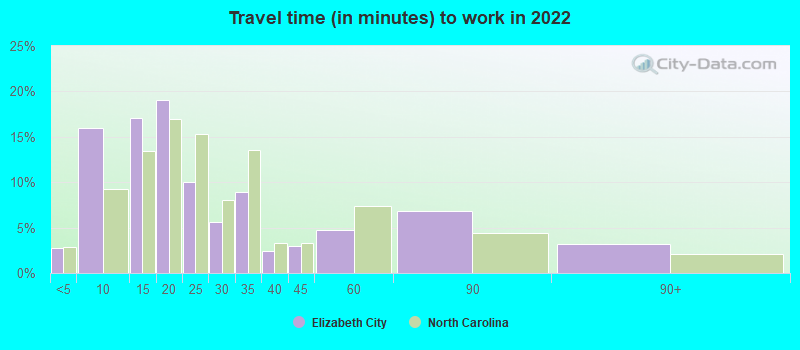
Commute - mean travel time to work (minutes)
Travel time to work - Less than 5 minutes (%)
Travel time to work - Less than 5 minutes (% change since 2000)
Travel time to work - 5 to 9 minutes (%)
Travel time to work - 5 to 9 minutes (% change since 2000)
Travel time to work - 10 to 19 minutes (%)
Travel time to work - 10 to 19 minutes (% change since 2000)
Travel time to work - 20 to 29 minutes (%)
Travel time to work - 20 to 29 minutes (% change since 2000)
Travel time to work - 30 to 39 minutes (%)
Travel time to work - 30 to 39 minutes (% change since 2000)
Travel time to work - 40 to 59 minutes (%)
Travel time to work - 40 to 59 minutes (% change since 2000)
Travel time to work - 60 to 89 minutes (%)
Travel time to work - 60 to 89 minutes (% change since 2000)
Travel time to work - 90 or more minutes (%)
Travel time to work - 90 or more minutes (% change since 2000)
Marital status - Never married (%)
Marital status - Now married (%)
Marital status - Separated (%)
Marital status - Widowed (%)
Marital status - Divorced (%)
Median family income ($)
Median family income (% change since 2000)
Median non-family income ($)
Median non-family income (% change since 2000)
Median per capita income ($)
Median per capita income (% change since 2000)
Median family income ($) - White
Median family income ($) - Black or African American
Median family income ($) - Asian
Median family income ($) - Hispanic or Latino
Median family income ($) - American Indian and Alaska Native
Median family income ($) - Multirace
Median family income ($) - Other Race
Median year house/condo built
Median year apartment built
Year house built - Built 2005 or later (%)
Year house built - Built 2000 to 2004 (%)
Year house built - Built 1990 to 1999 (%)
Year house built - Built 1980 to 1989 (%)
Year house built - Built 1970 to 1979 (%)
Year house built - Built 1960 to 1969 (%)
Year house built - Built 1950 to 1959 (%)
Year house built - Built 1940 to 1949 (%)
Year house built - Built 1939 or earlier (%)
Average household size
Household density (households per square mile)
Average household size - White
Average household size - Black or African American
Average household size - Asian
Average household size - Hispanic or Latino
Average household size - American Indian and Alaska Native
Average household size - Multirace
Average household size - Other Race
Occupied housing units (%)
Vacant housing units (%)
Owner occupied housing units (%)
Renter occupied housing units (%)
Vacancy status - For rent (%)
Vacancy status - For sale only (%)
Vacancy status - Rented or sold, not occupied (%)
Vacancy status - For seasonal, recreational, or occasional use (%)
Vacancy status - For migrant workers (%)
Vacancy status - Other vacant (%)
Residents with income below the poverty level (%)
Residents with income below 50% of the poverty level (%)
Children below poverty level (%)
Poor families by family type - Married-couple family (%)
Poor families by family type - Male, no wife present (%)
Poor families by family type - Female, no husband present (%)
Poverty status for native-born residents (%)
Poverty status for foreign-born residents (%)
Poverty among high school graduates not in families (%)
Poverty among people who did not graduate high school not in families (%)
Residents with income below the poverty level (%) - White
Residents with income below the poverty level (%) - Black or African American
Residents with income below the poverty level (%) - Asian
Residents with income below the poverty level (%) - Hispanic or Latino
Residents with income below the poverty level (%) - American Indian and Alaska Native
Residents with income below the poverty level (%) - Multirace
Residents with income below the poverty level (%) - Other Race
Air pollution - Air Quality Index (AQI)
Air pollution - CO
Air pollution - NO2
Air pollution - SO2
Air pollution - Ozone
Air pollution - PM10
Air pollution - PM25
Air pollution - Pb
Crime - Murders per 100,000 population
Crime - Rapes per 100,000 population
Crime - Robberies per 100,000 population
Crime - Assaults per 100,000 population
Crime - Burglaries per 100,000 population
Crime - Thefts per 100,000 population
Crime - Auto thefts per 100,000 population
Crime - Arson per 100,000 population
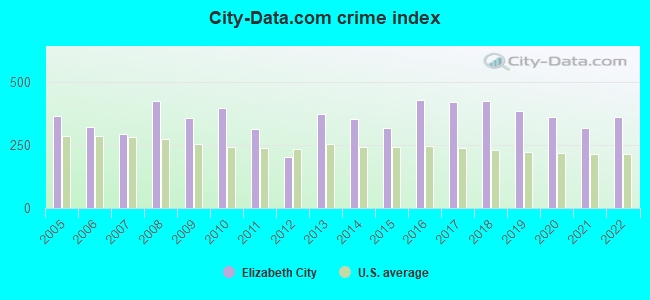
Crime - City-data.com crime index
Crime - Violent crime index
Crime - Property crime index
Crime - Murders per 100,000 population (5 year average)
Crime - Rapes per 100,000 population (5 year average)
Crime - Robberies per 100,000 population (5 year average)
Crime - Assaults per 100,000 population (5 year average)
Crime - Burglaries per 100,000 population (5 year average)
Crime - Thefts per 100,000 population (5 year average)
Crime - Auto thefts per 100,000 population (5 year average)
Crime - Arson per 100,000 population (5 year average)
Crime - City-data.com crime index (5 year average)
Crime - Violent crime index (5 year average)
Crime - Property crime index (5 year average)
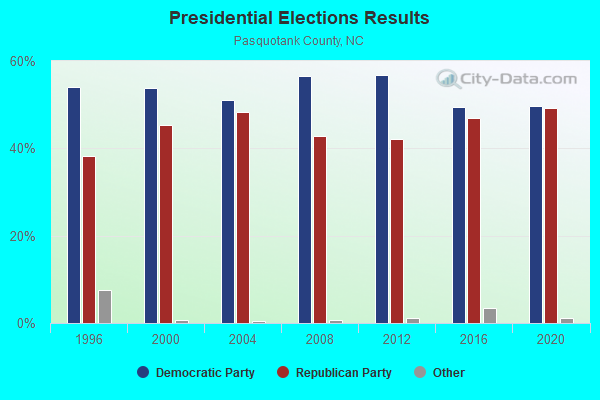
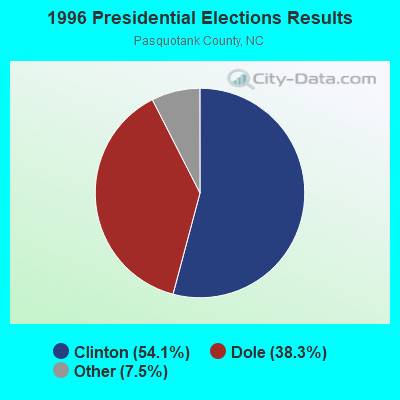
1996 Presidential Elections Results (%) - Democratic Party (Clinton)
1996 Presidential Elections Results (%) - Republican Party (Dole)
1996 Presidential Elections Results (%) - Other
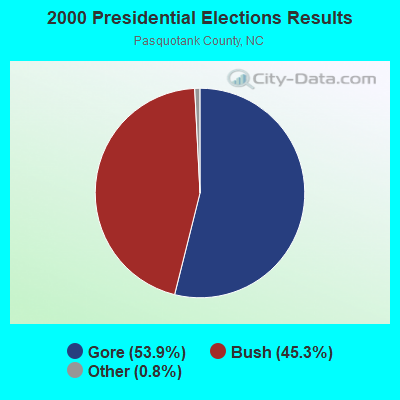
2000 Presidential Elections Results (%) - Democratic Party (Gore)
2000 Presidential Elections Results (%) - Republican Party (Bush)
2000 Presidential Elections Results (%) - Other
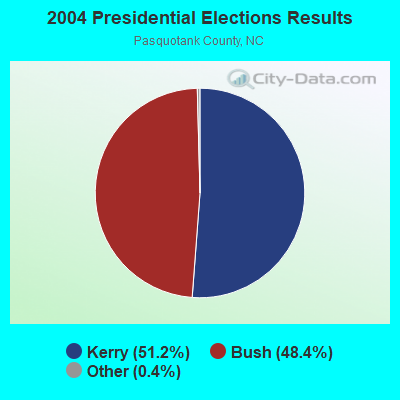
2004 Presidential Elections Results (%) - Democratic Party (Kerry)
2004 Presidential Elections Results (%) - Republican Party (Bush)
2004 Presidential Elections Results (%) - Other
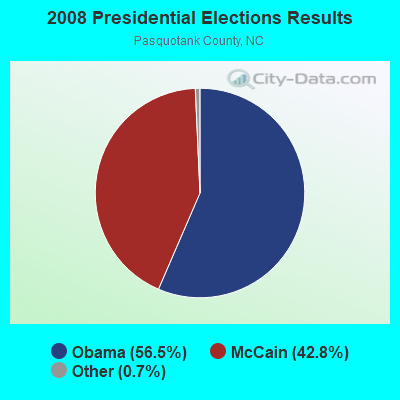
2008 Presidential Elections Results (%) - Democratic Party (Obama)
2008 Presidential Elections Results (%) - Republican Party (McCain)
2008 Presidential Elections Results (%) - Other
2012 Presidential Elections Results (%) - Democratic Party (Obama)
2012 Presidential Elections Results (%) - Republican Party (Romney)
2012 Presidential Elections Results (%) - Other
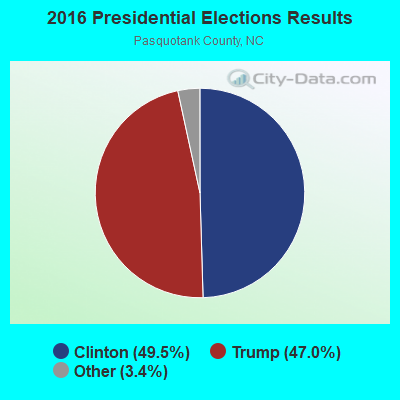
2016 Presidential Elections Results (%) - Democratic Party (Clinton)
2016 Presidential Elections Results (%) - Republican Party (Trump)
2016 Presidential Elections Results (%) - Other
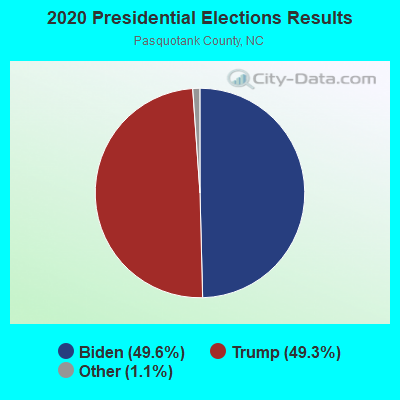
2020 Presidential Elections Results (%) - Democratic Party (Biden)
2020 Presidential Elections Results (%) - Republican Party (Trump)
2020 Presidential Elections Results (%) - Other
Ancestries Reported - Arab (%)
Ancestries Reported - Czech (%)
Ancestries Reported - Danish (%)
Ancestries Reported - Dutch (%)
Ancestries Reported - English (%)
Ancestries Reported - French (%)
Ancestries Reported - French Canadian (%)
Ancestries Reported - German (%)
Ancestries Reported - Greek (%)
Ancestries Reported - Hungarian (%)
Ancestries Reported - Irish (%)
Ancestries Reported - Italian (%)
Ancestries Reported - Lithuanian (%)
Ancestries Reported - Norwegian (%)
Ancestries Reported - Polish (%)
Ancestries Reported - Portuguese (%)
Ancestries Reported - Russian (%)
Ancestries Reported - Scotch-Irish (%)
Ancestries Reported - Scottish (%)
Ancestries Reported - Slovak (%)
Ancestries Reported - Subsaharan African (%)
Ancestries Reported - Swedish (%)
Ancestries Reported - Swiss (%)
Ancestries Reported - Ukrainian (%)
Ancestries Reported - United States (%)
Ancestries Reported - Welsh (%)
Ancestries Reported - West Indian (%)
Ancestries Reported - Other (%)
Educational Attainment - No schooling completed (%)
Educational Attainment - Less than high school (%)
Educational Attainment - High school or equivalent (%)
Educational Attainment - Less than 1 year of college (%)
Educational Attainment - 1 or more years of college (%)
Educational Attainment - Associate degree (%)
Educational Attainment - Bachelor's degree (%)
Educational Attainment - Master's degree (%)
Educational Attainment - Professional school degree (%)
Educational Attainment - Doctorate degree (%)
School Enrollment - Nursery, preschool (%)
School Enrollment - Kindergarten (%)
School Enrollment - Grade 1 to 4 (%)
School Enrollment - Grade 5 to 8 (%)
School Enrollment - Grade 9 to 12 (%)
School Enrollment - College undergrad (%)
School Enrollment - Graduate or professional (%)
School Enrollment - Not enrolled in school (%)
School enrollment - Public schools (%)
School enrollment - Private schools (%)
School enrollment - Not enrolled (%)
Median number of rooms in houses and condos
Median number of rooms in apartments
Housing units lacking complete plumbing facilities (%)
Housing units lacking complete kitchen facilities (%)
Density of houses
Urban houses (%)
Rural houses (%)
Households with people 60 years and over (%)
Households with people 65 years and over (%)
Households with people 75 years and over (%)
Households with one or more nonrelatives (%)
Households with no nonrelatives (%)
Population in households (%)
Family households (%)
Nonfamily households (%)
Population in families (%)
Family households with own children (%)
Median number of bedrooms in owner occupied houses
Mean number of bedrooms in owner occupied houses
Median number of bedrooms in renter occupied houses
Mean number of bedrooms in renter occupied houses
Median number of vehichles in owner occupied houses
Mean number of vehichles in owner occupied houses
Median number of vehichles in renter occupied houses
Mean number of vehichles in renter occupied houses
Mortgage status - with mortgage (%)
Mortgage status - with second mortgage (%)
Mortgage status - with home equity loan (%)
Mortgage status - with both second mortgage and home equity loan (%)
Mortgage status - without a mortgage (%)
Average family size
Average family size - White
Average family size - Black or African American
Average family size - Asian
Average family size - Hispanic or Latino
Average family size - American Indian and Alaska Native
Average family size - Multirace
Average family size - Other Race
Geographical mobility - Same house 1 year ago (%)
Geographical mobility - Moved within same county (%)
Geographical mobility - Moved from different county within same state (%)
Geographical mobility - Moved from different state (%)
Geographical mobility - Moved from abroad (%)
Place of birth - Born in state of residence (%)
Place of birth - Born in other state (%)
Place of birth - Native, outside of US (%)
Place of birth - Foreign born (%)
Housing units in structures - 1, detached (%)
Housing units in structures - 1, attached (%)
Housing units in structures - 2 (%)
Housing units in structures - 3 or 4 (%)
Housing units in structures - 5 to 9 (%)
Housing units in structures - 10 to 19 (%)
Housing units in structures - 20 to 49 (%)
Housing units in structures - 50 or more (%)
Housing units in structures - Mobile home (%)
Housing units in structures - Boat, RV, van, etc. (%)
House/condo owner moved in on average (years ago)
Renter moved in on average (years ago)
Year householder moved into unit - Moved in 1999 to March 2000 (%)
Year householder moved into unit - Moved in 1995 to 1998 (%)
Year householder moved into unit - Moved in 1990 to 1994 (%)
Year householder moved into unit - Moved in 1980 to 1989 (%)
Year householder moved into unit - Moved in 1970 to 1979 (%)
Year householder moved into unit - Moved in 1969 or earlier (%)
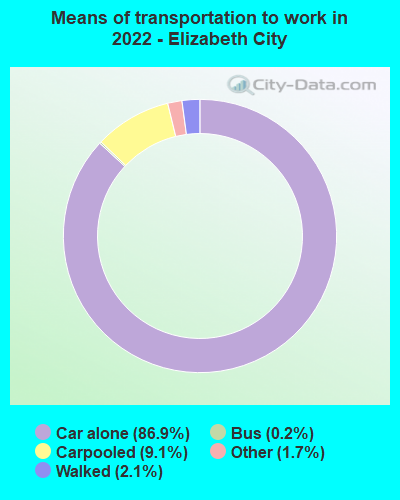
Means of transportation to work - Drove car alone (%)
Means of transportation to work - Carpooled (%)
Means of transportation to work - Public transportation (%)
Means of transportation to work - Bus or trolley bus (%)
Means of transportation to work - Streetcar or trolley car (%)
Means of transportation to work - Subway or elevated (%)
Means of transportation to work - Railroad (%)
Means of transportation to work - Ferryboat (%)
Means of transportation to work - Taxicab (%)
Means of transportation to work - Motorcycle (%)
Means of transportation to work - Bicycle (%)
Means of transportation to work - Walked (%)
Means of transportation to work - Other means (%)
Working at home (%)
Industry diversity
Most Common Industries - Agriculture, forestry, fishing and hunting, and mining (%)
Most Common Industries - Agriculture, forestry, fishing and hunting (%)
Most Common Industries - Mining, quarrying, and oil and gas extraction (%)
Most Common Industries - Construction (%)
Most Common Industries - Manufacturing (%)
Most Common Industries - Wholesale trade (%)
Most Common Industries - Retail trade (%)
Most Common Industries - Transportation and warehousing, and utilities (%)
Most Common Industries - Transportation and warehousing (%)
Most Common Industries - Utilities (%)
Most Common Industries - Information (%)
Most Common Industries - Finance and insurance, and real estate and rental and leasing (%)
Most Common Industries - Finance and insurance (%)
Most Common Industries - Real estate and rental and leasing (%)
Most Common Industries - Professional, scientific, and management, and administrative and waste management services (%)
Most Common Industries - Professional, scientific, and technical services (%)
Most Common Industries - Management of companies and enterprises (%)
Most Common Industries - Administrative and support and waste management services (%)
Most Common Industries - Educational services, and health care and social assistance (%)
Most Common Industries - Educational services (%)
Most Common Industries - Health care and social assistance (%)
Most Common Industries - Arts, entertainment, and recreation, and accommodation and food services (%)
Most Common Industries - Arts, entertainment, and recreation (%)
Most Common Industries - Accommodation and food services (%)
Most Common Industries - Other services, except public administration (%)
Most Common Industries - Public administration (%)
Occupation diversity
Most Common Occupations - Management, business, science, and arts occupations (%)
Most Common Occupations - Management, business, and financial occupations (%)
Most Common Occupations - Management occupations (%)
Most Common Occupations - Business and financial operations occupations (%)
Most Common Occupations - Computer, engineering, and science occupations (%)
Most Common Occupations - Computer and mathematical occupations (%)
Most Common Occupations - Architecture and engineering occupations (%)
Most Common Occupations - Life, physical, and social science occupations (%)
Most Common Occupations - Education, legal, community service, arts, and media occupations (%)
Most Common Occupations - Community and social service occupations (%)
Most Common Occupations - Legal occupations (%)
Most Common Occupations - Education, training, and library occupations (%)
Most Common Occupations - Arts, design, entertainment, sports, and media occupations (%)
Most Common Occupations - Healthcare practitioners and technical occupations (%)
Most Common Occupations - Health diagnosing and treating practitioners and other technical occupations (%)
Most Common Occupations - Health technologists and technicians (%)
Most Common Occupations - Service occupations (%)
Most Common Occupations - Healthcare support occupations (%)
Most Common Occupations - Protective service occupations (%)
Most Common Occupations - Fire fighting and prevention, and other protective service workers including supervisors (%)
Most Common Occupations - Law enforcement workers including supervisors (%)
Most Common Occupations - Food preparation and serving related occupations (%)
Most Common Occupations - Building and grounds cleaning and maintenance occupations (%)
Most Common Occupations - Personal care and service occupations (%)
Most Common Occupations - Sales and office occupations (%)
Most Common Occupations - Sales and related occupations (%)
Most Common Occupations - Office and administrative support occupations (%)
Most Common Occupations - Natural resources, construction, and maintenance occupations (%)
Most Common Occupations - Farming, fishing, and forestry occupations (%)
Most Common Occupations - Construction and extraction occupations (%)
Most Common Occupations - Installation, maintenance, and repair occupations (%)
Most Common Occupations - Production, transportation, and material moving occupations (%)
Most Common Occupations - Production occupations (%)
Most Common Occupations - Transportation occupations (%)
Most Common Occupations - Material moving occupations (%)
People in Group quarters - Institutionalized population (%)
People in Group quarters - Correctional institutions (%)
People in Group quarters - Federal prisons and detention centers (%)
People in Group quarters - Halfway houses (%)
People in Group quarters - Local jails and other confinement facilities (including police lockups) (%)
People in Group quarters - Military disciplinary barracks (%)
People in Group quarters - State prisons (%)
People in Group quarters - Other types of correctional institutions (%)
People in Group quarters - Nursing homes (%)
People in Group quarters - Hospitals/wards, hospices, and schools for the handicapped (%)
People in Group quarters - Hospitals/wards and hospices for chronically ill (%)
People in Group quarters - Hospices or homes for chronically ill (%)
People in Group quarters - Military hospitals or wards for chronically ill (%)
People in Group quarters - Other hospitals or wards for chronically ill (%)
People in Group quarters - Hospitals or wards for drug/alcohol abuse (%)
People in Group quarters - Mental (Psychiatric) hospitals or wards (%)
People in Group quarters - Schools, hospitals, or wards for the mentally retarded (%)
People in Group quarters - Schools, hospitals, or wards for the physically handicapped (%)
People in Group quarters - Institutions for the deaf (%)
People in Group quarters - Institutions for the blind (%)
People in Group quarters - Orthopedic wards and institutions for the physically handicapped (%)
People in Group quarters - Wards in general hospitals for patients who have no usual home elsewhere (%)
People in Group quarters - Wards in military hospitals for patients who have no usual home elsewhere (%)
People in Group quarters - Juvenile institutions (%)
People in Group quarters - Long-term care (%)
People in Group quarters - Homes for abused, dependent, and neglected children (%)
People in Group quarters - Residential treatment centers for emotionally disturbed children (%)
People in Group quarters - Training schools for juvenile delinquents (%)
People in Group quarters - Short-term care, detention or diagnostic centers for delinquent children (%)
People in Group quarters - Type of juvenile institution unknown (%)
People in Group quarters - Noninstitutionalized population (%)
People in Group quarters - College dormitories (includes college quarters off campus) (%)
People in Group quarters - Military quarters (%)
People in Group quarters - On base (%)
People in Group quarters - Barracks, unaccompanied personnel housing (UPH), (Enlisted/Officer), ;and similar group living quarters for military personnel (%)
People in Group quarters - Transient quarters for temporary residents (%)
People in Group quarters - Military ships (%)
People in Group quarters - Group homes (%)
People in Group quarters - Homes or halfway houses for drug/alcohol abuse (%)
People in Group quarters - Homes for the mentally ill (%)
People in Group quarters - Homes for the mentally retarded (%)
People in Group quarters - Homes for the physically handicapped (%)
People in Group quarters - Other group homes (%)
People in Group quarters - Religious group quarters (%)
People in Group quarters - Dormitories (%)
People in Group quarters - Agriculture workers' dormitories on farms (%)
People in Group quarters - Job Corps and vocational training facilities (%)
People in Group quarters - Other workers' dormitories (%)
People in Group quarters - Crews of maritime vessels (%)
People in Group quarters - Other nonhousehold living situations (%)
People in Group quarters - Other noninstitutional group quarters (%)
Residents speaking English at home (%)
Residents speaking English at home - Born in the United States (%)
Residents speaking English at home - Native, born elsewhere (%)
Residents speaking English at home - Foreign born (%)
Residents speaking Spanish at home (%)
Residents speaking Spanish at home - Born in the United States (%)
Residents speaking Spanish at home - Native, born elsewhere (%)
Residents speaking Spanish at home - Foreign born (%)
Residents speaking other language at home (%)
Residents speaking other language at home - Born in the United States (%)
Residents speaking other language at home - Native, born elsewhere (%)
Residents speaking other language at home - Foreign born (%)
Class of Workers - Employee of private company (%)
Class of Workers - Self-employed in own incorporated business (%)
Class of Workers - Private not-for-profit wage and salary workers (%)
Class of Workers - Local government workers (%)
Class of Workers - State government workers (%)
Class of Workers - Federal government workers (%)
Class of Workers - Self-employed workers in own not incorporated business and Unpaid family workers (%)
House heating fuel used in houses and condos - Utility gas (%)
House heating fuel used in houses and condos - Bottled, tank, or LP gas (%)
House heating fuel used in houses and condos - Electricity (%)
House heating fuel used in houses and condos - Fuel oil, kerosene, etc. (%)
House heating fuel used in houses and condos - Coal or coke (%)
House heating fuel used in houses and condos - Wood (%)
House heating fuel used in houses and condos - Solar energy (%)
House heating fuel used in houses and condos - Other fuel (%)
House heating fuel used in houses and condos - No fuel used (%)
House heating fuel used in apartments - Utility gas (%)
House heating fuel used in apartments - Bottled, tank, or LP gas (%)
House heating fuel used in apartments - Electricity (%)
House heating fuel used in apartments - Fuel oil, kerosene, etc. (%)
House heating fuel used in apartments - Coal or coke (%)
House heating fuel used in apartments - Wood (%)
House heating fuel used in apartments - Solar energy (%)
House heating fuel used in apartments - Other fuel (%)
House heating fuel used in apartments - No fuel used (%)
Armed forces status - In Armed Forces (%)
Armed forces status - Civilian (%)
Armed forces status - Civilian - Veteran (%)
Armed forces status - Civilian - Nonveteran (%)
Fatal accidents locations in years 2005-2021
Fatal accidents locations in 2005
Fatal accidents locations in 2006
Fatal accidents locations in 2007
Fatal accidents locations in 2008
Fatal accidents locations in 2009
Fatal accidents locations in 2010
Fatal accidents locations in 2011
Fatal accidents locations in 2012
Fatal accidents locations in 2013
Fatal accidents locations in 2014
Fatal accidents locations in 2015
Fatal accidents locations in 2016
Fatal accidents locations in 2017
Fatal accidents locations in 2018
Fatal accidents locations in 2019
Fatal accidents locations in 2020
Fatal accidents locations in 2021
Alcohol use - People drinking some alcohol every month (%)
Alcohol use - People not drinking at all (%)
Alcohol use - Average days/month drinking alcohol
Alcohol use - Average drinks/week
Alcohol use - Average days/year people drink much
Audiometry - Average condition of hearing (%)
Audiometry - People that can hear a whisper from across a quiet room (%)
Audiometry - People that can hear normal voice from across a quiet room (%)
Audiometry - Ears ringing, roaring, buzzing (%)
Audiometry - Had a job exposure to loud noise (%)
Audiometry - Had off-work exposure to loud noise (%)
Blood Pressure & Cholesterol - Has high blood pressure (%)
Blood Pressure & Cholesterol - Checking blood pressure at home (%)
Blood Pressure & Cholesterol - Frequently checking blood cholesterol (%)
Blood Pressure & Cholesterol - Has high cholesterol level (%)
Consumer Behavior - Money monthly spent on food at supermarket/grocery store
Consumer Behavior - Money monthly spent on food at other stores
Consumer Behavior - Money monthly spent on eating out
Consumer Behavior - Money monthly spent on carryout/delivered foods
Consumer Behavior - Income spent on food at supermarket/grocery store (%)
Consumer Behavior - Income spent on food at other stores (%)
Consumer Behavior - Income spent on eating out (%)
Consumer Behavior - Income spent on carryout/delivered foods (%)
Current Health Status - General health condition (%)
Current Health Status - Blood donors (%)
Current Health Status - Has blood ever tested for HIV virus (%)
Current Health Status - Left-handed people (%)
Dermatology - People using sunscreen (%)
Diabetes - Diabetics (%)
Diabetes - Had a blood test for high blood sugar (%)
Diabetes - People taking insulin (%)
Diet Behavior & Nutrition - Diet health (%)
Diet Behavior & Nutrition - Milk product consumption (# of products/month)
Diet Behavior & Nutrition - Meals not home prepared (#/week)
Diet Behavior & Nutrition - Meals from fast food or pizza place (#/week)
Diet Behavior & Nutrition - Ready-to-eat foods (#/month)
Diet Behavior & Nutrition - Frozen meals/pizza (#/month)
Drug Use - People that ever used marijuana or hashish (%)
Drug Use - Ever used hard drugs (%)
Drug Use - Ever used any form of cocaine (%)
Drug Use - Ever used heroin (%)
Drug Use - Ever used methamphetamine (%)
Health Insurance - People covered by health insurance (%)
Kidney Conditions-Urology - Avg. # of times urinating at night
Medical Conditions - People with asthma (%)
Medical Conditions - People with anemia (%)
Medical Conditions - People with psoriasis (%)
Medical Conditions - People with overweight (%)
Medical Conditions - Elderly people having difficulties in thinking or remembering (%)
Medical Conditions - People who ever received blood transfusion (%)
Medical Conditions - People having trouble seeing even with glass/contacts (%)
Medical Conditions - People with arthritis (%)
Medical Conditions - People with gout (%)
Medical Conditions - People with congestive heart failure (%)
Medical Conditions - People with coronary heart disease (%)
Medical Conditions - People with angina pectoris (%)
Medical Conditions - People who ever had heart attack (%)
Medical Conditions - People who ever had stroke (%)
Medical Conditions - People with emphysema (%)
Medical Conditions - People with thyroid problem (%)
Medical Conditions - People with chronic bronchitis (%)
Medical Conditions - People with any liver condition (%)
Medical Conditions - People who ever had cancer or malignancy (%)
Mental Health - People who have little interest in doing things (%)
Mental Health - People feeling down, depressed, or hopeless (%)
Mental Health - People who have trouble sleeping or sleeping too much (%)
Mental Health - People feeling tired or having little energy (%)
Mental Health - People with poor appetite or overeating (%)
Mental Health - People feeling bad about themself (%)
Mental Health - People who have trouble concentrating on things (%)
Mental Health - People moving or speaking slowly or too fast (%)
Mental Health - People having thoughts they would be better off dead (%)
Oral Health - Average years since last visit a dentist
Oral Health - People embarrassed because of mouth (%)
Oral Health - People with gum disease (%)
Oral Health - General health of teeth and gums (%)
Oral Health - Average days a week using dental floss/device
Oral Health - Average days a week using mouthwash for dental problem
Oral Health - Average number of teeth
Pesticide Use - Households using pesticides to control insects (%)
Pesticide Use - Households using pesticides to kill weeds (%)
Physical Activity - People doing vigorous-intensity work activities (%)
Physical Activity - People doing moderate-intensity work activities (%)
Physical Activity - People walking or bicycling (%)
Physical Activity - People doing vigorous-intensity recreational activities (%)
Physical Activity - People doing moderate-intensity recreational activities (%)
Physical Activity - Average hours a day doing sedentary activities
Physical Activity - Average hours a day watching TV or videos
Physical Activity - Average hours a day using computer
Physical Functioning - People having limitations keeping them from working (%)
Physical Functioning - People limited in amount of work they can do (%)
Physical Functioning - People that need special equipment to walk (%)
Physical Functioning - People experiencing confusion/memory problems (%)
Physical Functioning - People requiring special healthcare equipment (%)
Prescription Medications - Average number of prescription medicines taking
Preventive Aspirin Use - Adults 40+ taking low-dose aspirin (%)
Reproductive Health - Vaginal deliveries (%)
Reproductive Health - Cesarean deliveries (%)
Reproductive Health - Deliveries resulted in a live birth (%)
Reproductive Health - Pregnancies resulted in a delivery (%)
Reproductive Health - Women breastfeeding newborns (%)
Reproductive Health - Women that had a hysterectomy (%)
Reproductive Health - Women that had both ovaries removed (%)
Reproductive Health - Women that have ever taken birth control pills (%)
Reproductive Health - Women taking birth control pills (%)
Reproductive Health - Women that have ever used Depo-Provera or injectables (%)
Reproductive Health - Women that have ever used female hormones (%)
Sexual Behavior - People 18+ that ever had sex (vaginal, anal, or oral) (%)
Sexual Behavior - Males 18+ that ever had vaginal sex with a woman (%)
Sexual Behavior - Males 18+ that ever performed oral sex on a woman (%)
Sexual Behavior - Males 18+ that ever had anal sex with a woman (%)
Sexual Behavior - Males 18+ that ever had any sex with a man (%)
Sexual Behavior - Females 18+ that ever had vaginal sex with a man (%)
Sexual Behavior - Females 18+ that ever performed oral sex on a man (%)
Sexual Behavior - Females 18+ that ever had anal sex with a man (%)
Sexual Behavior - Females 18+ that ever had any kind of sex with a woman (%)
Sexual Behavior - Average age people first had sex
Sexual Behavior - Average number of female sex partners in lifetime (males 18+)
Sexual Behavior - Average number of female vaginal sex partners in lifetime (males 18+)
Sexual Behavior - Average age people first performed oral sex on a woman (18+)
Sexual Behavior - Average number of woman performed oral sex on in lifetime (18+)
Sexual Behavior - Average number of male sex partners in lifetime (males 18+)
Sexual Behavior - Average number of male anal sex partners in lifetime (males 18+)
Sexual Behavior - Average age people first performed oral sex on a man (18+)
Sexual Behavior - Average number of male oral sex partners in lifetime (18+)
Sexual Behavior - People using protection when performing oral sex (%)
Sexual Behavior - Average number of times people have vaginal or anal sex a year
Sexual Behavior - People having sex without condom (%)
Sexual Behavior - Average number of male sex partners in lifetime (females 18+)
Sexual Behavior - Average number of male vaginal sex partners in lifetime (females 18+)
Sexual Behavior - Average number of female sex partners in lifetime (females 18+)
Sexual Behavior - Circumcised males 18+ (%)
Sleep Disorders - Average hours sleeping at night
Sleep Disorders - People that has trouble sleeping (%)
Smoking-Cigarette Use - People smoking cigarettes (%)
Taste & Smell - People 40+ having problems with smell (%)
Taste & Smell - People 40+ having problems with taste (%)
Taste & Smell - People 40+ that ever had wisdom teeth removed (%)
Taste & Smell - People 40+ that ever had tonsils teeth removed (%)
Taste & Smell - People 40+ that ever had a loss of consciousness because of a head injury (%)
Taste & Smell - People 40+ that ever had a broken nose or other serious injury to face or skull (%)
Taste & Smell - People 40+ that ever had two or more sinus infections (%)
Weight - Average height (inches)
Weight - Average weight (pounds)
Weight - Average BMI
Weight - People that are obese (%)
Weight - People that ever were obese (%)
Weight - People trying to lose weight (%)
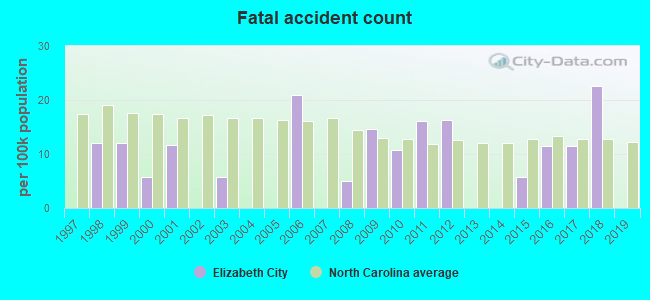
Officers per 1,000 residents here:
3.34North Carolina average:
2.27
Latest news from Elizabeth City, NC collected exclusively by city-data.com from local newspapers, TV, and radio stations
Ancestries: American (9.6%), English (6.0%), German (2.8%), Irish (2.4%), Scottish (1.2%).
Current Local Time:
Land area: 8.94 square miles.
Population density: 2,099 people per square mile (low).
626 residents are foreign born (1.6% Latin America , 1.1% Asia , 0.4% Europe ).
This city:
3.3%North Carolina:
8.3%
Median real estate property taxes paid for housing units with mortgages in 2022: $1,508 (0.8%)Median real estate property taxes paid for housing units with no mortgage in 2022: $1,597 (0.7%)
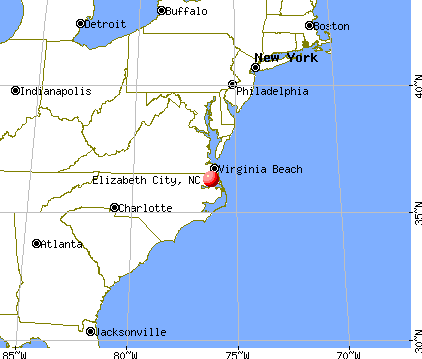
Nearest city with pop. 50,000+: Chesapeake, VA
Nearest city with pop. 200,000+: Virginia Beach, VA
Nearest city with pop. 1,000,000+: Philadelphia, PA
Nearest cities:
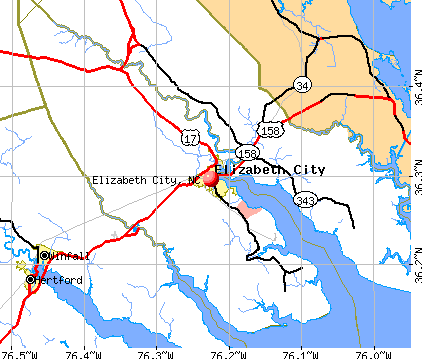
Latitude: 36.30 N, Longitude: 76.22 W
Daytime population change due to commuting: +4,854 (+25.6%)Workers who live and work in this city: 5,128 (61.3%)
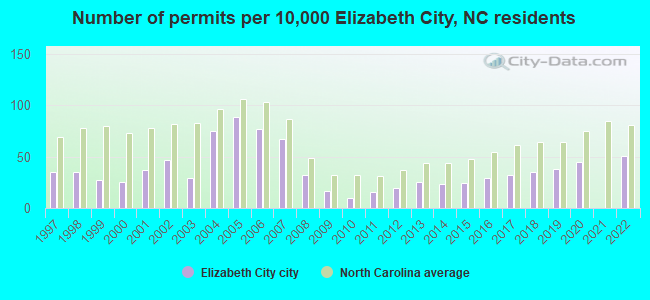
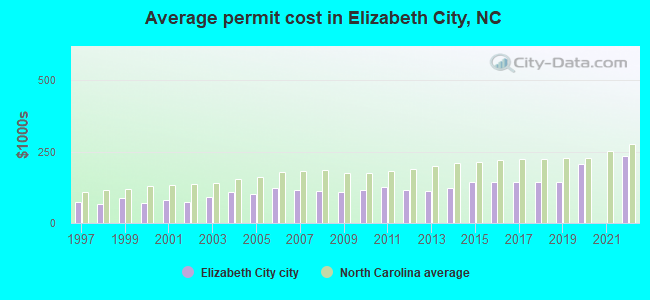
Single-family new house construction building permits:
2022: 88 buildings , average cost: $234,0002020: 77 buildings , average cost: $205,5002019: 66 buildings , average cost: $143,2002018: 61 buildings , average cost: $143,2002017: 55 buildings , average cost: $143,2002016: 50 buildings , average cost: $143,2002015: 42 buildings , average cost: $143,2002014: 39 buildings , average cost: $122,3002013: 43 buildings , average cost: $112,5002012: 32 buildings , average cost: $115,3002011: 28 buildings , average cost: $124,8002010: 17 buildings , average cost: $117,0002009: 29 buildings , average cost: $108,8002008: 55 buildings , average cost: $111,7002007: 116 buildings , average cost: $116,1002006: 132 buildings , average cost: $122,1002005: 151 buildings , average cost: $102,9002004: 129 buildings , average cost: $108,7002003: 49 buildings , average cost: $89,7002002: 80 buildings , average cost: $71,8002001: 64 buildings , average cost: $82,4002000: 43 buildings , average cost: $70,0001999: 46 buildings , average cost: $88,3001998: 61 buildings , average cost: $67,3001997: 61 buildings , average cost: $71,800Unemployment in December 2023: Here:
3.7%North Carolina:
3.2%
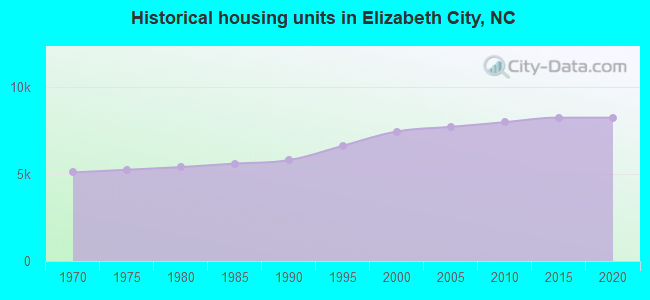
Population change in the 1990s: +1,017 (+6.3%).
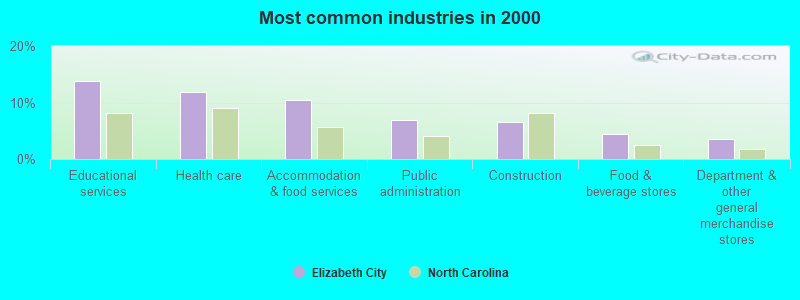
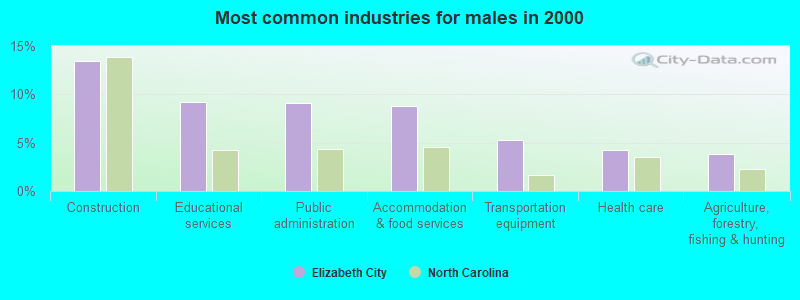
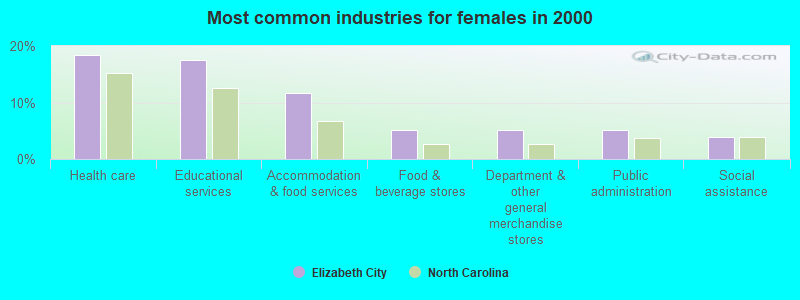
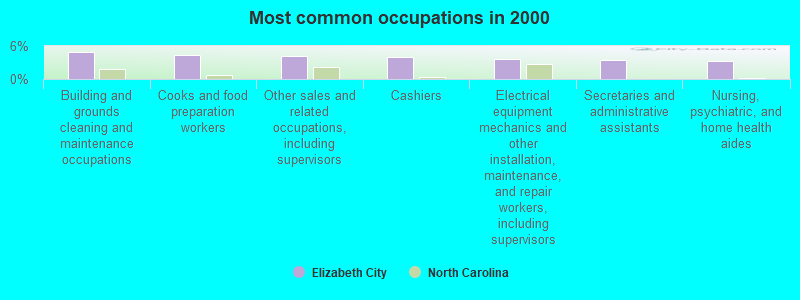
Most common occupations in Elizabeth City, NC (%)
Both Males Females
Building and grounds cleaning and maintenance occupations (4.9%)
Cooks and food preparation workers (4.3%)
Other sales and related occupations, including supervisors (4.1%)
Cashiers (4.1%)
Electrical equipment mechanics and other installation, maintenance, and repair workers, including supervisors (3.7%)
Secretaries and administrative assistants (3.5%)
Nursing, psychiatric, and home health aides (3.3%)
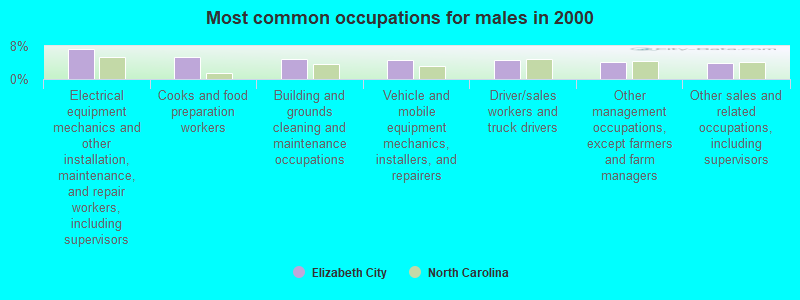
Electrical equipment mechanics and other installation, maintenance, and repair workers, including supervisors (7.2%)
Cooks and food preparation workers (5.4%)
Building and grounds cleaning and maintenance occupations (4.9%)
Vehicle and mobile equipment mechanics, installers, and repairers (4.6%)
Driver/sales workers and truck drivers (4.6%)
Other management occupations, except farmers and farm managers (4.2%)
Other sales and related occupations, including supervisors (3.9%)
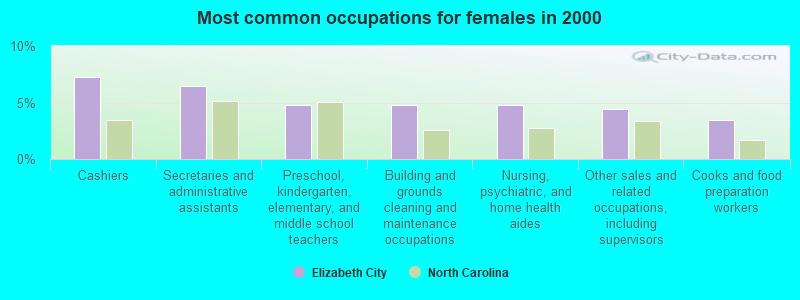
Cashiers (7.2%)
Secretaries and administrative assistants (6.4%)
Preschool, kindergarten, elementary, and middle school teachers (4.8%)
Building and grounds cleaning and maintenance occupations (4.8%)
Nursing, psychiatric, and home health aides (4.7%)
Other sales and related occupations, including supervisors (4.4%)
Cooks and food preparation workers (3.5%)
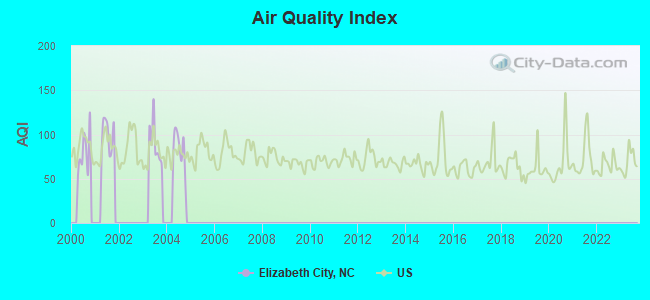
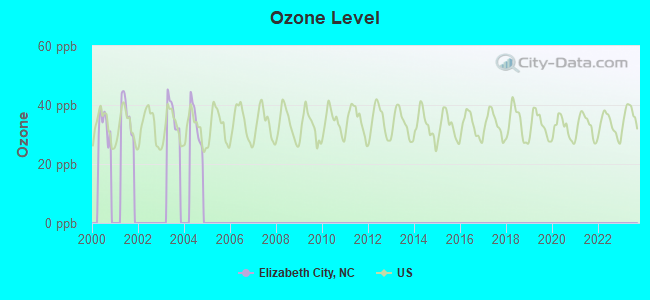
Air pollution and air quality trends(lower is better)
AQI Ozone
Tornado activity:
Elizabeth City-area historical tornado activity is slightly below North Carolina state average. It is 30% smaller than the overall U.S. average.
On 11/23/1992, a category F3 (max. wind speeds 158-206 mph) tornado 2.4 miles away from the Elizabeth City city center injured 44 people and caused between $500,000 and $5,000,000 in damages.
On 3/28/1984, a category F3 tornado 19.5 miles away from the city center killed 2 people and injured 10 people and caused between $500,000 and $5,000,000 in damages.
Earthquake activity:
Elizabeth City-area historical earthquake activity is significantly above North Carolina state average. It is 65% smaller than the overall U.S. average. On 8/23/2011 at 17:51:04, a magnitude 5.8 (5.8 MW, Depth: 3.7 mi, Class: Moderate, Intensity: VI - VII) earthquake occurred 146.2 miles away from the city center On 12/9/2003 at 20:59:14, a magnitude 4.5 (4.5 MB, 4.5 LG, Class: Light, Intensity: IV - V) earthquake occurred 128.8 miles away from Elizabeth City center On 12/9/2003 at 20:59:18, a magnitude 4.5 (4.5 ML, Depth: 6.2 mi) earthquake occurred 145.5 miles away from Elizabeth City center On 8/25/2011 at 05:07:52, a magnitude 4.5 (4.5 ML, Depth: 4.2 mi) earthquake occurred 149.2 miles away from Elizabeth City center On 8/9/2020 at 12:07:37, a magnitude 5.1 (5.1 MW, Depth: 4.7 mi) earthquake occurred 271.4 miles away from the city center On 1/15/2019 at 23:30:48, a magnitude 4.6 (4.6 MW, Depth: 6.2 mi) earthquake occurred 189.6 miles away from the city center Magnitude types: regional Lg-wave magnitude (LG), body-wave magnitude (MB), local magnitude (ML), moment magnitude (MW) Natural disasters: The number of natural disasters in Pasquotank County (15) is near the US average (15).Major Disasters (Presidential) Declared: 7Emergencies Declared: 6Hurricanes: 12, Blizzard: 1, Ice Storm: 1, Other: 1 (Note: some incidents may be assigned to more than one category). Main business address for: GATEWAY FINANCIAL HOLDINGS INC NATIONAL COMMERCIAL BANKS ).
Hospitals and medical centers in Elizabeth City: ALBEMARLE HOSPITAL AUTHORITY (Government - Hospital District or Authority, provides emergency services, 1144 N ROAD ST) GUARDIAN CARE OF ELIZABETH CITY INC (901 S HALSTEAD BLVD)
KINDRED TRANSITIONAL CARE AND REHAB-ELIZABETH CITY (901 S HALSTEAD BLVD)
W R WINSLOW MEMORIAL HOME (1075 US HIGHWAY 17 SOUTH)
W R WINSLOW MEMORIAL HOME INC (1700 W EHRINGHAUS ST)
ELIZABETH CITY DIALYSIS (1840 WEST CITY DR)
ALBEMARLE HOME CARE (311 CEDAR ST.)
Colleges/Universities in Elizabeth City: Elizabeth City State University Full-time enrollment: 2,803; Location: 1704 Weeksville Rd; Public; Website: www.ecsu.edu; Offers Master's degree )
College of the Albemarle Full-time enrollment: 1,915; Location: 1208 N Road St; Public; Website: www.albemarle.edu)
Mid-Atlantic Christian University Full-time enrollment: 133; Location: 715 N Poindexter St; Private, not-for-profit; Website: www.macuniversity.edu)
Other colleges/universities with over 2000 students near Elizabeth City:
Regent University (about 35 miles; Virginia Beach, VA ; Full-time enrollment: 3,429)
ECPI University (about 38 miles; Virginia Beach, VA ; FT enrollment: 10,694)
Norfolk State University (about 39 miles; Norfolk, VA ; FT enrollment: 6,032)
Tidewater Community College (about 39 miles; Norfolk, VA ; FT enrollment: 20,975)
Old Dominion University (about 42 miles; Norfolk, VA ; FT enrollment: 19,825)
Hampton University (about 51 miles; Hampton, VA ; FT enrollment: 4,494)
Thomas Nelson Community College (about 55 miles; Hampton, VA ; FT enrollment: 7,056)
Public high schools in Elizabeth City:
Private high schools in Elizabeth City: VICTORY CHRISTIAN SCHOOL Students: 177, Location: 684 OLD HERTFORD HWY, Grades: PK-12)
ALBEMARLE SCHOOL Students: 168, Location: 1210 US HIGHWAY 17 S, Grades: PK-12)
FORESHADOW ACADEMY Students: 20, Location: 1456 WEEKSVILLE RD, Grades: 6-12)
Public elementary/middle schools in Elizabeth City:
Private elementary/middle schools in Elizabeth City: ST STEPHEN MISSIONARY BAPTIST CHURCH CHILD CARE Students: 19, Location: 513 W CYPRESS ST, Grades: UG-3)
ELIZABETH CITY SDA SCHOOL Students: 9, Location: 1117 US HIGHWAY 17 S, Grades: 1-7)
See full list of schools located in Elizabeth City Library in Elizabeth City: EAST ALBEMARLE REGIONAL LIBRARY Operating income: $2,509,115; Location: 100 EAST COLONIAL AVENUE; 178,311 books ; 9,365 audio materials ; 7,504 video materials ; 6 local licensed databases ; 56 state licensed databases ; 350 print serial subscriptions )
User-submitted facts and corrections:
E-City is a beautiful place to grow up and raise a happy and heathly family. There is no place I'd rather grow up and live then in my hometown of E-City. I love the Harbor of Hospitality!
Notable locations in Elizabeth City: (A) , Elizabeth City Wastewater Treatment Plant (B) , Elizabeth City State University - Recreation Center (C) , Elizabeth City State University - Mickey L Burnim Fine Arts Center (D) , Elizabeth City State University - G R Little Library (E) , Elizabeth City State University - Campus Police (F) , Museum of the Albermarle (G) , Knobbs Creek Recreation Center (H) , Pasquotank County Courthouse (I) , East Albemarle Regional Library - Pasquotank - Camden Branch (J) , Carolina House of Elizabeth City (K) , W R Winslow Memorial Home (L) , Shiloh Group Home (M) , Elizabeth City State University - Wamack Residence Hall (N) , Elizabeth City State University - Mitchell Lewis Residence Hall (O) , Elizabeth City State University - Doles Residence Hall (P) , Elizabeth City State University - Butler Residence Hall (Q) , Elizabeth City State University - Bias Residence Hall (R) , Grice-Fearing House (S) , Elizabeth City Police Department (T) . Display/hide their locations on the map
Shopping Centers: (1) , Edgewood Shopping Center (2) . Display/hide their locations on the map
Main business address in Elizabeth City: (A) . Display/hide its location on the map
Churches in Elizabeth City include: (A) , Corinth Baptist Church (B) , First United Methodist Church (C) , First Christian Church (D) , Saint James Missionary Baptist Church (E) , Memorial Missionary Baptist Church (F) , Christ Episcopal Church (G) , Cann Memorial Church (H) , First Baptist Church (I) . Display/hide their locations on the map
Cemeteries: (1) , Oak Grove Cemetery (2) , New Hollywood Cemetery (3) , Hollywood Cemetery (4) . Display/hide their locations on the map
Creeks: (A) , Knobbs Creek (B) . Display/hide their locations on the map
Park in Elizabeth City: (1) . Display/hide its location on the map
Hotels: (1) , Elizabeth City Days Inn (308 S Hughes Blvd) (2) , Econo Lodge (522 South Hughes Boulevard) (3) , Days Inn (308 South Hughes Boulevard) (4) , Hampton Inn Elizabeth City- N.C. (402 Halstead Blvd) (5) , Holiday Inn Express (306 South Hughes Boulevard) (6) . Display/hide their approximate locations on the map
Courts: (1) , North Carolina State - District Court Judges (Courthouse) (2) , United States Government - Justice Dept- Court Security Officer (206 East Main Street) (3) . Display/hide their approximate locations on the map
Birthplace of: Bob Hagedorn - Politician, Franklin D. Miller - Army Medal of Honor recipient, Herbert H. Bateman - Politician, James Green Martin - Confederate Army general, John Warren Davis - Politician, Scott Sanders (director) - Film director, Ruby Johnson - Soul musician, Anthony Smith (defensive end) - Football player, Barbara Harris (singer) - Female singer, Ernest Hassell - College basketball player (Jackson State Tigers).
Pasquotank County has a predicted average indoor radon screening level less than 2 pCi/L (pico curies per liter) - Low Potential Average household size: This city:
2.4 peopleNorth Carolina:
2.5 people
Percentage of family households: This city:
61.4%Whole state:
66.7%
Percentage of households with unmarried partners: This city:
6.3%Whole state:
5.9%
Likely homosexual households (counted as self-reported same-sex unmarried-partner households)
Lesbian couples: 0.1% of all households Gay men: 0.2% of all households
People in group quarters in Elizabeth City in 2010:
1,755 people in college/university student housing
182 people in nursing facilities/skilled-nursing facilities
127 people in local jails and other municipal confinement facilities
9 people in group homes intended for adults
7 people in other noninstitutional facilities
6 people in emergency and transitional shelters (with sleeping facilities) for people experiencing homelessness
4 people in residential treatment centers for juveniles (non-correctional)
3 people in residential treatment centers for adults
People in group quarters in Elizabeth City in 2000:
975 people in college dormitories (includes college quarters off campus)
262 people in nursing homes
116 people in other noninstitutional group quarters
99 people in local jails and other confinement facilities (including police lockups)
5 people in homes for the mentally retarded
3 people in wards in general hospitals for patients who have no usual home elsewhere
Arena or stadium:
R.L. Vaughn Center. Elizabeth City State University.
Banks with branches in Elizabeth City (2011 data):
Wells Fargo Bank, National Association: Elizabeth City Main, Nc Pasquotank County 1, Southgate Branch. Info updated 2011/04/05: Bank assets: $1,161,490.0 mil, Deposits: $905,653.0 mil, headquarters in Sioux Falls, SD, positive income , 6395 total offices , Holding Company: Wells Fargo & Company
PNC Bank, National Association: Elizabeth City Branch at 606 East Main Street, branch established on 1924/01/01; Mall Branch at 1407 W. Ehringhaus Street, branch established on 1974/04/19. Info updated 2012/03/20: Bank assets: $263,309.6 mil, Deposits: $197,343.0 mil, headquarters in Wilmington, DE, positive income , Commercial Lending Specialization, 3085 total offices , Holding Company: Pnc Financial Services Group, Inc., The
Bank of Hampton Roads: Southgate Branch at 1404 West Ehringhaus Street, branch established on 1970/08/17; Elizabeth City Main Branch at 1145 North Road Street, branch established on 1998/12/01. Info updated 2009/05/20: Bank assets: $1,899.1 mil, Deposits: $1,581.4 mil, headquarters in Norfolk, VA, negative income in the last year , Commercial Lending Specialization, 47 total offices , Holding Company: Capgen Capital Group Vi Lp
First-Citizens Bank & Trust Company: Elizabeth City Branch at 310-312 South Road Street, branch established on 1976/12/01; Holly Square Branch at 1609 West Ehringhaus Street, branch established on 1977/06/01. Info updated 2011/10/11: Bank assets: $20,566.4 mil, Deposits: $17,596.8 mil, headquarters in Raleigh, NC, positive income , Commercial Lending Specialization, 433 total offices , Holding Company: First Citizens Bancshares, Inc.
First South Bank: Elizabeth City Branch at 604 East Ehringhaus Street, branch established on 1902/01/01. Info updated 2006/11/03: Bank assets: $744.4 mil, Deposits: $644.7 mil, headquarters in Washington, NC, positive income , Commercial Lending Specialization, 27 total offices , Holding Company: First South Bancorp, Inc.
Select Bank & Trust Company: Elizabeth City Branch at 104 Nance Court, branch established on 2004/12/13. Info updated 2012/01/20: Bank assets: $215.0 mil, Deposits: $165.7 mil, headquarters in Greenville, NC, positive income , Commercial Lending Specialization, 5 total offices , Holding Company: Select Bancorp, Inc.
Branch Banking and Trust Company: Elizabeth City Main Branch at 1000 West Ehringhaus Street, branch established on 1916/01/01. Info updated 2010/03/29: Bank assets: $168,867.6 mil, Deposits: $127,549.5 mil, headquarters in Winston Salem, NC, positive income , Commercial Lending Specialization, 1793 total offices , Holding Company: Bb&T Corporation
Woodforest National Bank: Elizabeth City Walmart Branch at 101 Tanglewood Parkway, branch established on 2006/12/11. Info updated 2011/05/10: Bank assets: $3,488.9 mil, Deposits: $3,097.6 mil, headquarters in Houston, TX, positive income , Commercial Lending Specialization, 766 total offices , Holding Company: Woodforest Financial Group Employee Stock Ownership Plan (With 401(K) Provisions)
For population 15 years and over in Elizabeth City:
Never married: 36.4%Now married: 40.8%Separated: 2.3%Widowed: 7.2%Divorced: 13.3% For population 25 years and over in Elizabeth City:
High school or higher: 89.5%Bachelor's degree or higher: 27.6%Graduate or professional degree: 9.0%Unemployed: 15.4%Mean travel time to work (commute): 19.7 minutes
Education Gini index (Inequality in education) Here:
11.3North Carolina average:
11.7
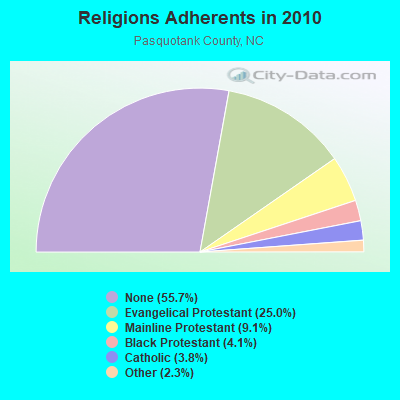
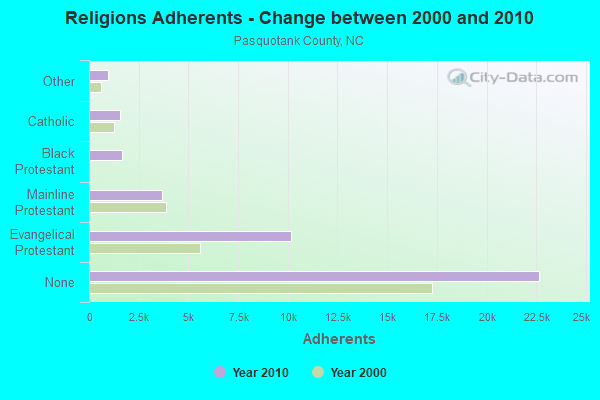
Religion statistics for Elizabeth City, NC (based on Pasquotank County data)
Religion Adherents Congregations Evangelical Protestant 10,148 49 Mainline Protestant 3,688 13 Black Protestant 1,670 13 Catholic 1,545 1 Other 946 3 None 22,664 -
Source: Clifford Grammich, Kirk Hadaway, Richard Houseal, Dale E.Jones, Alexei Krindatch, Richie Stanley and Richard H.Taylor. 2012. 2010 U.S.Religion Census: Religious Congregations & Membership Study. Association of Statisticians of American Religious Bodies. Jones, Dale E., et al. 2002. Congregations and Membership in the United States 2000. Nashville, TN: Glenmary Research Center. Graphs represent county-level data
Food Environment Statistics: Number of grocery stores : 12This county :
2.95 / 10,000 pop.North Carolina :
2.05 / 10,000 pop.
Number of convenience stores (no gas) : 1This county :
0.25 / 10,000 pop.North Carolina :
0.92 / 10,000 pop.
Number of convenience stores (with gas) : 20Pasquotank County :
4.92 / 10,000 pop.North Carolina :
4.75 / 10,000 pop.
Number of full-service restaurants : 37Here :
9.10 / 10,000 pop.North Carolina :
7.57 / 10,000 pop.
Adult diabetes rate : Pasquotank County :
10.5%North Carolina :
9.8%
Adult obesity rate : Pasquotank County :
32.3%North Carolina :
28.3%
Low-income preschool obesity rate : This county :
14.7%North Carolina :
15.6%
Health and Nutrition: Healthy diet rate : Here:
49.2%North Carolina:
48.9%
Average overall health of teeth and gums : This city:
46.2%North Carolina:
46.1%
Average BMI : Elizabeth City:
29.3North Carolina:
28.8
People feeling badly about themselves : This city:
19.6%North Carolina:
20.7%
People not drinking alcohol at all : This city:
13.2%North Carolina:
10.7%
Average hours sleeping at night : Elizabeth City:
6.7State:
6.8
Overweight people : This city:
34.6%North Carolina:
33.7%
General health condition : This city:
54.3%State:
55.8%
Average condition of hearing : This city:
80.9%North Carolina:
79.7%
More about Health and Nutrition of Elizabeth City, NC Residents
Local government employment and payroll (March 2022)
Function
Full-time employees
Monthly full-time payroll
Average yearly full-time wage
Part-time employees
Monthly part-time payroll
Financial Administration
71 $259,580 $43,873 2 $3,147 Police Protection - Officers
58 $330,471 $68,373 0 $0 Firefighters
39 $160,859 $49,495 0 $0 Sewerage
25 $96,575 $46,356 0 $0 Electric Power
16 $105,045 $78,784 0 $0 Parks and Recreation
14 $80,495 $68,996 52 $26,880 Streets and Highways
12 $37,741 $37,741 0 $0 Housing and Community Development (Local)
8 $35,887 $53,831 1 $1,280 Other Government Administration
7 $42,122 $72,209 1 $1,356 Water Supply
6 $22,815 $45,630 0 $0 Police - Other
6 $18,644 $37,288 4 $2,628 Fire - Other
4 $23,388 $70,164 0 $0 Other and Unallocable
1 $7,141 $85,692 0 $0
Totals for Government
267 $1,220,764 $54,866 60 $35,290
Businesses in Elizabeth City, NC
Name Count Name Count
7-Eleven 1 Marriott 1 Ace Hardware 1 MasterBrand Cabinets 5 Advance Auto Parts 1 Maurices 1 Applebee's 1 McDonald's 3 Arby's 1 Microtel 1 AutoZone 1 New Balance 1 Blockbuster 1 Nike 4 Burger King 2 Nissan 1 CVS 1 OfficeMax 1 Chevrolet 1 Papa John's Pizza 1 Curves 1 Payless 1 Dairy Queen 1 Penske 1 Days Inn 1 Pizza Hut 1 Decora Cabinetry 1 Quality 1 Domino's Pizza 1 RadioShack 1 Econo Lodge 1 Ruby Tuesday 1 FedEx 5 Rue21 1 Ford 1 SAS Shoes 1 GNC 1 SONIC Drive-In 1 GameStop 1 Starbucks 1 H&R Block 2 Subway 3 Hardee's 2 The Room Place 1 Hilton 1 Toyota 1 Holiday Inn 1 U-Haul 4 Honda 1 U.S. Cellular 3 Hyundai 1 UPS 5 IHOP 1 Vans 2 JCPenney 1 Verizon Wireless 1 KFC 1 Walgreens 1 Kincaid 1 Walmart 1 La-Z-Boy 1 Wendy's 2 Little Caesars Pizza 1 YMCA 1 Lowe's 1
Strongest AM radio stations in Elizabeth City:
WCNC (1240 AM; 1 kW; ELIZABETH CITY, NC; Owner: EAST CAROLINA RADIO, INC.)
WGAI (560 AM; 1 kW; ELIZABETH CITY, NC; Owner: MAX RADIO OF THE CAROLINAS LICENSES LLC)
WCKO (1110 AM; daytime; 50 kW; NORFOLK, VA; Owner: WORD BROADCASTING NETWORK, INC.)
WTAR (850 AM; 50 kW; NORFOLK, VA; Owner: SINCLAIR COMMUNICATIONS)
WGH (1310 AM; 20 kW; NEWPORT NEWS, VA; Owner: CHESAPEAKE BAY BROADCASTING, LLC)
WPMH (1010 AM; 10 kW; PORTSMOUTH, VA; Owner: ABC, INC.)
WRJR (670 AM; 20 kW; CLAREMONT, VA; Owner: CHESAPEAKE-PORTSMOUTH BROADCASTING CORPORATION)
WHKT (1650 AM; 10 kW; PORTSMOUTH, VA; Owner: ABC, INC.)
WRVA (1140 AM; 50 kW; RICHMOND, VA; Owner: CLEAR CHANNEL BROADCASTING LICENSES, INC.)
WFOG (1050 AM; 5 kW; NORFOLK, VA; Owner: CHESAPEAKE BAY BROADCASTING, LLC)
WPTF (680 AM; 50 kW; RALEIGH, NC; Owner: FIRST STATE COMMUNICATIONS)
WKGM (940 AM; 10 kW; SMITHFIELD, VA; Owner: WKGM, INC.)
WFTK (1030 AM; daytime; 50 kW; WAKE FOREST, NC; Owner: POSITIVE RADIO GROUP, INC.)
Strongest FM radio stations in Elizabeth City:
WRVS-FM (89.9 FM; ELIZABETH CITY, NC; Owner: ELIZABETH CITY STATE UNIVERSITY)
WGPS (88.3 FM; ELIZABETH CITY, NC; Owner: CSN INTERNATIONAL)
WKOC (93.7 FM; CHESAPEAKE, VA; Owner: COMMONWEALTH RADIO, L.L.C.)
WFMZ (104.9 FM; HERTFORD, NC; Owner: MARANATHA BROADCASTING COMPANY, INC.)
WCXL (104.1 FM; KILL DEVIL HILLS, NC; Owner: MAX RADIO OF THE CAROLINAS LICENSES LLC)
WRSF (105.7 FM; COLUMBIA, NC; Owner: EAST CAROLINA RADIO, INC.)
WAFX (106.9 FM; SUFFOLK, VA; Owner: TIDEWATER COMMUNICATIONS, LLC)
WHRO-FM (90.3 FM; NORFOLK, VA; Owner: HAMPTON ROADS EDUCATIONAL TELECOMMUNICATIONS ASSOCIATION,INC)
WHRV (89.5 FM; NORFOLK, VA; Owner: HAMPTON ROADS EDUCATIONAL TELECOMMUNICATIONS ASSOCIATION,INC)
WFMI (100.9 FM; SOUTHERN SHORES, NC; Owner: COMMUNICATIONS SYSTEMS, INC.)
WERX-FM (102.5 FM; COLUMBIA, NC; Owner: LAWRENCE LOESCH & MARGARET LOESCH)
WVKL (95.7 FM; NORFOLK, VA; Owner: ENTERCOM NORFOLK LICENSE, LLC)
WBHH (92.1 FM; MOYOCK, NC; Owner: CLEAR CHANNEL BROADCASTING LICENSES, INC.)
TV broadcast stations around Elizabeth City:
W18BB (Channel 18; ELIZABETH CITY, NC; Owner: ELIZABETH CITY STATE UNIVERSITY)
WUND-TV (Channel 2; COLUMBIA, NC; Owner: UNIVERSITY OF NORTH CAROLINA)
WSKY-TV (Channel 4; MANTEO, NC; Owner: SKY TELEVISION, L.L.C.)
WTKR (Channel 3; NORFOLK, VA; Owner: NEW YORK TIMES MANAGEMENT SERVICES)
WTVZ-TV (Channel 33; NORFOLK, VA; Owner: WTVZ LICENSEE, LLC)
WHRO-TV (Channel 15; HAMPTON-NORFOLK, VA; Owner: HAMPTON ROADS EDUCATIONAL TELECOMMUNICATIONS ASSOC, INC.)
WPXV (Channel 49; NORFOLK, VA; Owner: PAXSON COMMUNICATIONS LICENSE COMPANY, LLC)
WVEC-TV (Channel 13; HAMPTON, VA; Owner: WVEC TELEVISION, INC.)
WVBT (Channel 43; VIRGINIA BEACH, VA; Owner: WAVY BROADCASTING, LLC)
WITD-CA (Channel 23; CHESAPEAKE, VA; Owner: WAVY BROADCASTING, LLC)
WGNT (Channel 27; PORTSMOUTH, VA; Owner: UPN TELEVISION STATIONS INC.)
WAVY-TV (Channel 10; PORTSMOUTH, VA; Owner: WAVY BROADCASTING, LLC)
WNLO-CA (Channel 45; NORFOLK, VA; Owner: WAVY BROADCASTING, LLC)
Medal of Honor Recipients
Medal of Honor Recipient born in Elizabeth City: Franklin D. Miller.
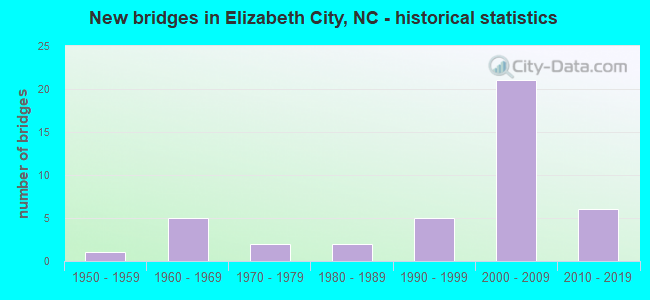
National Bridge Inventory (NBI) Statistics 42 Number of bridges617ft / 188m Total length287,200 Total average daily traffic30,659 Total average daily truck traffic
New bridges - historical statistics
1 1950-1959 5 1960-1969 2 1970-1979 2 1980-1989 5 1990-1999 21 2000-2009 6 2010-2019
See full National Bridge Inventory statistics for Elizabeth City, NC
Fire-safe hotels and motels in Elizabeth City, North Carolina:
Quality Inn, 522 S Hughes Blvd, Elizabeth City, North Carolina 27909 Phone: (252) 338-3951, Fax: (252) 338-6225
Hampton Inn, 402 Halstead Blvd, Elizabeth City, North Carolina 27909 Phone: (252) 333-1800, Fax: (252) 333-1801
Fairfield Inn & Suites, 1640 City Center Blvd, Elizabeth City, North Carolina 27909 Phone: (252) 333-1003, Fax: (252) 333-1008
Days Inn Elizabeth City, 308 S Hughes, Elizabeth City, North Carolina 27909 Phone: (252) 335-4316, Fax: (252) 335-9476
ECONO LODGE, 510 S Hughes Blvd, Elizabeth city, North Carolina 27909 Phone: (252) 338-4124
All 5 fire-safe hotels and motels in Elizabeth City, North Carolina
Most common first names in Elizabeth City, NC among deceased individuals Name Count Lived (average)
William 329 73.2 years James 293 71.6 years Mary 269 79.2 years John 258 73.4 years George 178 73.2 years Robert 153 69.7 years Margaret 126 76.3 years Willie 126 73.1 years Annie 106 81.6 years Joseph 98 72.2 years
Most common last names in Elizabeth City, NC among deceased individuals Last name Count Lived (average)
White 225 74.9 years Williams 216 72.3 years Sawyer 180 75.9 years Jones 159 74.5 years Johnson 145 74.3 years Davis 100 77.4 years Griffin 91 74.6 years Harris 86 75.9 years Smith 85 73.7 years Perry 78 76.1 years
Elizabeth City compared to North Carolina state average:
Black race population percentage above state average. Median age significantly below state average. Foreign-born population percentage below state average. Renting percentage above state average. Length of stay since moving in significantly above state average. House age above state average. Elizabeth City on our top lists :
#16 on the list of "Top 101 cities with the most people taking a taxi to work (population 5,000+)"
Top Patent Applicants
James H. Bowen (3)
James Harrison Bowen (3)
Carl Daley (1)
Carl F. Daley (1)
Al Turner (1)
Chester H. Allison, Jr. (1)
Adetayo Victor Adedeji (1)
Richard Hankinson (1)
Dale Hale (1)
Monica L. Carawan (1)
Total of 16 patent applications in 2008-2024.


 Recent articles from our blog. Our writers, many of them Ph.D. graduates or candidates, create easy-to-read articles on a wide variety of topics.

 (32.8 miles
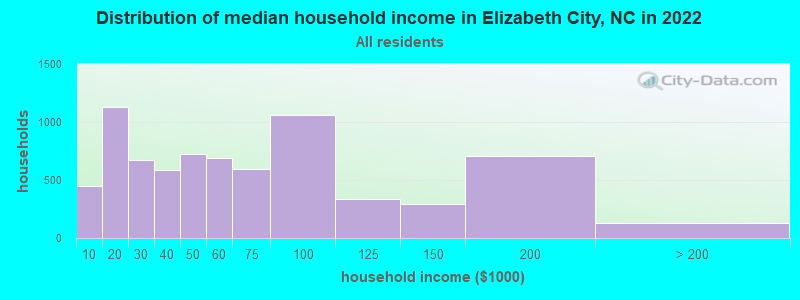


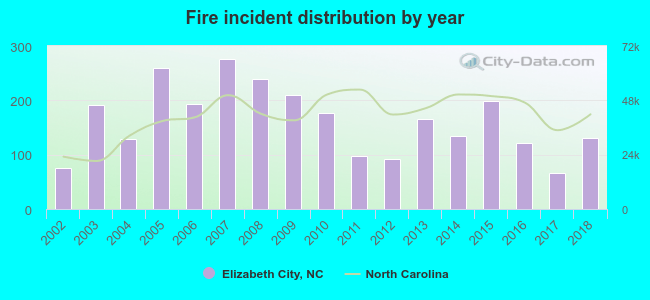 Based on the data from the years 2002 - 2018 the average number of fires per year is 162. The highest number of fires - 276 took place in 2007, and the least - 67 in 2017. The data has an increasing trend.
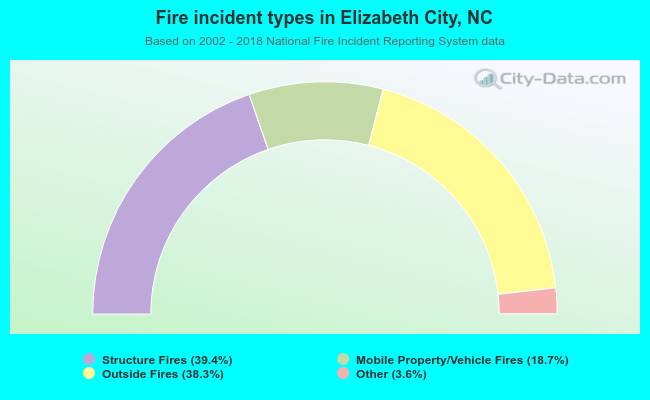 When looking into fire subcategories, the most reports belonged to: Structure Fires (39.4%), and Outside Fires (38.3%).