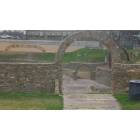
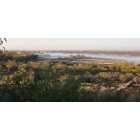
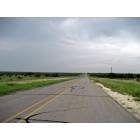
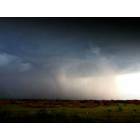
Eagle Pass, Texas Submit your own pictures of this city and show them to the world
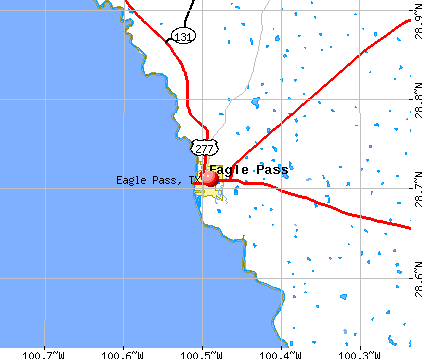
OSM Map
General Map
Google Map
MSN Map
OSM Map
General Map
Google Map
MSN Map
OSM Map
General Map
Google Map
MSN Map
OSM Map
General Map
Google Map
MSN Map
Please wait while loading the map...
Population in 2022: 28,255 (99% urban, 1% rural). Population change since 2000: +26.1%Males: 13,607 Females: 14,648
March 2022 cost of living index in Eagle Pass: 78.4 (low, U.S. average is 100) Percentage of residents living in poverty in 2022: 23.3%for White Non-Hispanic residents , 23.1% for Hispanic or Latino residents , 3.8% for American Indian residents , 14.2% for other race residents , 21.4% for two or more races residents )
Profiles of local businesses
Business Search - 14 Million verified businesses
Data:
Median household income ($)
Median household income (% change since 2000)
Household income diversity
Ratio of average income to average house value (%)
Ratio of average income to average rent
Median household income ($) - White
Median household income ($) - Black or African American
Median household income ($) - Asian
Median household income ($) - Hispanic or Latino
Median household income ($) - American Indian and Alaska Native
Median household income ($) - Multirace
Median household income ($) - Other Race
Median household income for houses/condos with a mortgage ($)
Median household income for apartments without a mortgage ($)
Races - White alone (%)
Races - White alone (% change since 2000)
Races - Black alone (%)
Races - Black alone (% change since 2000)
Races - American Indian alone (%)
Races - American Indian alone (% change since 2000)
Races - Asian alone (%)
Races - Asian alone (% change since 2000)
Races - Hispanic (%)
Races - Hispanic (% change since 2000)
Races - Native Hawaiian and Other Pacific Islander alone (%)
Races - Native Hawaiian and Other Pacific Islander alone (% change since 2000)
Races - Two or more races (%)
Races - Two or more races (% change since 2000)
Races - Other race alone (%)
Races - Other race alone (% change since 2000)
Racial diversity
Unemployment (%)
Unemployment (% change since 2000)
Unemployment (%) - White
Unemployment (%) - Black or African American
Unemployment (%) - Asian
Unemployment (%) - Hispanic or Latino
Unemployment (%) - American Indian and Alaska Native
Unemployment (%) - Multirace
Unemployment (%) - Other Race
Population density (people per square mile)
Population - Males (%)
Population - Females (%)
Population - Males (%) - White
Population - Males (%) - Black or African American
Population - Males (%) - Asian
Population - Males (%) - Hispanic or Latino
Population - Males (%) - American Indian and Alaska Native
Population - Males (%) - Multirace
Population - Males (%) - Other Race
Population - Females (%) - White
Population - Females (%) - Black or African American
Population - Females (%) - Asian
Population - Females (%) - Hispanic or Latino
Population - Females (%) - American Indian and Alaska Native
Population - Females (%) - Multirace
Population - Females (%) - Other Race
Coronavirus confirmed cases (May 01, 2024)
Deaths caused by coronavirus (May 01, 2024)
Coronavirus confirmed cases (per 100k population) (May 01, 2024)
Deaths caused by coronavirus (per 100k population) (May 01, 2024)
Daily increase in number of cases (May 01, 2024)
Weekly increase in number of cases (May 01, 2024)
Cases doubled (in days) (May 01, 2024)
Hospitalized patients (Apr 18, 2022)
Negative test results (Apr 18, 2022)
Total test results (Apr 18, 2022)
COVID Vaccine doses distributed (per 100k population) (Sep 19, 2023)
COVID Vaccine doses administered (per 100k population) (Sep 19, 2023)
COVID Vaccine doses distributed (Sep 19, 2023)
COVID Vaccine doses administered (Sep 19, 2023)
Likely homosexual households (%)
Likely homosexual households (% change since 2000)
Likely homosexual households - Lesbian couples (%)
Likely homosexual households - Lesbian couples (% change since 2000)
Likely homosexual households - Gay men (%)
Likely homosexual households - Gay men (% change since 2000)
Cost of living index
Median gross rent ($)
Median contract rent ($)
Median monthly housing costs ($)
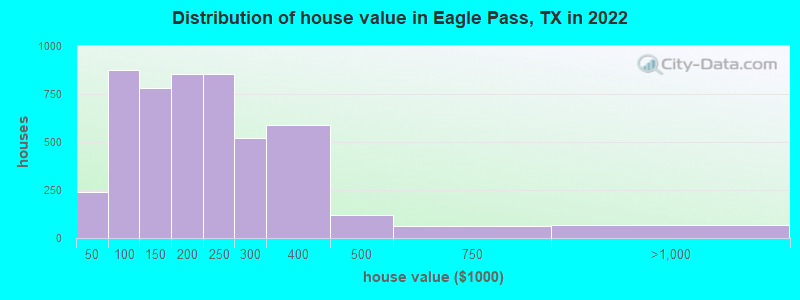
Median house or condo value ($)
Median house or condo value ($ change since 2000)
Mean house or condo value by units in structure - 1, detached ($)
Mean house or condo value by units in structure - 1, attached ($)
Mean house or condo value by units in structure - 2 ($)
Mean house or condo value by units in structure by units in structure - 3 or 4 ($)
Mean house or condo value by units in structure - 5 or more ($)
Mean house or condo value by units in structure - Boat, RV, van, etc. ($)
Mean house or condo value by units in structure - Mobile home ($)
Median house or condo value ($) - White
Median house or condo value ($) - Black or African American
Median house or condo value ($) - Asian
Median house or condo value ($) - Hispanic or Latino
Median house or condo value ($) - American Indian and Alaska Native
Median house or condo value ($) - Multirace
Median house or condo value ($) - Other Race
Median resident age
Resident age diversity
Median resident age - Males
Median resident age - Females
Median resident age - White
Median resident age - Black or African American
Median resident age - Asian
Median resident age - Hispanic or Latino
Median resident age - American Indian and Alaska Native
Median resident age - Multirace
Median resident age - Other Race
Median resident age - Males - White
Median resident age - Males - Black or African American
Median resident age - Males - Asian
Median resident age - Males - Hispanic or Latino
Median resident age - Males - American Indian and Alaska Native
Median resident age - Males - Multirace
Median resident age - Males - Other Race
Median resident age - Females - White
Median resident age - Females - Black or African American
Median resident age - Females - Asian
Median resident age - Females - Hispanic or Latino
Median resident age - Females - American Indian and Alaska Native
Median resident age - Females - Multirace
Median resident age - Females - Other Race
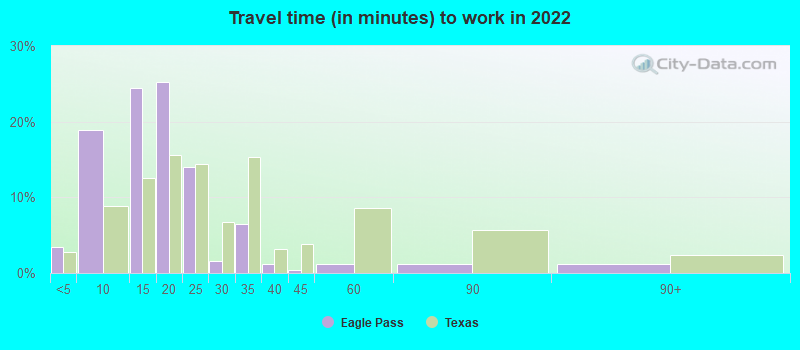
Commute - mean travel time to work (minutes)
Travel time to work - Less than 5 minutes (%)
Travel time to work - Less than 5 minutes (% change since 2000)
Travel time to work - 5 to 9 minutes (%)
Travel time to work - 5 to 9 minutes (% change since 2000)
Travel time to work - 10 to 19 minutes (%)
Travel time to work - 10 to 19 minutes (% change since 2000)
Travel time to work - 20 to 29 minutes (%)
Travel time to work - 20 to 29 minutes (% change since 2000)
Travel time to work - 30 to 39 minutes (%)
Travel time to work - 30 to 39 minutes (% change since 2000)
Travel time to work - 40 to 59 minutes (%)
Travel time to work - 40 to 59 minutes (% change since 2000)
Travel time to work - 60 to 89 minutes (%)
Travel time to work - 60 to 89 minutes (% change since 2000)
Travel time to work - 90 or more minutes (%)
Travel time to work - 90 or more minutes (% change since 2000)
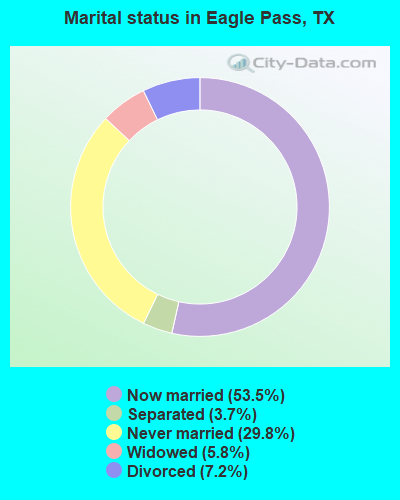
Marital status - Never married (%)
Marital status - Now married (%)
Marital status - Separated (%)
Marital status - Widowed (%)
Marital status - Divorced (%)
Median family income ($)
Median family income (% change since 2000)
Median non-family income ($)
Median non-family income (% change since 2000)
Median per capita income ($)
Median per capita income (% change since 2000)
Median family income ($) - White
Median family income ($) - Black or African American
Median family income ($) - Asian
Median family income ($) - Hispanic or Latino
Median family income ($) - American Indian and Alaska Native
Median family income ($) - Multirace
Median family income ($) - Other Race
Median year house/condo built
Median year apartment built
Year house built - Built 2005 or later (%)
Year house built - Built 2000 to 2004 (%)
Year house built - Built 1990 to 1999 (%)
Year house built - Built 1980 to 1989 (%)
Year house built - Built 1970 to 1979 (%)
Year house built - Built 1960 to 1969 (%)
Year house built - Built 1950 to 1959 (%)
Year house built - Built 1940 to 1949 (%)
Year house built - Built 1939 or earlier (%)
Average household size
Household density (households per square mile)
Average household size - White
Average household size - Black or African American
Average household size - Asian
Average household size - Hispanic or Latino
Average household size - American Indian and Alaska Native
Average household size - Multirace
Average household size - Other Race
Occupied housing units (%)
Vacant housing units (%)
Owner occupied housing units (%)
Renter occupied housing units (%)
Vacancy status - For rent (%)
Vacancy status - For sale only (%)
Vacancy status - Rented or sold, not occupied (%)
Vacancy status - For seasonal, recreational, or occasional use (%)
Vacancy status - For migrant workers (%)
Vacancy status - Other vacant (%)
Residents with income below the poverty level (%)
Residents with income below 50% of the poverty level (%)
Children below poverty level (%)
Poor families by family type - Married-couple family (%)
Poor families by family type - Male, no wife present (%)
Poor families by family type - Female, no husband present (%)
Poverty status for native-born residents (%)
Poverty status for foreign-born residents (%)
Poverty among high school graduates not in families (%)
Poverty among people who did not graduate high school not in families (%)
Residents with income below the poverty level (%) - White
Residents with income below the poverty level (%) - Black or African American
Residents with income below the poverty level (%) - Asian
Residents with income below the poverty level (%) - Hispanic or Latino
Residents with income below the poverty level (%) - American Indian and Alaska Native
Residents with income below the poverty level (%) - Multirace
Residents with income below the poverty level (%) - Other Race
Air pollution - Air Quality Index (AQI)
Air pollution - CO
Air pollution - NO2
Air pollution - SO2
Air pollution - Ozone
Air pollution - PM10
Air pollution - PM25
Air pollution - Pb
Crime - Murders per 100,000 population
Crime - Rapes per 100,000 population
Crime - Robberies per 100,000 population
Crime - Assaults per 100,000 population
Crime - Burglaries per 100,000 population
Crime - Thefts per 100,000 population
Crime - Auto thefts per 100,000 population
Crime - Arson per 100,000 population
Crime - City-data.com crime index
Crime - Violent crime index
Crime - Property crime index
Crime - Murders per 100,000 population (5 year average)
Crime - Rapes per 100,000 population (5 year average)
Crime - Robberies per 100,000 population (5 year average)
Crime - Assaults per 100,000 population (5 year average)
Crime - Burglaries per 100,000 population (5 year average)
Crime - Thefts per 100,000 population (5 year average)
Crime - Auto thefts per 100,000 population (5 year average)
Crime - Arson per 100,000 population (5 year average)
Crime - City-data.com crime index (5 year average)
Crime - Violent crime index (5 year average)
Crime - Property crime index (5 year average)
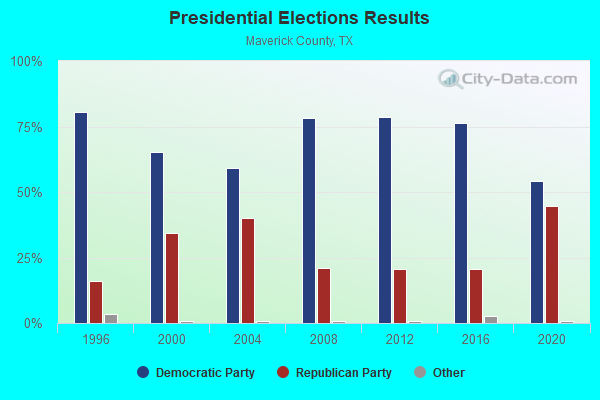
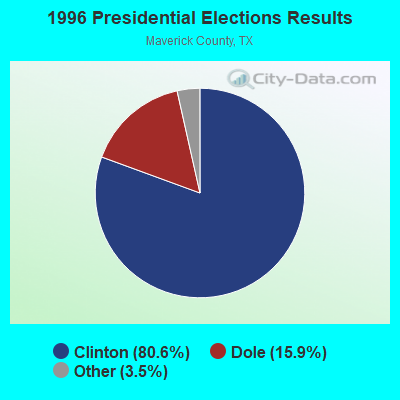
1996 Presidential Elections Results (%) - Democratic Party (Clinton)
1996 Presidential Elections Results (%) - Republican Party (Dole)
1996 Presidential Elections Results (%) - Other
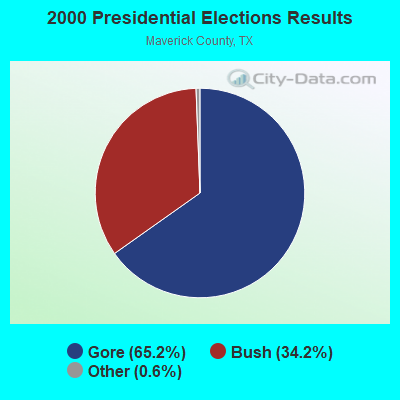
2000 Presidential Elections Results (%) - Democratic Party (Gore)
2000 Presidential Elections Results (%) - Republican Party (Bush)
2000 Presidential Elections Results (%) - Other
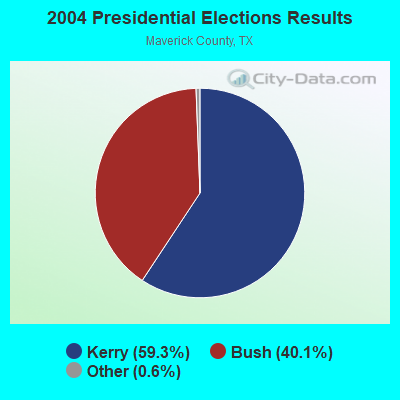
2004 Presidential Elections Results (%) - Democratic Party (Kerry)
2004 Presidential Elections Results (%) - Republican Party (Bush)
2004 Presidential Elections Results (%) - Other
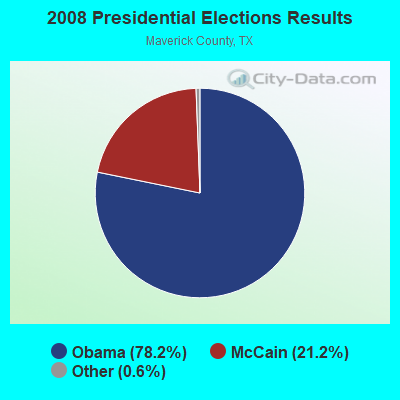
2008 Presidential Elections Results (%) - Democratic Party (Obama)
2008 Presidential Elections Results (%) - Republican Party (McCain)
2008 Presidential Elections Results (%) - Other
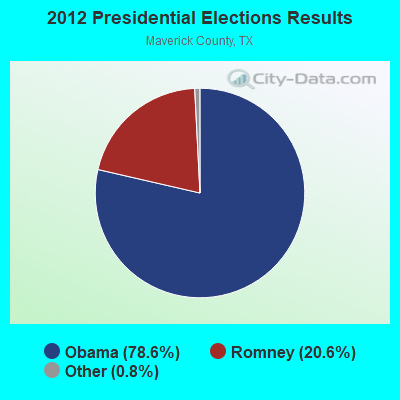
2012 Presidential Elections Results (%) - Democratic Party (Obama)
2012 Presidential Elections Results (%) - Republican Party (Romney)
2012 Presidential Elections Results (%) - Other
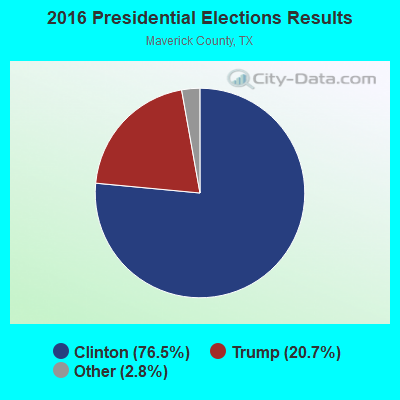
2016 Presidential Elections Results (%) - Democratic Party (Clinton)
2016 Presidential Elections Results (%) - Republican Party (Trump)
2016 Presidential Elections Results (%) - Other
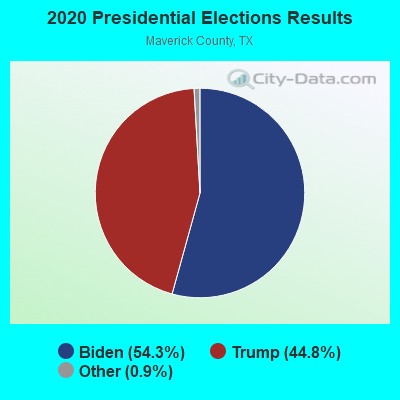
2020 Presidential Elections Results (%) - Democratic Party (Biden)
2020 Presidential Elections Results (%) - Republican Party (Trump)
2020 Presidential Elections Results (%) - Other
Ancestries Reported - Arab (%)
Ancestries Reported - Czech (%)
Ancestries Reported - Danish (%)
Ancestries Reported - Dutch (%)
Ancestries Reported - English (%)
Ancestries Reported - French (%)
Ancestries Reported - French Canadian (%)
Ancestries Reported - German (%)
Ancestries Reported - Greek (%)
Ancestries Reported - Hungarian (%)
Ancestries Reported - Irish (%)
Ancestries Reported - Italian (%)
Ancestries Reported - Lithuanian (%)
Ancestries Reported - Norwegian (%)
Ancestries Reported - Polish (%)
Ancestries Reported - Portuguese (%)
Ancestries Reported - Russian (%)
Ancestries Reported - Scotch-Irish (%)
Ancestries Reported - Scottish (%)
Ancestries Reported - Slovak (%)
Ancestries Reported - Subsaharan African (%)
Ancestries Reported - Swedish (%)
Ancestries Reported - Swiss (%)
Ancestries Reported - Ukrainian (%)
Ancestries Reported - United States (%)
Ancestries Reported - Welsh (%)
Ancestries Reported - West Indian (%)
Ancestries Reported - Other (%)
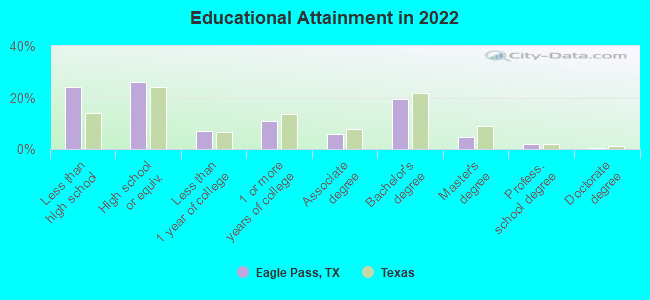
Educational Attainment - No schooling completed (%)
Educational Attainment - Less than high school (%)
Educational Attainment - High school or equivalent (%)
Educational Attainment - Less than 1 year of college (%)
Educational Attainment - 1 or more years of college (%)
Educational Attainment - Associate degree (%)
Educational Attainment - Bachelor's degree (%)
Educational Attainment - Master's degree (%)
Educational Attainment - Professional school degree (%)
Educational Attainment - Doctorate degree (%)
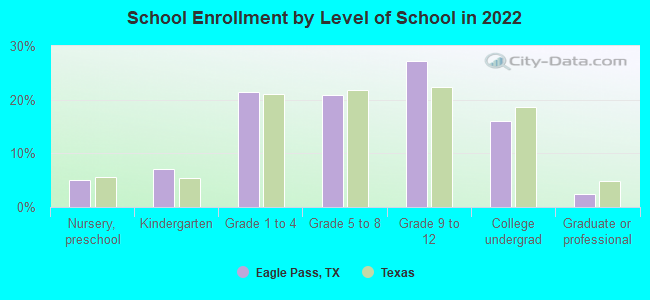
School Enrollment - Nursery, preschool (%)
School Enrollment - Kindergarten (%)
School Enrollment - Grade 1 to 4 (%)
School Enrollment - Grade 5 to 8 (%)
School Enrollment - Grade 9 to 12 (%)
School Enrollment - College undergrad (%)
School Enrollment - Graduate or professional (%)
School Enrollment - Not enrolled in school (%)
School enrollment - Public schools (%)
School enrollment - Private schools (%)
School enrollment - Not enrolled (%)
Median number of rooms in houses and condos
Median number of rooms in apartments
Housing units lacking complete plumbing facilities (%)
Housing units lacking complete kitchen facilities (%)
Density of houses
Urban houses (%)
Rural houses (%)
Households with people 60 years and over (%)
Households with people 65 years and over (%)
Households with people 75 years and over (%)
Households with one or more nonrelatives (%)
Households with no nonrelatives (%)
Population in households (%)
Family households (%)
Nonfamily households (%)
Population in families (%)
Family households with own children (%)
Median number of bedrooms in owner occupied houses
Mean number of bedrooms in owner occupied houses
Median number of bedrooms in renter occupied houses
Mean number of bedrooms in renter occupied houses
Median number of vehichles in owner occupied houses
Mean number of vehichles in owner occupied houses
Median number of vehichles in renter occupied houses
Mean number of vehichles in renter occupied houses
Mortgage status - with mortgage (%)
Mortgage status - with second mortgage (%)
Mortgage status - with home equity loan (%)
Mortgage status - with both second mortgage and home equity loan (%)
Mortgage status - without a mortgage (%)
Average family size
Average family size - White
Average family size - Black or African American
Average family size - Asian
Average family size - Hispanic or Latino
Average family size - American Indian and Alaska Native
Average family size - Multirace
Average family size - Other Race
Geographical mobility - Same house 1 year ago (%)
Geographical mobility - Moved within same county (%)
Geographical mobility - Moved from different county within same state (%)
Geographical mobility - Moved from different state (%)
Geographical mobility - Moved from abroad (%)
Place of birth - Born in state of residence (%)
Place of birth - Born in other state (%)
Place of birth - Native, outside of US (%)
Place of birth - Foreign born (%)
Housing units in structures - 1, detached (%)
Housing units in structures - 1, attached (%)
Housing units in structures - 2 (%)
Housing units in structures - 3 or 4 (%)
Housing units in structures - 5 to 9 (%)
Housing units in structures - 10 to 19 (%)
Housing units in structures - 20 to 49 (%)
Housing units in structures - 50 or more (%)
Housing units in structures - Mobile home (%)
Housing units in structures - Boat, RV, van, etc. (%)
House/condo owner moved in on average (years ago)
Renter moved in on average (years ago)
Year householder moved into unit - Moved in 1999 to March 2000 (%)
Year householder moved into unit - Moved in 1995 to 1998 (%)
Year householder moved into unit - Moved in 1990 to 1994 (%)
Year householder moved into unit - Moved in 1980 to 1989 (%)
Year householder moved into unit - Moved in 1970 to 1979 (%)
Year householder moved into unit - Moved in 1969 or earlier (%)
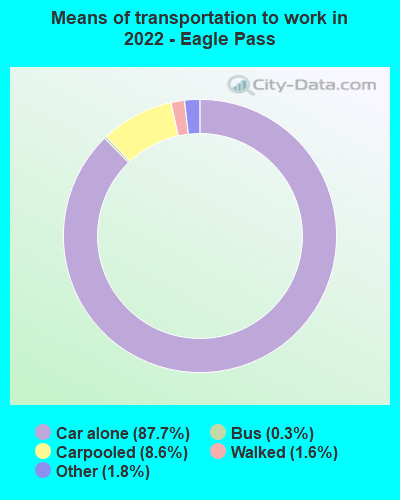
Means of transportation to work - Drove car alone (%)
Means of transportation to work - Carpooled (%)
Means of transportation to work - Public transportation (%)
Means of transportation to work - Bus or trolley bus (%)
Means of transportation to work - Streetcar or trolley car (%)
Means of transportation to work - Subway or elevated (%)
Means of transportation to work - Railroad (%)
Means of transportation to work - Ferryboat (%)
Means of transportation to work - Taxicab (%)
Means of transportation to work - Motorcycle (%)
Means of transportation to work - Bicycle (%)
Means of transportation to work - Walked (%)
Means of transportation to work - Other means (%)
Working at home (%)
Industry diversity
Most Common Industries - Agriculture, forestry, fishing and hunting, and mining (%)
Most Common Industries - Agriculture, forestry, fishing and hunting (%)
Most Common Industries - Mining, quarrying, and oil and gas extraction (%)
Most Common Industries - Construction (%)
Most Common Industries - Manufacturing (%)
Most Common Industries - Wholesale trade (%)
Most Common Industries - Retail trade (%)
Most Common Industries - Transportation and warehousing, and utilities (%)
Most Common Industries - Transportation and warehousing (%)
Most Common Industries - Utilities (%)
Most Common Industries - Information (%)
Most Common Industries - Finance and insurance, and real estate and rental and leasing (%)
Most Common Industries - Finance and insurance (%)
Most Common Industries - Real estate and rental and leasing (%)
Most Common Industries - Professional, scientific, and management, and administrative and waste management services (%)
Most Common Industries - Professional, scientific, and technical services (%)
Most Common Industries - Management of companies and enterprises (%)
Most Common Industries - Administrative and support and waste management services (%)
Most Common Industries - Educational services, and health care and social assistance (%)
Most Common Industries - Educational services (%)
Most Common Industries - Health care and social assistance (%)
Most Common Industries - Arts, entertainment, and recreation, and accommodation and food services (%)
Most Common Industries - Arts, entertainment, and recreation (%)
Most Common Industries - Accommodation and food services (%)
Most Common Industries - Other services, except public administration (%)
Most Common Industries - Public administration (%)
Occupation diversity
Most Common Occupations - Management, business, science, and arts occupations (%)
Most Common Occupations - Management, business, and financial occupations (%)
Most Common Occupations - Management occupations (%)
Most Common Occupations - Business and financial operations occupations (%)
Most Common Occupations - Computer, engineering, and science occupations (%)
Most Common Occupations - Computer and mathematical occupations (%)
Most Common Occupations - Architecture and engineering occupations (%)
Most Common Occupations - Life, physical, and social science occupations (%)
Most Common Occupations - Education, legal, community service, arts, and media occupations (%)
Most Common Occupations - Community and social service occupations (%)
Most Common Occupations - Legal occupations (%)
Most Common Occupations - Education, training, and library occupations (%)
Most Common Occupations - Arts, design, entertainment, sports, and media occupations (%)
Most Common Occupations - Healthcare practitioners and technical occupations (%)
Most Common Occupations - Health diagnosing and treating practitioners and other technical occupations (%)
Most Common Occupations - Health technologists and technicians (%)
Most Common Occupations - Service occupations (%)
Most Common Occupations - Healthcare support occupations (%)
Most Common Occupations - Protective service occupations (%)
Most Common Occupations - Fire fighting and prevention, and other protective service workers including supervisors (%)
Most Common Occupations - Law enforcement workers including supervisors (%)
Most Common Occupations - Food preparation and serving related occupations (%)
Most Common Occupations - Building and grounds cleaning and maintenance occupations (%)
Most Common Occupations - Personal care and service occupations (%)
Most Common Occupations - Sales and office occupations (%)
Most Common Occupations - Sales and related occupations (%)
Most Common Occupations - Office and administrative support occupations (%)
Most Common Occupations - Natural resources, construction, and maintenance occupations (%)
Most Common Occupations - Farming, fishing, and forestry occupations (%)
Most Common Occupations - Construction and extraction occupations (%)
Most Common Occupations - Installation, maintenance, and repair occupations (%)
Most Common Occupations - Production, transportation, and material moving occupations (%)
Most Common Occupations - Production occupations (%)
Most Common Occupations - Transportation occupations (%)
Most Common Occupations - Material moving occupations (%)
People in Group quarters - Institutionalized population (%)
People in Group quarters - Correctional institutions (%)
People in Group quarters - Federal prisons and detention centers (%)
People in Group quarters - Halfway houses (%)
People in Group quarters - Local jails and other confinement facilities (including police lockups) (%)
People in Group quarters - Military disciplinary barracks (%)
People in Group quarters - State prisons (%)
People in Group quarters - Other types of correctional institutions (%)
People in Group quarters - Nursing homes (%)
People in Group quarters - Hospitals/wards, hospices, and schools for the handicapped (%)
People in Group quarters - Hospitals/wards and hospices for chronically ill (%)
People in Group quarters - Hospices or homes for chronically ill (%)
People in Group quarters - Military hospitals or wards for chronically ill (%)
People in Group quarters - Other hospitals or wards for chronically ill (%)
People in Group quarters - Hospitals or wards for drug/alcohol abuse (%)
People in Group quarters - Mental (Psychiatric) hospitals or wards (%)
People in Group quarters - Schools, hospitals, or wards for the mentally retarded (%)
People in Group quarters - Schools, hospitals, or wards for the physically handicapped (%)
People in Group quarters - Institutions for the deaf (%)
People in Group quarters - Institutions for the blind (%)
People in Group quarters - Orthopedic wards and institutions for the physically handicapped (%)
People in Group quarters - Wards in general hospitals for patients who have no usual home elsewhere (%)
People in Group quarters - Wards in military hospitals for patients who have no usual home elsewhere (%)
People in Group quarters - Juvenile institutions (%)
People in Group quarters - Long-term care (%)
People in Group quarters - Homes for abused, dependent, and neglected children (%)
People in Group quarters - Residential treatment centers for emotionally disturbed children (%)
People in Group quarters - Training schools for juvenile delinquents (%)
People in Group quarters - Short-term care, detention or diagnostic centers for delinquent children (%)
People in Group quarters - Type of juvenile institution unknown (%)
People in Group quarters - Noninstitutionalized population (%)
People in Group quarters - College dormitories (includes college quarters off campus) (%)
People in Group quarters - Military quarters (%)
People in Group quarters - On base (%)
People in Group quarters - Barracks, unaccompanied personnel housing (UPH), (Enlisted/Officer), ;and similar group living quarters for military personnel (%)
People in Group quarters - Transient quarters for temporary residents (%)
People in Group quarters - Military ships (%)
People in Group quarters - Group homes (%)
People in Group quarters - Homes or halfway houses for drug/alcohol abuse (%)
People in Group quarters - Homes for the mentally ill (%)
People in Group quarters - Homes for the mentally retarded (%)
People in Group quarters - Homes for the physically handicapped (%)
People in Group quarters - Other group homes (%)
People in Group quarters - Religious group quarters (%)
People in Group quarters - Dormitories (%)
People in Group quarters - Agriculture workers' dormitories on farms (%)
People in Group quarters - Job Corps and vocational training facilities (%)
People in Group quarters - Other workers' dormitories (%)
People in Group quarters - Crews of maritime vessels (%)
People in Group quarters - Other nonhousehold living situations (%)
People in Group quarters - Other noninstitutional group quarters (%)
Residents speaking English at home (%)
Residents speaking English at home - Born in the United States (%)
Residents speaking English at home - Native, born elsewhere (%)
Residents speaking English at home - Foreign born (%)
Residents speaking Spanish at home (%)
Residents speaking Spanish at home - Born in the United States (%)
Residents speaking Spanish at home - Native, born elsewhere (%)
Residents speaking Spanish at home - Foreign born (%)
Residents speaking other language at home (%)
Residents speaking other language at home - Born in the United States (%)
Residents speaking other language at home - Native, born elsewhere (%)
Residents speaking other language at home - Foreign born (%)
Class of Workers - Employee of private company (%)
Class of Workers - Self-employed in own incorporated business (%)
Class of Workers - Private not-for-profit wage and salary workers (%)
Class of Workers - Local government workers (%)
Class of Workers - State government workers (%)
Class of Workers - Federal government workers (%)
Class of Workers - Self-employed workers in own not incorporated business and Unpaid family workers (%)
House heating fuel used in houses and condos - Utility gas (%)
House heating fuel used in houses and condos - Bottled, tank, or LP gas (%)
House heating fuel used in houses and condos - Electricity (%)
House heating fuel used in houses and condos - Fuel oil, kerosene, etc. (%)
House heating fuel used in houses and condos - Coal or coke (%)
House heating fuel used in houses and condos - Wood (%)
House heating fuel used in houses and condos - Solar energy (%)
House heating fuel used in houses and condos - Other fuel (%)
House heating fuel used in houses and condos - No fuel used (%)
House heating fuel used in apartments - Utility gas (%)
House heating fuel used in apartments - Bottled, tank, or LP gas (%)
House heating fuel used in apartments - Electricity (%)
House heating fuel used in apartments - Fuel oil, kerosene, etc. (%)
House heating fuel used in apartments - Coal or coke (%)
House heating fuel used in apartments - Wood (%)
House heating fuel used in apartments - Solar energy (%)
House heating fuel used in apartments - Other fuel (%)
House heating fuel used in apartments - No fuel used (%)
Armed forces status - In Armed Forces (%)
Armed forces status - Civilian (%)
Armed forces status - Civilian - Veteran (%)
Armed forces status - Civilian - Nonveteran (%)
Fatal accidents locations in years 2005-2021
Fatal accidents locations in 2005
Fatal accidents locations in 2006
Fatal accidents locations in 2007
Fatal accidents locations in 2008
Fatal accidents locations in 2009
Fatal accidents locations in 2010
Fatal accidents locations in 2011
Fatal accidents locations in 2012
Fatal accidents locations in 2013
Fatal accidents locations in 2014
Fatal accidents locations in 2015
Fatal accidents locations in 2016
Fatal accidents locations in 2017
Fatal accidents locations in 2018
Fatal accidents locations in 2019
Fatal accidents locations in 2020
Fatal accidents locations in 2021
Alcohol use - People drinking some alcohol every month (%)
Alcohol use - People not drinking at all (%)
Alcohol use - Average days/month drinking alcohol
Alcohol use - Average drinks/week
Alcohol use - Average days/year people drink much
Audiometry - Average condition of hearing (%)
Audiometry - People that can hear a whisper from across a quiet room (%)
Audiometry - People that can hear normal voice from across a quiet room (%)
Audiometry - Ears ringing, roaring, buzzing (%)
Audiometry - Had a job exposure to loud noise (%)
Audiometry - Had off-work exposure to loud noise (%)
Blood Pressure & Cholesterol - Has high blood pressure (%)
Blood Pressure & Cholesterol - Checking blood pressure at home (%)
Blood Pressure & Cholesterol - Frequently checking blood cholesterol (%)
Blood Pressure & Cholesterol - Has high cholesterol level (%)
Consumer Behavior - Money monthly spent on food at supermarket/grocery store
Consumer Behavior - Money monthly spent on food at other stores
Consumer Behavior - Money monthly spent on eating out
Consumer Behavior - Money monthly spent on carryout/delivered foods
Consumer Behavior - Income spent on food at supermarket/grocery store (%)
Consumer Behavior - Income spent on food at other stores (%)
Consumer Behavior - Income spent on eating out (%)
Consumer Behavior - Income spent on carryout/delivered foods (%)
Current Health Status - General health condition (%)
Current Health Status - Blood donors (%)
Current Health Status - Has blood ever tested for HIV virus (%)
Current Health Status - Left-handed people (%)
Dermatology - People using sunscreen (%)
Diabetes - Diabetics (%)
Diabetes - Had a blood test for high blood sugar (%)
Diabetes - People taking insulin (%)
Diet Behavior & Nutrition - Diet health (%)
Diet Behavior & Nutrition - Milk product consumption (# of products/month)
Diet Behavior & Nutrition - Meals not home prepared (#/week)
Diet Behavior & Nutrition - Meals from fast food or pizza place (#/week)
Diet Behavior & Nutrition - Ready-to-eat foods (#/month)
Diet Behavior & Nutrition - Frozen meals/pizza (#/month)
Drug Use - People that ever used marijuana or hashish (%)
Drug Use - Ever used hard drugs (%)
Drug Use - Ever used any form of cocaine (%)
Drug Use - Ever used heroin (%)
Drug Use - Ever used methamphetamine (%)
Health Insurance - People covered by health insurance (%)
Kidney Conditions-Urology - Avg. # of times urinating at night
Medical Conditions - People with asthma (%)
Medical Conditions - People with anemia (%)
Medical Conditions - People with psoriasis (%)
Medical Conditions - People with overweight (%)
Medical Conditions - Elderly people having difficulties in thinking or remembering (%)
Medical Conditions - People who ever received blood transfusion (%)
Medical Conditions - People having trouble seeing even with glass/contacts (%)
Medical Conditions - People with arthritis (%)
Medical Conditions - People with gout (%)
Medical Conditions - People with congestive heart failure (%)
Medical Conditions - People with coronary heart disease (%)
Medical Conditions - People with angina pectoris (%)
Medical Conditions - People who ever had heart attack (%)
Medical Conditions - People who ever had stroke (%)
Medical Conditions - People with emphysema (%)
Medical Conditions - People with thyroid problem (%)
Medical Conditions - People with chronic bronchitis (%)
Medical Conditions - People with any liver condition (%)
Medical Conditions - People who ever had cancer or malignancy (%)
Mental Health - People who have little interest in doing things (%)
Mental Health - People feeling down, depressed, or hopeless (%)
Mental Health - People who have trouble sleeping or sleeping too much (%)
Mental Health - People feeling tired or having little energy (%)
Mental Health - People with poor appetite or overeating (%)
Mental Health - People feeling bad about themself (%)
Mental Health - People who have trouble concentrating on things (%)
Mental Health - People moving or speaking slowly or too fast (%)
Mental Health - People having thoughts they would be better off dead (%)
Oral Health - Average years since last visit a dentist
Oral Health - People embarrassed because of mouth (%)
Oral Health - People with gum disease (%)
Oral Health - General health of teeth and gums (%)
Oral Health - Average days a week using dental floss/device
Oral Health - Average days a week using mouthwash for dental problem
Oral Health - Average number of teeth
Pesticide Use - Households using pesticides to control insects (%)
Pesticide Use - Households using pesticides to kill weeds (%)
Physical Activity - People doing vigorous-intensity work activities (%)
Physical Activity - People doing moderate-intensity work activities (%)
Physical Activity - People walking or bicycling (%)
Physical Activity - People doing vigorous-intensity recreational activities (%)
Physical Activity - People doing moderate-intensity recreational activities (%)
Physical Activity - Average hours a day doing sedentary activities
Physical Activity - Average hours a day watching TV or videos
Physical Activity - Average hours a day using computer
Physical Functioning - People having limitations keeping them from working (%)
Physical Functioning - People limited in amount of work they can do (%)
Physical Functioning - People that need special equipment to walk (%)
Physical Functioning - People experiencing confusion/memory problems (%)
Physical Functioning - People requiring special healthcare equipment (%)
Prescription Medications - Average number of prescription medicines taking
Preventive Aspirin Use - Adults 40+ taking low-dose aspirin (%)
Reproductive Health - Vaginal deliveries (%)
Reproductive Health - Cesarean deliveries (%)
Reproductive Health - Deliveries resulted in a live birth (%)
Reproductive Health - Pregnancies resulted in a delivery (%)
Reproductive Health - Women breastfeeding newborns (%)
Reproductive Health - Women that had a hysterectomy (%)
Reproductive Health - Women that had both ovaries removed (%)
Reproductive Health - Women that have ever taken birth control pills (%)
Reproductive Health - Women taking birth control pills (%)
Reproductive Health - Women that have ever used Depo-Provera or injectables (%)
Reproductive Health - Women that have ever used female hormones (%)
Sexual Behavior - People 18+ that ever had sex (vaginal, anal, or oral) (%)
Sexual Behavior - Males 18+ that ever had vaginal sex with a woman (%)
Sexual Behavior - Males 18+ that ever performed oral sex on a woman (%)
Sexual Behavior - Males 18+ that ever had anal sex with a woman (%)
Sexual Behavior - Males 18+ that ever had any sex with a man (%)
Sexual Behavior - Females 18+ that ever had vaginal sex with a man (%)
Sexual Behavior - Females 18+ that ever performed oral sex on a man (%)
Sexual Behavior - Females 18+ that ever had anal sex with a man (%)
Sexual Behavior - Females 18+ that ever had any kind of sex with a woman (%)
Sexual Behavior - Average age people first had sex
Sexual Behavior - Average number of female sex partners in lifetime (males 18+)
Sexual Behavior - Average number of female vaginal sex partners in lifetime (males 18+)
Sexual Behavior - Average age people first performed oral sex on a woman (18+)
Sexual Behavior - Average number of woman performed oral sex on in lifetime (18+)
Sexual Behavior - Average number of male sex partners in lifetime (males 18+)
Sexual Behavior - Average number of male anal sex partners in lifetime (males 18+)
Sexual Behavior - Average age people first performed oral sex on a man (18+)
Sexual Behavior - Average number of male oral sex partners in lifetime (18+)
Sexual Behavior - People using protection when performing oral sex (%)
Sexual Behavior - Average number of times people have vaginal or anal sex a year
Sexual Behavior - People having sex without condom (%)
Sexual Behavior - Average number of male sex partners in lifetime (females 18+)
Sexual Behavior - Average number of male vaginal sex partners in lifetime (females 18+)
Sexual Behavior - Average number of female sex partners in lifetime (females 18+)
Sexual Behavior - Circumcised males 18+ (%)
Sleep Disorders - Average hours sleeping at night
Sleep Disorders - People that has trouble sleeping (%)
Smoking-Cigarette Use - People smoking cigarettes (%)
Taste & Smell - People 40+ having problems with smell (%)
Taste & Smell - People 40+ having problems with taste (%)
Taste & Smell - People 40+ that ever had wisdom teeth removed (%)
Taste & Smell - People 40+ that ever had tonsils teeth removed (%)
Taste & Smell - People 40+ that ever had a loss of consciousness because of a head injury (%)
Taste & Smell - People 40+ that ever had a broken nose or other serious injury to face or skull (%)
Taste & Smell - People 40+ that ever had two or more sinus infections (%)
Weight - Average height (inches)
Weight - Average weight (pounds)
Weight - Average BMI
Weight - People that are obese (%)
Weight - People that ever were obese (%)
Weight - People trying to lose weight (%)
According to our research of Texas and other state lists, there were 55 registered sex offenders living in Eagle Pass, Texas as of May 01, 2024 . The ratio of all residents to sex offenders in Eagle Pass is 530 to 1.The ratio of registered sex offenders to all residents in this city is near the state average.
Officers per 1,000 residents here:
2.15Texas average:
2.11
Latest news from Eagle Pass, TX collected exclusively by city-data.com from local newspapers, TV, and radio stations
Current Local Time:
Land area: 7.40 square miles.
Population density: 3,820 people per square mile (average).
8,484 residents are foreign born (28.9% Latin America ).
This city:
29.3%Texas:
17.1%
Median real estate property taxes paid for housing units with mortgages in 2022: $3,720 (1.6%)Median real estate property taxes paid for housing units with no mortgage in 2022: $2,486 (1.6%)
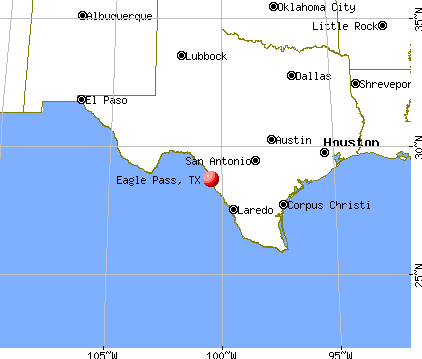
Nearest city with pop. 50,000+: Laredo, TX
Nearest city with pop. 200,000+: San Antonio, TX
Nearest cities:
Latitude: 28.71 N, Longitude: 100.49 W
Daytime population change due to commuting: +3,098 (+10.7%)Workers who live and work in this city: 9,635 (77.9%)
Eagle Pass tourist attractions:
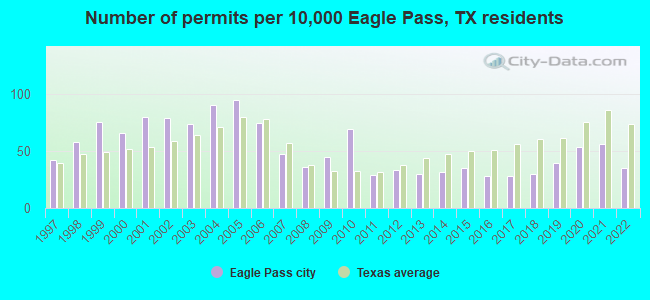
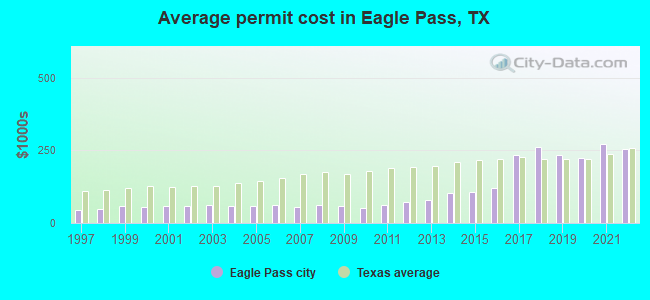
Single-family new house construction building permits:
2022: 79 buildings , average cost: $256,2002021: 126 buildings , average cost: $271,3002020: 121 buildings , average cost: $224,7002019: 88 buildings , average cost: $233,7002018: 68 buildings , average cost: $263,3002017: 63 buildings , average cost: $232,8002016: 64 buildings , average cost: $122,0002015: 79 buildings , average cost: $108,2002014: 70 buildings , average cost: $101,8002013: 68 buildings , average cost: $80,3002012: 75 buildings , average cost: $73,3002011: 66 buildings , average cost: $61,5002010: 156 buildings , average cost: $53,0002009: 101 buildings , average cost: $59,5002008: 81 buildings , average cost: $61,5002007: 107 buildings , average cost: $56,2002006: 168 buildings , average cost: $62,9002005: 213 buildings , average cost: $58,9002004: 203 buildings , average cost: $60,1002003: 165 buildings , average cost: $62,1002002: 178 buildings , average cost: $60,3002001: 180 buildings , average cost: $59,3002000: 148 buildings , average cost: $55,8001999: 169 buildings , average cost: $59,9001998: 130 buildings , average cost: $48,7001997: 95 buildings , average cost: $44,800Unemployment in December 2023:
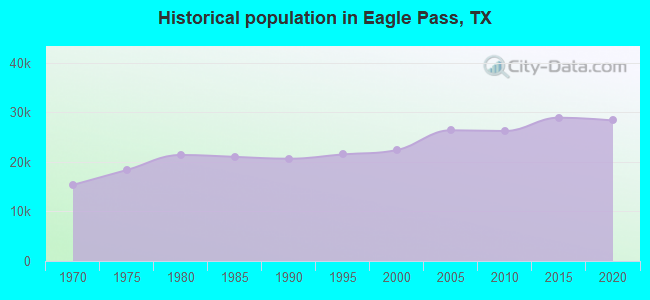
Population change in the 1990s: +707 (+3.3%).
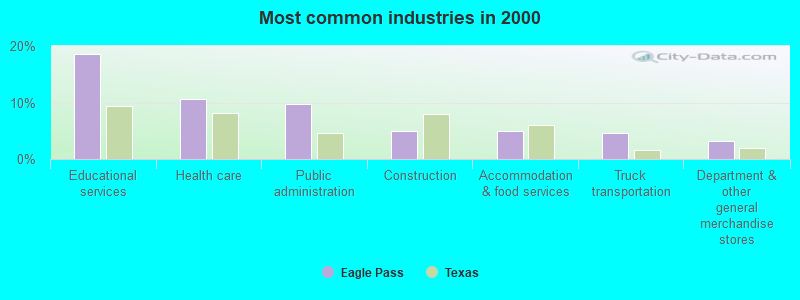
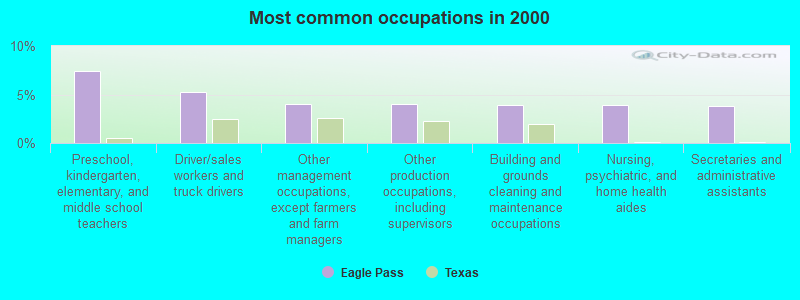
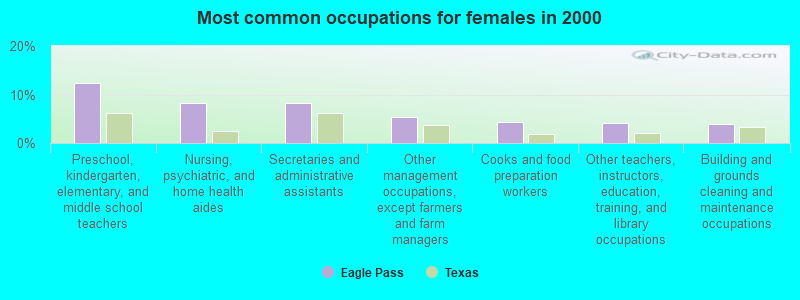
Most common occupations in Eagle Pass, TX (%)
Both Males Females
Preschool, kindergarten, elementary, and middle school teachers (7.4%)
Driver/sales workers and truck drivers (5.2%)
Other management occupations, except farmers and farm managers (4.0%)
Other production occupations, including supervisors (4.0%)
Building and grounds cleaning and maintenance occupations (4.0%)
Nursing, psychiatric, and home health aides (4.0%)
Secretaries and administrative assistants (3.8%)
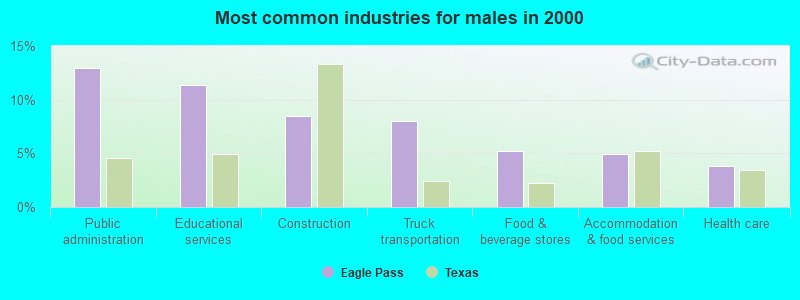
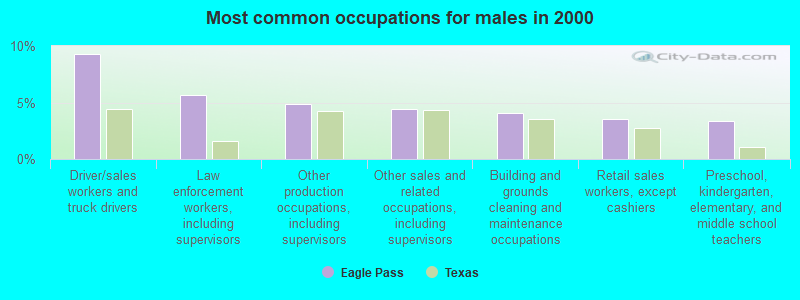
Driver/sales workers and truck drivers (9.3%)
Law enforcement workers, including supervisors (5.6%)
Other production occupations, including supervisors (4.9%)
Other sales and related occupations, including supervisors (4.5%)
Building and grounds cleaning and maintenance occupations (4.0%)
Retail sales workers, except cashiers (3.6%)
Preschool, kindergarten, elementary, and middle school teachers (3.4%)
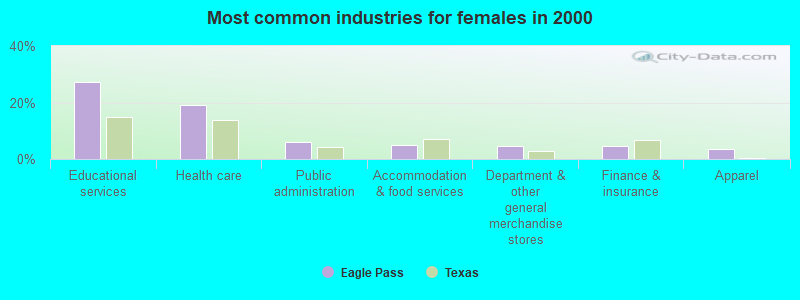
Preschool, kindergarten, elementary, and middle school teachers (12.4%)
Nursing, psychiatric, and home health aides (8.3%)
Secretaries and administrative assistants (8.2%)
Other management occupations, except farmers and farm managers (5.3%)
Cooks and food preparation workers (4.2%)
Other teachers, instructors, education, training, and library occupations (4.2%)
Building and grounds cleaning and maintenance occupations (3.9%)
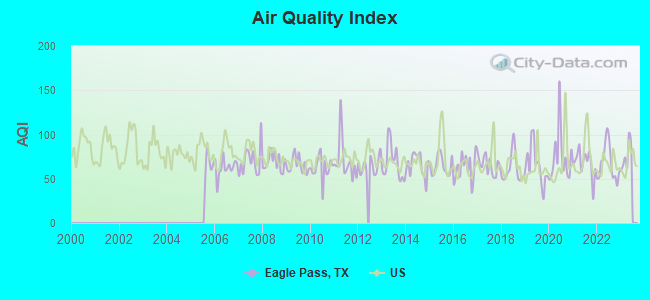
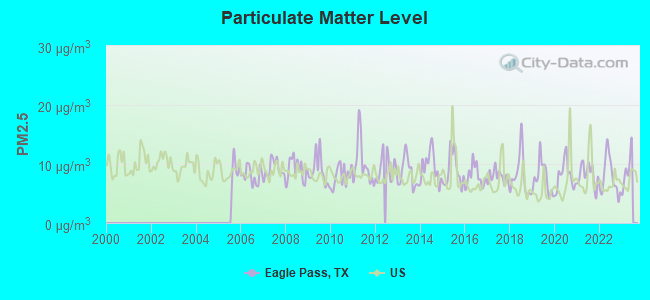
Air pollution and air quality trends(lower is better)
AQI PM2.5
Tornado activity:
Eagle Pass-area historical tornado activity is significantly below Texas state average. It is 79% smaller than the overall U.S. average.
On 4/24/2007, a category F3 (max. wind speeds 158-206 mph) tornado 6.9 miles away from the Eagle Pass city center killed 7 people and caused $80 million in damages.
On 5/16/1989, a category F4 (max. wind speeds 207-260 mph) tornado 39.6 miles away from the city center caused between $500,000 and $5,000,000 in damages.
Earthquake activity:
Eagle Pass-area historical earthquake activity is significantly above Texas state average. It is 25% smaller than the overall U.S. average. On 4/14/1995 at 00:32:56, a magnitude 5.7 (5.6 MB, 5.7 MS, 5.7 MW, Depth: 11.1 mi, Class: Moderate, Intensity: VI - VII) earthquake occurred 204.4 miles away from Eagle Pass center On 10/20/2011 at 12:24:41, a magnitude 4.8 (4.8 MW, Depth: 3.1 mi, Class: Light, Intensity: IV - V) earthquake occurred 146.5 miles away from Eagle Pass center On 6/16/1978 at 11:46:54, a magnitude 5.3 (4.4 MB, 4.6 UK, 5.3 ML) earthquake occurred 299.2 miles away from Eagle Pass center On 4/9/1993 at 12:29:19, a magnitude 4.3 (4.1 MB, 4.3 LG, Depth: 3.1 mi) earthquake occurred 143.6 miles away from Eagle Pass center On 1/2/1992 at 11:45:35, a magnitude 5.0 (4.6 MB, 5.0 LG, Depth: 3.1 mi) earthquake occurred 295.0 miles away from the city center On 3/26/2020 at 15:16:27, a magnitude 5.0 (5.0 MW, Depth: 5.9 mi) earthquake occurred 297.2 miles away from the city center Magnitude types: regional Lg-wave magnitude (LG), body-wave magnitude (MB), local magnitude (ML), surface-wave magnitude (MS), moment magnitude (MW) Natural disasters: The number of natural disasters in Maverick County (9) is smaller than the US average (15).Major Disasters (Presidential) Declared: 4Emergencies Declared: 4Hurricanes: 4, Fires: 2, Storm: 1, Tornado: 1, Tropical Storm: 1, Other: 1 (Note: some incidents may be assigned to more than one category). Hospitals in Eagle Pass: FORT DUNCAN MEDICAL CENTER (Proprietary, provides emergency services, 3333 N FOSTER MALDONADO BLVD) SIGNATURE HEALTHCARE SERVICES (590 MAIN STREET SUITE E) Nursing Homes in Eagle Pass: CANTERBURY VILLA OF EAGLE PASS (2550 ZACATECAS) EAGLE PASS NURSING AND REHABILITATION (2550 ZACATECAS DR) MAVERICK NURSING AND REHABILITATION CENTER (3106 BOB ROGERS DR) Dialysis Facilities in Eagle Pass: FMC EAGLE PASS KIDNEY DISEASE (3065 MEGAN STREET) MAVERICK COUNTY DIALYSIS (3420 AMY STRET) Home Health Centers in Eagle Pass: APC HOME HEALTH SERVICE INC (1109 FERRY STREET SUITE C) EAGLE PASS HOME HEALTH SERVICES LLC (1249 DEL RIO HWY SUITE 303) FORT DUNCAN HOME HEALTH AND HOSPICE CARE (3147 MEGAN STREET SUITE 1) MAVERICK HOME HEALTH (2822 N VETERANS BLVD SUITE A) MILAGROS HOME HEALTH (2151 EL INDIO HIGHWAY) NATIONAL MEDICAL HOMECARE INC (1000 CROWN RIDGE BLVD SUITE F) NEW GLORIOUS HOME HEALTH INC. (2149 DEL RIO BLVD SUITE 203) REMNANT HEALTH SYSTEMS INC (1858 MAIN ST) ST ISABEL HOME HEALTH INC (2979 DIAZ STREET) SUPERIOR HOME HEALTH OF EAGLE PASS LLC (2711 N VETERANS BLVD SUITE 1) TE CUIDO HOME HEALTH SERVICES (1000 CROWN RIDGE SUITE D)
College/University in Eagle Pass: SW School of Business and Technical Careers Full-time enrollment: 87; Location: 272 Commerical St; Private, for-profit; Website: www.sws.edu)
Colleges/universities with over 2000 students nearest to Eagle Pass:
Southwest Texas Junior College (about 58 miles; Uvalde, TX ; Full-time enrollment: 3,569)
Texas A & M International University (about 102 miles; Laredo, TX ; FT enrollment: 5,203)
Laredo Community College (about 103 miles; Laredo, TX ; FT enrollment: 9,743)
Northwest Vista College (about 120 miles; San Antonio, TX ; FT enrollment: 9,683)
Palo Alto College (about 125 miles; San Antonio, TX ; FT enrollment: 5,055)
Our Lady of the Lake University (about 128 miles; San Antonio, TX ; FT enrollment: 2,133)
The University of Texas at San Antonio (about 128 miles; San Antonio, TX ; FT enrollment: 25,503)
Public high schools in Eagle Pass: EAGLE PASS HIGH SCHOOL Students: 2,169, Location: 2020 2ND ST, Grades: 9-12)C C WINN HIGH SCHOOL Students: 1,997, Location: 265 FOSTER MALDONADO BLVD, Grades: 9-12)DAEP Location: 1610 DEL RIO BLVD, Grades: 7-12)
Biggest public elementary/middle schools in Eagle Pass: EAGLE PASS J H Students: 1,069, Location: 1750 N BIBB, Grades: 7-8)MEMORIAL J H Students: 998, Location: 10 MEMORIAL DR, Grades: 7-8)DENA KELSO GRAVES EL Students: 673, Location: 720 KELSO DR, Grades: PK-6)SAN LUIS ELEMENTARY Students: 526, Location: 2090 WILLIAMS ST, Grades: 1-6)RAY H DARR EL Students: 521, Location: 841 MEMO ROBINSON RD, Grades: PK-6)NELLIE MAE GLASS ELEMENTARY Students: 516, Location: 1501 BOEHMER AVE, Grades: 1-6)ROBERT E LEE ELEMENTARY Students: 482, Location: 300 S MONROE ST, Grades: 1-6)HENRY B GONZALEZ ELEMENTARY Students: 478, Location: 400 BALCONES BLVD, Grades: 1-6)SAM HOUSTON ELEMENTARY Students: 468, Location: 2781 FM1021, Grades: 2-6)SECO MINES ELEMENTARY Students: 430, Location: 2900 DIAZ, Grades: 1-6)Private elementary/middle schools in Eagle Pass: OUR LADY OF REFUGE SCHOOL Students: 291, Location: 577 WASHINGTON ST, Grades: PK-8)
REDEEMER EPISCOPAL SCHOOL Students: 106, Location: 648 MADISON ST, Grades: PK-3)
See full list of schools located in Eagle Pass Library in Eagle Pass: EAGLE PASS PUBLIC LIBRARY Operating income: $416,583; Location: 589 E MAIN ST; 46,334 books ; 2,527 audio materials ; 2,585 video materials ; 50 state licensed databases ; 50 print serial subscriptions )
User-submitted facts and corrections:
Del Rio International Airport; Del Rio,Tx; about 55 miles; Continental airlines connections to Houston Bush Intenational airport
KVAW CH 16 (analog) and 18 (digital) is is owned by Zavaletta Television Broadcasting and is independently affiliated at present
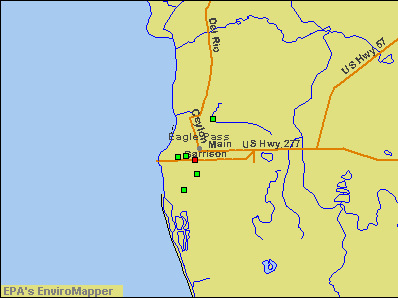
Notable locations in Eagle Pass: (A) , Maverick County Courthouse (B) , Eagle Pass Fire Department Station 3 Cardona (C) , Eagle Pass Fire Department Charles P Rodrigues Station 1 (D) , Eagle Pass Fire Department Della L Willars Station 2 (E) , Preferred Ambulance (F) , Medical Transports of South Texas (G) . Display/hide their locations on the map
Shopping Center: (1) . Display/hide its location on the map
Churches in Eagle Pass include: (A) , Episcopal Church of the Redeemer (B) , First Baptist Church (C) . Display/hide their locations on the map
Reservoirs: (A) , City Lake (B) . Display/hide their locations on the map
Parks in Eagle Pass include: (1) , Fort Duncan Park (2) , Chittum Park (3) , Burr Park (4) . Display/hide their locations on the map
Tourist attractions:
Hotel:
Birthplace of: Robert C. Mathis - Recipient of the Purple Heart medal, Alia M. Ludlum - Federal judge, Rian James - Screenwriter.
Maverick County has a predicted average indoor radon screening level less than 2 pCi/L (pico curies per liter) - Low Potential Average household size: This city:
3.1 peopleTexas:
2.8 people
Percentage of family households: This city:
78.8%Whole state:
69.9%
Percentage of households with unmarried partners: This city:
2.7%Whole state:
6.0%
Likely homosexual households (counted as self-reported same-sex unmarried-partner households)
Lesbian couples: 0.2% of all households Gay men: 0.1% of all households
People in group quarters in Eagle Pass in 2010:
252 people in local jails and other municipal confinement facilities
59 people in nursing facilities/skilled-nursing facilities
25 people in group homes intended for adults
6 people in other noninstitutional facilities
People in group quarters in Eagle Pass in 2000:
50 people in nursing homes
21 people in college dormitories (includes college quarters off campus)
21 people in other noninstitutional group quarters
6 people in unknown juvenile institutions
6 people in religious group quarters
Banks with branches in Eagle Pass (2011 data):
International Bank of Commerce: East Branch, In-Store Mall De Las Aguilas, Instore Heb - Eagle Pass Branch, Banquito Las Minas Branch, Ibc - Eagle Pass - Downtown, Main Branch. Info updated 2007/03/28: Bank assets: $9,621.9 mil, Deposits: $6,548.8 mil, headquarters in Laredo, TX, positive income , Commercial Lending Specialization, 197 total offices , Holding Company: International Bancshares Corporation
Compass Bank: Eagle Pass Main Branch, Eagle Pass Walmart Branch, Eagle Pass Downtown Branch. Info updated 2011/02/24: Bank assets: $63,107.0 mil, Deposits: $46,232.4 mil, headquarters in Birmingham, AL, negative income in the last year , Commercial Lending Specialization, 720 total offices , Holding Company: Banco Bilbao Vizcaya Argentaria, S.A.
First National Bank: Eagle Pass Branc at 275 So. Bibb Ave, branch established on 2003/06/02. Info updated 2007/09/20: Bank assets: $3,517.0 mil, Deposits: $2,598.8 mil, headquarters in Edinburg, TX, negative income in the last year , Commercial Lending Specialization, 58 total offices , Holding Company: First National Bank Group, Inc.
Falcon International Bank: South Bibb Avenue Branch at 476 South Bibb Ave, branch established on 2007/02/27. Info updated 2011/02/16: Bank assets: $869.6 mil, Deposits: $762.9 mil, headquarters in Laredo, TX, positive income , Commercial Lending Specialization, 15 total offices , Holding Company: Falcon Bancshares Incorporated
For population 15 years and over in Eagle Pass:
Never married: 29.8%Now married: 53.5%Separated: 3.7%Widowed: 5.8%Divorced: 7.2% For population 25 years and over in Eagle Pass:
High school or higher: 74.3%Bachelor's degree or higher: 24.6%Graduate or professional degree: 6.3%Unemployed: 14.6%Mean travel time to work (commute): 19.2 minutes
Education Gini index (Inequality in education) Here:
16.6Texas average:
14.0
Religion statistics for Eagle Pass, TX (based on Maverick County data)
Religion Adherents Congregations Catholic 12,600 4 Evangelical Protestant 4,001 33 Other 1,290 3 Mainline Protestant 796 4 Black Protestant - 2 None 35,571 -
Source: Clifford Grammich, Kirk Hadaway, Richard Houseal, Dale E.Jones, Alexei Krindatch, Richie Stanley and Richard H.Taylor. 2012. 2010 U.S.Religion Census: Religious Congregations & Membership Study. Association of Statisticians of American Religious Bodies. Jones, Dale E., et al. 2002. Congregations and Membership in the United States 2000. Nashville, TN: Glenmary Research Center. Graphs represent county-level data
Food Environment Statistics: Number of grocery stores : 11This county :
2.14 / 10,000 pop.Texas :
1.47 / 10,000 pop.
Number of supercenters and club stores : 2This county :
0.39 / 10,000 pop.State :
0.14 / 10,000 pop.
Number of convenience stores (no gas) : 4This county :
0.78 / 10,000 pop.Texas :
1.11 / 10,000 pop.
Number of convenience stores (with gas) : 9Maverick County :
1.75 / 10,000 pop.Texas :
3.95 / 10,000 pop.
Number of full-service restaurants : 18Maverick County :
3.51 / 10,000 pop.Texas :
6.13 / 10,000 pop.
Adult diabetes rate : Maverick County :
9.6%Texas :
8.9%
Adult obesity rate : This county :
26.6%State :
26.6%
Low-income preschool obesity rate : Maverick County :
16.5%Texas :
15.7%
Health and Nutrition: Healthy diet rate : Eagle Pass:
47.8%Texas:
48.6%
Average overall health of teeth and gums : Eagle Pass:
45.9%Texas:
47.4%
Average BMI : Eagle Pass:
28.7Texas:
28.5
People feeling badly about themselves : Eagle Pass:
20.7%State:
20.6%
People not drinking alcohol at all : Eagle Pass:
13.2%Texas:
10.3%
Average hours sleeping at night : Overweight people : Eagle Pass:
34.9%Texas:
33.1%
General health condition : This city:
52.2%State:
56.2%
Average condition of hearing : This city:
80.5%Texas:
80.7%
More about Health and Nutrition of Eagle Pass, TX Residents
Local government employment and payroll (March 2022)
Function
Full-time employees
Monthly full-time payroll
Average yearly full-time wage
Part-time employees
Monthly part-time payroll
Parks and Recreation
87 $215,560 $29,732 20 $20,331 Police Protection - Officers
87 $426,354 $58,807 13 $19,210 Streets and Highways
74 $199,742 $32,391 35 $69,268 Firefighters
54 $239,206 $53,157 1 $3,399 Solid Waste Management
30 $87,720 $35,088 0 $0 Financial Administration
21 $120,672 $68,955 0 $0 Police - Other
12 $47,670 $47,670 1 $3,776 Housing and Community Development (Local)
12 $53,055 $53,055 0 $0 Fire - Other
10 $33,789 $40,547 3 $5,040 Local Libraries
9 $25,403 $33,871 0 $0 Other and Unallocable
7 $15,589 $26,724 3 $885 Health
3 $7,420 $29,680 0 $0 Other Government Administration
0 $0 11 $195
Totals for Government
406 $1,472,180 $43,513 87 $122,104
Eagle Pass government finances - Expenditure in 2021 (per resident):
Current Operations - Central Staff Services: $8,785,000 ($310.92)
Police Protection: $5,757,000 ($203.75)Parks and Recreation: $5,386,000 ($190.62)Solid Waste Management: $5,226,000 ($184.96)Local Fire Protection: $4,673,000 ($165.39)Regular Highways: $2,871,000 ($101.61)Toll Highways: $2,594,000 ($91.81)Libraries: $1,100,000 ($38.93)Financial Administration: $786,000 ($27.82)Judicial and Legal Services: $478,000 ($16.92)General - Interest on Debt: $3,039,000 ($107.56)
Total Salaries and Wages: $13,973,000 ($494.53)
Eagle Pass government finances - Revenue in 2021 (per resident):
Charges - Toll Highways: $13,993,000 ($495.24)
Solid Waste Management: $5,386,000 ($190.62)Other: $1,492,000 ($52.80)Parks and Recreation: $35,000 ($1.24)Federal Intergovernmental - Housing and Community Development: $878,000 ($31.07)
Public Welfare: $804,000 ($28.46)Local Intergovernmental - Other: $15,000 ($0.53)
Miscellaneous - Fines and Forfeits: $309,000 ($10.94)
Rents: $91,000 ($3.22)Interest Earnings: $52,000 ($1.84)State Intergovernmental - Public Welfare: $204,000 ($7.22)
Highways: $126,000 ($4.46)General Local Government Support: $27,000 ($0.96)Tax - Property: $8,770,000 ($310.39)
General Sales and Gross Receipts: $5,428,000 ($192.11)Public Utilities Sales: $1,132,000 ($40.06)Occupation and Business License - Other: $262,000 ($9.27)
Eagle Pass government finances - Debt in 2021 (per resident):
Long Term Debt - Beginning Outstanding - Unspecified Public Purpose: $73,761,000 ($2610.55)
Outstanding Unspecified Public Purpose: $67,021,000 ($2372.00)Retired Unspecified Public Purpose: $6,740,000 ($238.54)
Eagle Pass government finances - Cash and Securities in 2021 (per resident):
Bond Funds - Cash and Securities: $10,873,000 ($384.82)
Other Funds - Cash and Securities: $17,596,000 ($622.76)
Sinking Funds - Cash and Securities: $15,000 ($0.53)
Businesses in Eagle Pass, TX
Name Count Name Count
AT&T 1 La-Z-Boy 1 Ace Hardware 1 Little Caesars Pizza 1 Advance Auto Parts 1 Long John Silver's 1 Ashley Furniture 1 Lowe's 1 AutoZone 1 McDonald's 2 Bath & Body Works 1 New York & Co 1 Best Western 1 Nike 3 Burger King 1 Payless 2 Chevrolet 1 Pizza Hut 1 Church's Chicken 2 Popeyes 1 Cricket Wireless 1 RadioShack 1 FedEx 4 Rue21 1 Foot Locker 1 SONIC Drive-In 1 GNC 1 Sears 1 GameStop 1 Sprint Nextel 1 H&R Block 2 T-Mobile 2 Hilton 1 Taco Bell 1 Holiday Inn 1 U-Haul 2 JCPenney 1 UPS 10 Journeys 1 Vans 2 KFC 1 Walmart 1 Kohl's 1 Wendy's 1 La Quinta 1
Strongest AM radio stations in Eagle Pass:
KEPS (1270 AM; 1 kW; EAGLE PASS, TX; Owner: EQUICOM, INC)
KKYX (680 AM; 50 kW; SAN ANTONIO, TX; Owner: CXR HOLDINGS, INC.)
KTKR (760 AM; 50 kW; SAN ANTONIO, TX; Owner: CCB TEXAS LICENSES, L.P.)
KVOZ (890 AM; 12 kW; DEL MAR HILLS, TX; Owner: CONSOLIDATED RADIO, INC.)
WOAI (1200 AM; 50 kW; SAN ANTONIO, TX; Owner: CCB TEXAS LICENSES, L.P.)
KENS (1160 AM; 25 kW; SAN ANTONIO, TX; Owner: KENS-TV, INC.)
KCTA (1030 AM; 50 kW; CORPUS CHRISTI, TX; Owner: BROADCASTING CORPORATION OF THE SOUTHWEST)
KGBT (1530 AM; 50 kW; HARLINGEN, TX; Owner: TICHENOR LICENSE CORPORATION)
KSAH (720 AM; 10 kW; UNIVERSAL CITY, TX; Owner: KSAH LICENSING, INC.)
KTRH (740 AM; 50 kW; HOUSTON, TX; Owner: AMFM TEXAS LICENSES LIMITED PARTNERSHIP)
WBAP (820 AM; 50 kW; FORT WORTH, TX; Owner: WBAP-KSCS OPERATING, LTD.)
KDRY (1100 AM; 11 kW; ALAMO HEIGHTS, TX; Owner: KDRY RADIO, INC.)
KTSA (550 AM; 5 kW; SAN ANTONIO, TX; Owner: INFINITY BROADCASTING CORPORATION OF SAN ANTONIO)
Strongest FM radio stations in Eagle Pass:
KINL (92.7 FM; EAGLE PASS, TX; Owner: EQUICOM,INC)
KEPX (89.5 FM; EAGLE PASS, TX; Owner: WORLD RADIO NETWORK, INC.)
KEPI (88.7 FM; EAGLE PASS, TX; Owner: WORLD RADIO NETWORK, INC.)
TV broadcast stations around Eagle Pass:
KVAW (Channel 16; EAGLE PASS, TX; Owner: HISPANIC TELEVISION NETWORK, INC., DEBTOR IN POSSESSION)
KEAP-LP (Channel 3; EAGLE PASS, TX; Owner: FAITH PLEASES GOD CHURCH CORPORATION)
National Bridge Inventory (NBI) Statistics 51 Number of bridges1,220ft / 372m Total length338,740 Total average daily traffic28,747 Total average daily truck traffic
New bridges - historical statistics
3 1920-1929 3 1940-1949 3 1950-1959 3 1960-1969 4 1970-1979 8 1980-1989 6 1990-1999 3 2000-2009 18 2010-2019
See full National Bridge Inventory statistics for Eagle Pass, TX
Fire-safe hotels and motels in Eagle Pass, Texas:
La Quinta Inn - Eagle Pass, 2525 E Main St, Eagle Pass, Texas 78852 Phone: (830) 773-7000, Fax: (830) 773-8852
Super 8 Eagle Pass, 2150 W Us Hwy 277, Eagle Pass, Texas 78852 Phone: (800) 272-9786, Fax: (210) 403-3208
Quality Inn & Suites Eagle Pass, 1923 N Veterans Blvd, Eagle Pass, Texas 78852 Phone: (830) 758-1234, Fax: (830) 758-1235
Knights Inn, 2297 Del Rio Blvd, Eagle Pass, Texas 78852 Phone: (830) 773-1811, Fax: (830) 773-1596
Camino Real Hotel, 2856 E Main St, Eagle Pass, Texas 78852 Phone: (830) 757-8111, Fax: (830) 757-8114
Motel 6, 2338 E Main St, Eagle Pass, Texas 78852 Phone: (830) 757-8100, Fax: (866) 769-0604
Towneplace Suites Eagle Pass, 2033 N Veterans Blvd, Eagle Pass, Texas 78852 Phone: (830) 757-0077, Fax: (830) 757-2727
Kickapoo Lucky Eagle Hotel, 768 Lucky Eagle Dr, Eagle Pass, Texas 78852 Phone: (830) 773-2256, Fax: (830) 773-2255
3 other hotels and motels
All 11 fire-safe hotels and motels in Eagle Pass, Texas
Most common first names in Eagle Pass, TX among deceased individuals Name Count Lived (average)
Maria 393 76.9 years Jose 250 72.8 years Jesus 136 73.3 years Juan 134 69.6 years Manuel 108 75.7 years Guadalupe 80 75.7 years Pedro 76 74.1 years Francisco 69 74.9 years Antonio 67 76.2 years Juana 61 79.7 years
Most common last names in Eagle Pass, TX among deceased individuals Last name Count Lived (average)
Rodriguez 294 75.2 years Martinez 212 73.9 years Gonzalez 169 74.5 years Hernandez 165 74.1 years Garcia 152 74.7 years Flores 141 75.3 years Garza 139 73.2 years Sanchez 100 75.6 years Lopez 95 74.7 years Ramirez 87 72.3 years
Eagle Pass compared to Texas state average:
Black race population percentage significantly below state average. Hispanic race population percentage significantly above state average. Foreign-born population percentage significantly above state average. Length of stay since moving in significantly above state average. Eagle Pass on our top lists :
#25 on the list of "Top 101 cities with largest percentage of females in occupations: education, training, and library occupations (population 5,000+)"
#29 on the list of "Top 101 cities with the lowest percentage of English-only speaking households, population 5,000+"
#35 on the list of "Top 101 cities with largest percentage of males in occupations: law enforcement workers including supervisors (population 5,000+)"
#96 on the list of "Top 101 cities with largest percentage of females in industries: educational services (population 5,000+)"
#89 (78852) on the list of "Top 101 zip codes with the lowest charity contributions deductions as a percentage of AGI in 2012 (pop 5,000+)"
#30 on the list of "Top 101 counties with highest percentage of residents voting for Obama (Democrat) in the 2012 Presidential Election"
#87 on the list of "Top 101 counties with the lowest percentage of residents relocating to other counties in 2011"
Top Patent Applicants
Dwight Baker (3)
David C. Valdez (1)
Juan Delgado (1)
Luis Alberto Davila (1)
Total of 6 patent applications in 2008-2024.


 Recent articles from our blog. Our writers, many of them Ph.D. graduates or candidates, create easy-to-read articles on a wide variety of topics.

 (102.2 miles
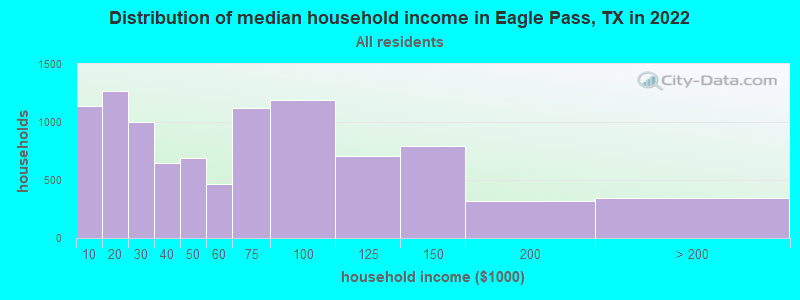


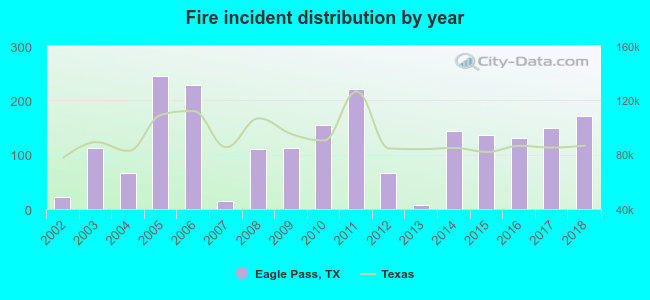 Based on the data from the years 2002 - 2018 the average number of fire incidents per year is 123. The highest number of fires - 244 took place in 2005, and the least - 8 in 2013. The data has a growing trend.
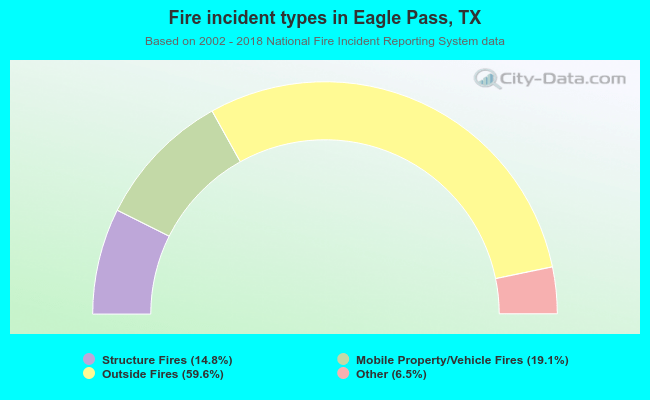 When looking into fire subcategories, the most reports belonged to: Outside Fires (59.6%), and Mobile Property/Vehicle Fires (19.1%).