Races in Eagle Pass, Texas (TX) Detailed Stats
Data:
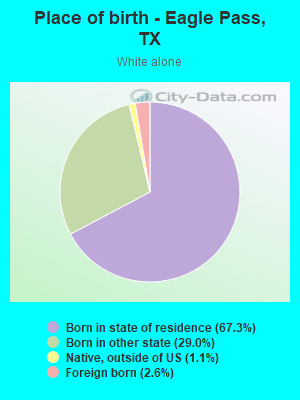
Races - White alone (%)
Races - White alone (% change since 2000)
Races - Black alone (%)
Races - Black alone (% change since 2000)
Races - American Indian alone (%)
Races - American Indian alone (% change since 2000)
Races - Asian alone (%)
Races - Asian alone (% change since 2000)
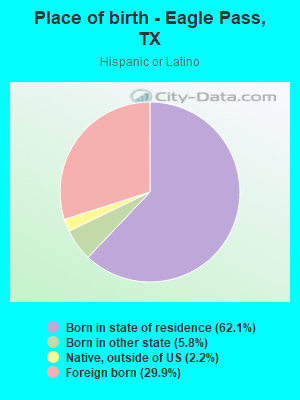
Races - Hispanic (%)
Races - Hispanic (% change since 2000)
Races - Native Hawaiian and Other Pacific Islander alone (%)
Races - Native Hawaiian and Other Pacific Islander alone (% change since 2000)
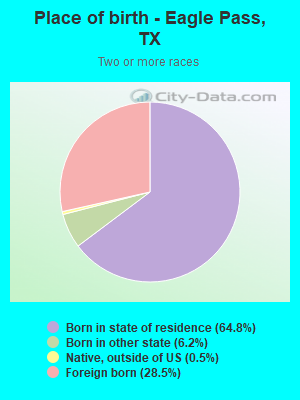
Races - Two or more races(%)
Races - Two or more races(% change since 2000)
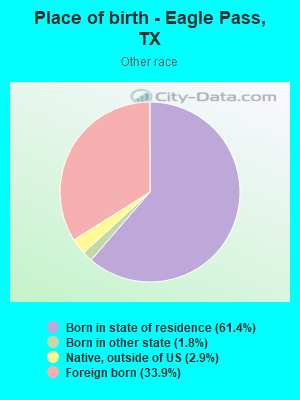
Races - Other race alone (%)
Races - Other race alone (% change since 2000)
Racial diversity
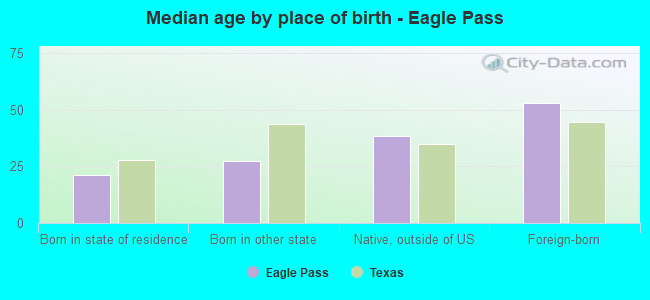
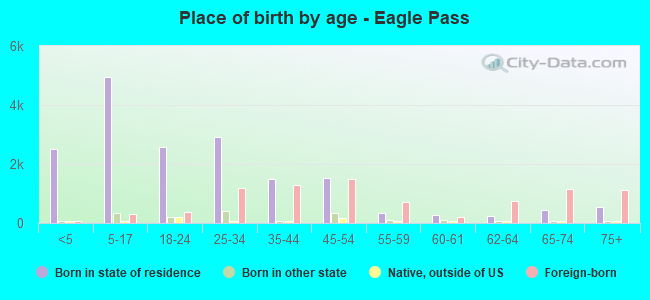
Place of birth - Born in state of residence (%)
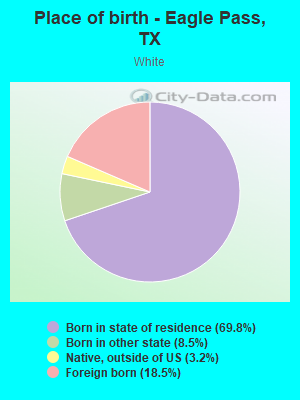
Place of birth - Born in state of residence (%) - White
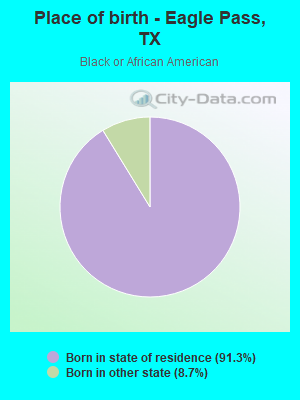
Place of birth - Born in state of residence (%) - Black or African American
Place of birth - Born in state of residence (%) - Asian
Place of birth - Born in state of residence (%) - Hispanic or Latino
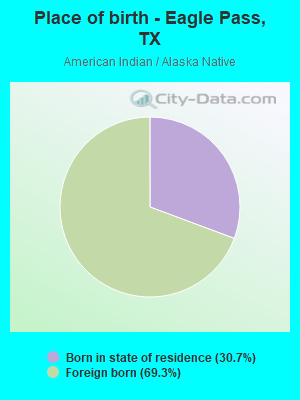
Place of birth - Born in state of residence (%) - American Indian and Alaska Native
Place of birth - Born in state of residence (%) - Multirace
Place of birth - Born in state of residence (%) - Other Race
Place of birth - Born in other state (%)
Place of birth - Born in other state (%) - White
Place of birth - Born in other state (%) - Black or African American
Place of birth - Born in other state (%) - Asian
Place of birth - Born in other state (%) - Hispanic or Latino
Place of birth - Born in other state (%) - American Indian and Alaska Native
Place of birth - Born in other state (%) - Multirace
Place of birth - Born in other state (%) - Other Race
Place of birth - Native, outside of US (%)
Place of birth - Native, outside of US (%) - White
Place of birth - Native, outside of US (%) - Black or African American
Place of birth - Native, outside of US (%) - Asian
Place of birth - Native, outside of US (%) - Hispanic or Latino
Place of birth - Native, outside of US (%) - American Indian and Alaska Native
Place of birth - Native, outside of US (%) - Multirace
Place of birth - Native, outside of US (%) - Other Race
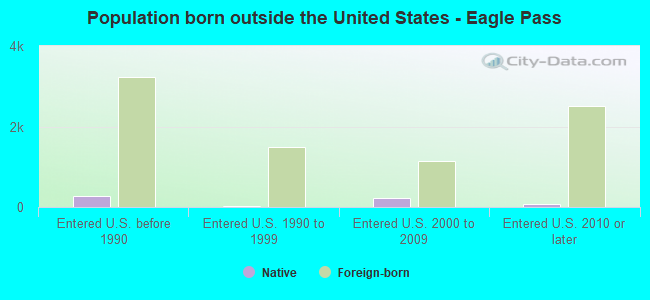
Place of birth - Foreign born (%)
Place of birth - Foreign born (%) - White
Place of birth - Foreign born (%) - Black or African American
Place of birth - Foreign born (%) - Asian
Place of birth - Foreign born (%) - Hispanic or Latino
Place of birth - Foreign born (%) - American Indian and Alaska Native
Place of birth - Foreign born (%) - Multirace
Place of birth - Foreign born (%) - Other Race
Residents speaking English at home (%)
Residents speaking English at home - Born in the United States (%)
Residents speaking English at home - Native, born elsewhere (%)
Residents speaking English at home - Foreign born (%)
Residents speaking Spanish at home (%)
Residents speaking Spanish at home - Born in the United States (%)
Residents speaking Spanish at home - Native, born elsewhere (%)
Residents speaking Spanish at home - Foreign born (%)
Residents speaking other language at home (%)
Residents speaking other language at home - Born in the United States (%)
Residents speaking other language at home - Native, born elsewhere (%)
Residents speaking other language at home - Foreign born (%)
Marital status - Never married (%)
Marital status - Now married (%)
Marital status - Separated (%)
Marital status - Widowed (%)
Marital status - Divorced (%)
Ancestries Reported - Arab (%)
Ancestries Reported - Czech (%)
Ancestries Reported - Danish (%)
Ancestries Reported - Dutch (%)
Ancestries Reported - English (%)
Ancestries Reported - French (%)
Ancestries Reported - French Canadian (%)
Ancestries Reported - German (%)
Ancestries Reported - Greek (%)
Ancestries Reported - Hungarian (%)
Ancestries Reported - Irish (%)
Ancestries Reported - Italian (%)
Ancestries Reported - Lithuanian (%)
Ancestries Reported - Norwegian (%)
Ancestries Reported - Polish (%)
Ancestries Reported - Portuguese (%)
Ancestries Reported - Russian (%)
Ancestries Reported - Scotch-Irish (%)
Ancestries Reported - Scottish (%)
Ancestries Reported - Slovak (%)
Ancestries Reported - Subsaharan African (%)
Ancestries Reported - Swedish (%)
Ancestries Reported - Swiss (%)
Ancestries Reported - Ukrainian (%)
Ancestries Reported - United States (%)
Ancestries Reported - Welsh (%)
Ancestries Reported - West Indian (%)
Ancestries Reported - Other (%)
Geographical mobility - Same house 1 year ago (%)
Geographical mobility - Same house 1 year ago (%) - White
Geographical mobility - Same house 1 year ago (%) - Black or African American
Geographical mobility - Same house 1 year ago (%) - Asian
Geographical mobility - Same house 1 year ago (%) - Hispanic or Latino
Geographical mobility - Same house 1 year ago (%) - American Indian and Alaska Native
Geographical mobility - Same house 1 year ago (%) - Multirace
Geographical mobility - Same house 1 year ago (%) - Other Race
Geographical mobility - Moved within same county (%)
Geographical mobility - Moved within same county (%) - White
Geographical mobility - Moved within same county (%) - Black or African American
Geographical mobility - Moved within same county (%) - Asian
Geographical mobility - Moved within same county (%) - Hispanic or Latino
Geographical mobility - Moved within same county (%) - American Indian and Alaska Native
Geographical mobility - Moved within same county (%) - Multirace
Geographical mobility - Moved within same county (%) - Other Race
Geographical mobility - Moved from different county within same state (%)
Geographical mobility - Moved from different county within same state (%) - White
Geographical mobility - Moved from different county within same state (%) - Black or African American
Geographical mobility - Moved from different county within same state (%) - Asian
Geographical mobility - Moved from different county within same state (%) - Hispanic or Latino
Geographical mobility - Moved from different county within same state (%) - American Indian and Alaska Native
Geographical mobility - Moved from different county within same state (%) - Multirace
Geographical mobility - Moved from different county within same state (%) - Other Race
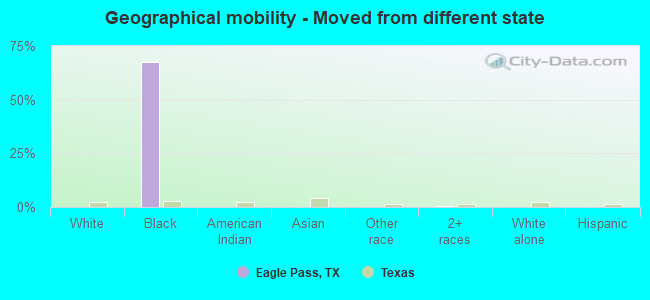
Geographical mobility - Moved from different state (%)
Geographical mobility - Moved from different state (%) - White
Geographical mobility - Moved from different state (%) - Black or African American
Geographical mobility - Moved from different state (%) - Asian
Geographical mobility - Moved from different state (%) - Hispanic or Latino
Geographical mobility - Moved from different state (%) - American Indian and Alaska Native
Geographical mobility - Moved from different state (%) - Multirace
Geographical mobility - Moved from different state (%) - Other Race
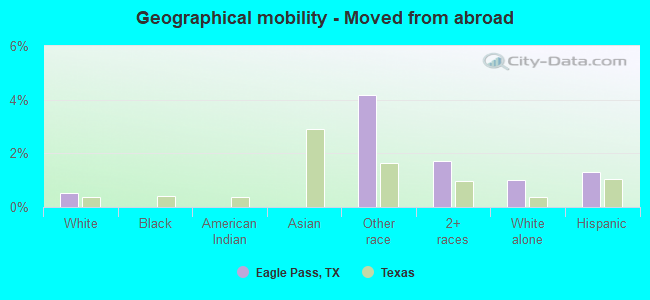
Geographical mobility - Moved from abroad (%)
Geographical mobility - Moved from abroad (%) - White
Geographical mobility - Moved from abroad (%) - Black or African American
Geographical mobility - Moved from abroad (%) - Asian
Geographical mobility - Moved from abroad (%) - Hispanic or Latino
Geographical mobility - Moved from abroad (%) - American Indian and Alaska Native
Geographical mobility - Moved from abroad (%) - Multirace
Geographical mobility - Moved from abroad (%) - Other Race
Place of birth for the foreign-born population - Ireland (%)
Place of birth for the foreign-born population - Denmark (%)
Place of birth for the foreign-born population - Norway (%)
Place of birth for the foreign-born population - Sweden (%)
Place of birth for the foreign-born population - United Kingdom (%)
Place of birth for the foreign-born population - England (%)
Place of birth for the foreign-born population - Scotland (%)
Place of birth for the foreign-born population - Other Northern Europe (%)
Place of birth for the foreign-born population - Austria (%)
Place of birth for the foreign-born population - Belgium (%)
Place of birth for the foreign-born population - France (%)
Place of birth for the foreign-born population - Germany (%)
Place of birth for the foreign-born population - Netherlands (%)
Place of birth for the foreign-born population - Switzerland (%)
Place of birth for the foreign-born population - Other Western Europe (%)
Place of birth for the foreign-born population - Greece (%)
Place of birth for the foreign-born population - Italy (%)
Place of birth for the foreign-born population - Portugal (%)
Place of birth for the foreign-born population - Spain (%)
Place of birth for the foreign-born population - Other Southern Europe (%)
Place of birth for the foreign-born population - Albania (%)
Place of birth for the foreign-born population - Belarus (%)
Place of birth for the foreign-born population - Bosnia and Herzegovina (%)
Place of birth for the foreign-born population - Bulgaria (%)
Place of birth for the foreign-born population - Croatia (%)
Place of birth for the foreign-born population - Czechoslovakia (%)
Place of birth for the foreign-born population - Hungary (%)
Place of birth for the foreign-born population - Latvia (%)
Place of birth for the foreign-born population - Lithuania (%)
Place of birth for the foreign-born population - North Macedonia (Macedonia) (%)
Place of birth for the foreign-born population - Moldova (%)
Place of birth for the foreign-born population - Poland (%)
Place of birth for the foreign-born population - Romania (%)
Place of birth for the foreign-born population - Russia (%)
Place of birth for the foreign-born population - Serbia (%)
Place of birth for the foreign-born population - Ukraine (%)
Place of birth for the foreign-born population - Other Eastern Europe (%)
Place of birth for the foreign-born population - China (%)
Place of birth for the foreign-born population - Hong Kong (%)
Place of birth for the foreign-born population - Taiwan (%)
Place of birth for the foreign-born population - Japan (%)
Place of birth for the foreign-born population - Korea (%)
Place of birth for the foreign-born population - Other Eastern Asia (%)
Place of birth for the foreign-born population - Afghanistan (%)
Place of birth for the foreign-born population - Bangladesh (%)
Place of birth for the foreign-born population - India (%)
Place of birth for the foreign-born population - Iran (%)
Place of birth for the foreign-born population - Kazakhstan (%)
Place of birth for the foreign-born population - Nepal (%)
Place of birth for the foreign-born population - Pakistan (%)
Place of birth for the foreign-born population - Sri Lanka (%)
Place of birth for the foreign-born population - Uzbekistan (%)
Place of birth for the foreign-born population - Other South Central Asia (%)
Place of birth for the foreign-born population - Burma (%)
Place of birth for the foreign-born population - Cambodia (%)
Place of birth for the foreign-born population - Indonesia (%)
Place of birth for the foreign-born population - Laos (%)
Place of birth for the foreign-born population - Malaysia (%)
Place of birth for the foreign-born population - Philippines (%)
Place of birth for the foreign-born population - Singapore (%)
Place of birth for the foreign-born population - Thailand (%)
Place of birth for the foreign-born population - Vietnam (%)
Place of birth for the foreign-born population - Other South Eastern Asia (%)
Place of birth for the foreign-born population - Armenia (%)
Place of birth for the foreign-born population - Iraq (%)
Place of birth for the foreign-born population - Israel (%)
Place of birth for the foreign-born population - Jordan (%)
Place of birth for the foreign-born population - Kuwait (%)
Place of birth for the foreign-born population - Lebanon (%)
Place of birth for the foreign-born population - Saudi Arabia (%)
Place of birth for the foreign-born population - Syria (%)
Place of birth for the foreign-born population - Turkey (%)
Place of birth for the foreign-born population - Yemen (%)
Place of birth for the foreign-born population - Other Western Asia (%)
Place of birth for the foreign-born population - Eritrea (%)
Place of birth for the foreign-born population - Ethiopia (%)
Place of birth for the foreign-born population - Kenya (%)
Place of birth for the foreign-born population - Somalia (%)
Place of birth for the foreign-born population - Uganda (%)
Place of birth for the foreign-born population - Zimbabwe (%)
Place of birth for the foreign-born population - Other Eastern Africa (%)
Place of birth for the foreign-born population - Cameroon (%)
Place of birth for the foreign-born population - Congo (%)
Place of birth for the foreign-born population - Democratic Republic of Congo (Zaire) (%)
Place of birth for the foreign-born population - Other Middle Africa (%)
Place of birth for the foreign-born population - Egypt (%)
Place of birth for the foreign-born population - Morocco (%)
Place of birth for the foreign-born population - Sudan (%)
Place of birth for the foreign-born population - Other Northern Africa (%)
Place of birth for the foreign-born population - South Africa (%)
Place of birth for the foreign-born population - Other Southern Africa (%)
Place of birth for the foreign-born population - Cabo Verde (%)
Place of birth for the foreign-born population - Ghana (%)
Place of birth for the foreign-born population - Liberia (%)
Place of birth for the foreign-born population - Nigeria (%)
Place of birth for the foreign-born population - Senegal (%)
Place of birth for the foreign-born population - Sierra Leone (%)
Place of birth for the foreign-born population - Other Western Africa (%)
Place of birth for the foreign-born population - Australia (%)
Place of birth for the foreign-born population - New Zealand (%)
Place of birth for the foreign-born population - Fiji (%)
Place of birth for the foreign-born population - Micronesia (%)
Place of birth for the foreign-born population - Bahamas (%)
Place of birth for the foreign-born population - Barbados (%)
Place of birth for the foreign-born population - Cuba (%)
Place of birth for the foreign-born population - Dominica (%)
Place of birth for the foreign-born population - Dominican Republic (%)
Place of birth for the foreign-born population - Grenada (%)
Place of birth for the foreign-born population - Haiti (%)
Place of birth for the foreign-born population - Jamaica (%)
Place of birth for the foreign-born population - St. Vincent and the Grenadines (%)
Place of birth for the foreign-born population - Trinidad and Tobago (%)
Place of birth for the foreign-born population - West Indies (%)
Place of birth for the foreign-born population - Other Caribbean (%)
Place of birth for the foreign-born population - Belize (%)
Place of birth for the foreign-born population - Costa Rica (%)
Place of birth for the foreign-born population - El Salvador (%)
Place of birth for the foreign-born population - Guatemala (%)
Place of birth for the foreign-born population - Honduras (%)
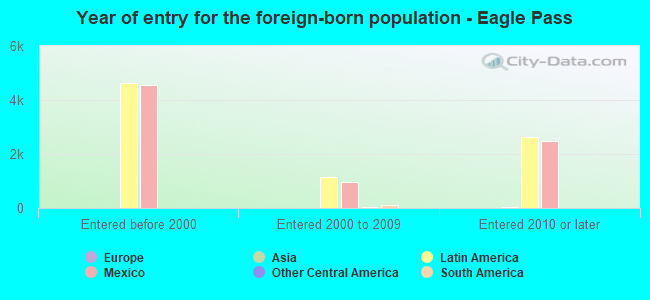
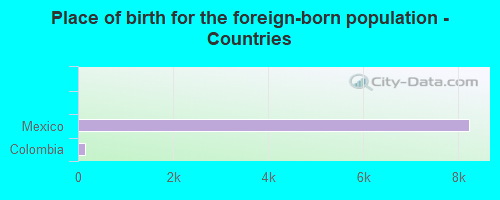
Place of birth for the foreign-born population - Mexico (%)
Place of birth for the foreign-born population - Nicaragua (%)
Place of birth for the foreign-born population - Panama (%)
Place of birth for the foreign-born population - Other Central America (%)
Place of birth for the foreign-born population - Argentina (%)
Place of birth for the foreign-born population - Bolivia (%)
Place of birth for the foreign-born population - Brazil (%)
Place of birth for the foreign-born population - Chile (%)
Place of birth for the foreign-born population - Colombia (%)
Place of birth for the foreign-born population - Ecuador (%)
Place of birth for the foreign-born population - Guyana (%)
Place of birth for the foreign-born population - Peru (%)
Place of birth for the foreign-born population - Uruguay (%)
Place of birth for the foreign-born population - Venezuela (%)
Place of birth for the foreign-born population - Other South America (%)
Place of birth for the foreign-born population - Canada (%)
Place of birth for the foreign-born population - Other Northern America (%)
Place of birth for the foreign-born population - Other (%)
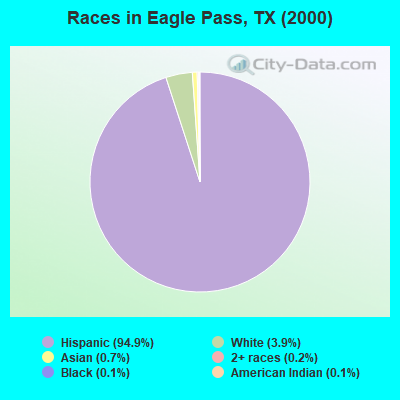
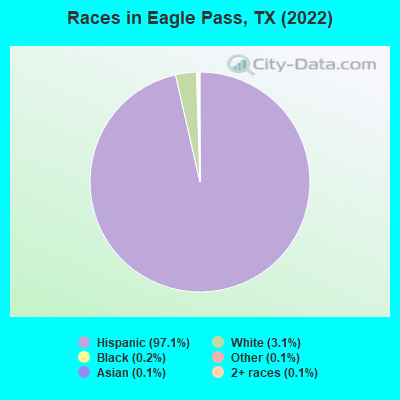
According to 2022 data, the most numerous races in Eagle Pass, TX are Hispanic (28,085 residents), White alone (884 residents), and Black alone (47 residents). 13.5% of Eagle Pass residents speak English at home. 29.3% of Eagle Pass, TX residents are foreign-born (28.9% born in Latin America), which is 42.0% greater than the foreign-born rate of 17.0% across the entire state of Texas.
Race distribution in Eagle Pass
2000 2022
10,933,313 52.4% White alone 6,669,666 32.0% Hispanic 2,364,255 11.3% Black alone 554,445 2.7% Asian alone 230,567 1.1% Two or more races 68,859 0.3% American Indian alone 19,958 0.10% Other race alone 10,757 0.05% Native Hawaiian and Other
12,070,642 40.2% Hispanic 11,683,430 38.9% White alone 3,508,706 11.7% Black alone 1,608,173 5.4% Asian alone 956,560 3.2% Two or more races 125,763 0.4% Other race alone 47,023 0.2% American Indian alone 29,275 0.10% Native Hawaiian and Other
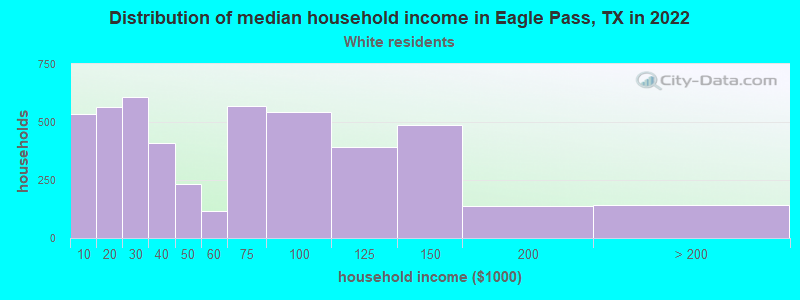
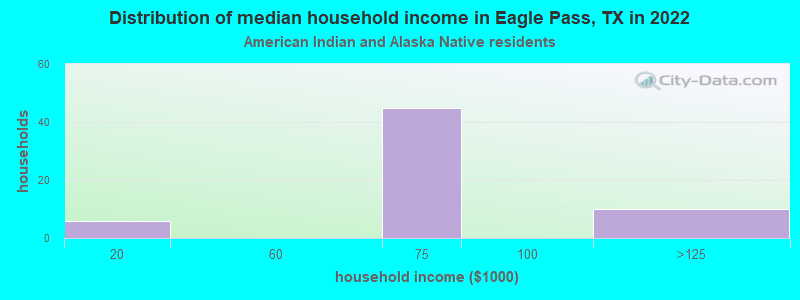
Income and house value in Eagle Pass Median household income in 2022 $73,013 White non-Hispanic householders$69,097 American Indian and Alaska Native householders$69,005 Some other race householders$53,120 Two or more races householders$52,308 Hispanic or Latino race householdersMedian 2022 house value $267,929 White Non-Hispanic householders$205,856 Black or African American householders $300,866 Asian householders$213,773 Some other race householders$184,637 Two or more races householders$195,404 Hispanic or Latino householders
Median age by race in Eagle Pass
32.7 Median age for White residents32.4 32.9 34.0 Median age for Black or African American residents34.6 33.8 34.4 Median age for American Indian / Alaska Native residents34.4 33.4 -681,278,538.1 Median age for Asian residents-683,426,442.5 -679,245,282.3 -581,560,283.1 Median age for Native Hawaiian / Pacific Islander residents-612,729,233.5 -577,777,777.2 29.8 Median age for Other race residents28.6 36.8 28.7 Median age for Two or more races residents30.8 28.0 31.1 Median age for White alone residents36.1 28.8 30.3 Median age for Hispanic or Latino residents30.4 30.4
Owner/renter occupied households by race in Eagle Pass
House owners and renters - White residents 2,832 59.1% Owner occupied1,963 40.9% Renter occupiedHouse owners and renters - Black or African American residents 12 100.0% Renter occupiedHouse owners and renters - American Indian / Alaska Native residents 16 29.1% Owner occupied40 70.9% Renter occupiedHouse owners and renters - Asian residents 14 100.0% Renter occupiedHouse owners and renters - Other race residents 618 67.7% Owner occupied295 32.3% Renter occupiedHouse owners and renters - Two or more races residents 2,700 52.9% Owner occupied2,401 47.1% Renter occupiedHouse owners and renters - White alone residents 143 62.5% Owner occupied86 37.5% Renter occupiedHouse owners and renters - Hispanic or Latino residents 5,443 56.9% Owner occupied4,124 43.1% Renter occupied
Language usage in Eagle Pass
English speakers - Total 13.5% of residents of Eagle Pass speak English at home.
85.7% of residents speak Spanish at home 13,977 62.1% Speak English very well8,541 37.9% Speak English less than very well0.1% of residents speak other language at home 14 37.8% Speak English very well23 62.2% Speak English less than very well
English speakers - Born in the United States 18.6% of residents of Eagle Pass speak English at home.
81.8% of residents speak Spanish at home 1,184 83.1% Speak English very well240 16.9% Speak English less than very well
English speakers - Native, born elsewhere 9.4% of residents of Eagle Pass speak English at home.
88.1% of residents speak Spanish at home 380 68.5% Speak English very well175 31.5% Speak English less than very well
English speakers - Foreign-born 3.5% of residents of Eagle Pass speak English at home.
95.0% of residents speak Spanish at home 2,389 29.7% Speak English very well5,668 70.3% Speak English less than very well0.4% of residents speak other language at home 14 37.8% Speak English very well23 62.2% Speak English less than very well
White (Caucasian) - Speak only English Native:
21.9% (1,934)Foreign-born:
5.1% (109)
White (Caucasian) - Speak another language Native:
46.9% (4,142)Foreign-born:
85.8% (1,849)
Other race - Speak only English Native:
8.4% (116)Foreign-born:
9.9% (89)
Other race - Speak another language Native:
89.8% (1,231)Foreign-born:
90.4% (812)
Two or more races - Speak only English Native:
15.1% (1,504)Foreign-born:
3.3% (150)
Two or more races - Speak another language Native:
89.8% (8,915)Foreign-born:
96.9% (4,439)
White alone - Speak another language Native:
38.1% (316)Foreign-born:
99.8% (23)
Hispanic or Latino - Speak only English Native:
16.1% (2,760)Foreign-born:
3.8% (322)
Hispanic or Latino - Speak another language Native:
83.1% (14,219)Foreign-born:
96.0% (8,055)
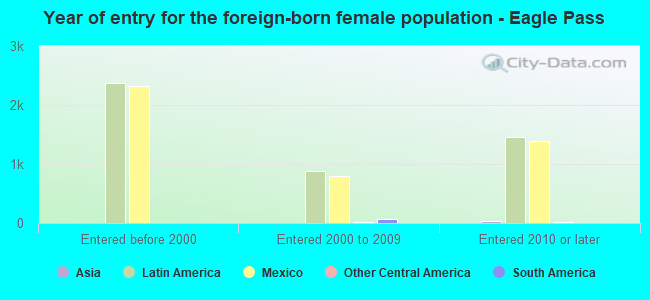
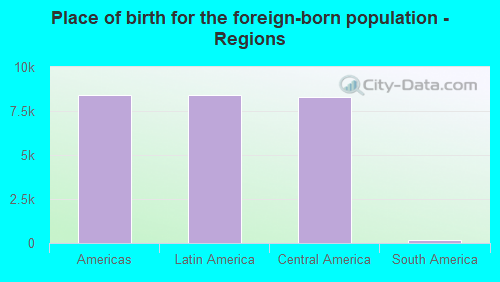
Foreign-born residents in Eagle Pass 8,484 residents are foreign born (28.9% Latin America ).
This city:
29.3%Texas:
17.1%
Marital status for residents in Eagle Pass Marital status - White (Caucasian) population 15 years and over
Males 32.8% Never married54.1% Now married2.5% Separated2.2% Widowed8.4% DivorcedFemales 36.6% Never married42.9% Now married6.3% Separated7.5% Widowed6.7% DivorcedWomen who gave birth in the past 12 months Now married:
77.4% (186)Unmarried:
22.6% (54)
Women who did not give birth in the past 12 months Now married:
41.3% (1,371)Unmarried:
58.7% (1,946)
Marital status - Black or African American population 15 years and over
Males 50.0% Never married0.0% Now married0.0% Separated0.0% Widowed50.0% DivorcedFemales 82.6% Never married17.4% Now married0.0% Separated0.0% Widowed0.0% DivorcedWomen who did not give birth in the past 12 months Now married:
0.0% (0)Unmarried:
100.0% (19)
Marital status - American Indian / Alaska Native population 15 years and over
Males 0.0% Never married100.0% Now married0.0% Separated0.0% Widowed0.0% DivorcedFemales 16.3% Never married81.6% Now married0.0% Separated0.0% Widowed2.0% DivorcedWomen who gave birth in the past 12 months Now married:
0.0% (0)Unmarried:
100.0% (11)
Women who did not give birth in the past 12 months Now married:
97.0% (46)Unmarried:
3.0% (1)
Marital status - Asian population 15 years and over
Males 0.0% Never married0.0% Now married0.0% Separated100.0% Widowed0.0% DivorcedFemales 0.0% Never married100.0% Now married0.0% Separated0.0% Widowed0.0% DivorcedWomen who did not give birth in the past 12 months Now married:
100.0% (25)Unmarried:
0.0% (0)
Marital status - Other race population 15 years and over
Males 30.1% Never married67.1% Now married0.0% Separated0.0% Widowed2.8% DivorcedFemales 5.4% Never married63.5% Now married4.1% Separated18.5% Widowed8.6% DivorcedWomen who gave birth in the past 12 months Now married:
86.8% (81)Unmarried:
13.2% (12)
Women who did not give birth in the past 12 months Now married:
77.1% (361)Unmarried:
22.9% (107)
Marital status - Two or more races population 15 years and over
Males 24.1% Never married60.0% Now married1.9% Separated3.2% Widowed10.8% DivorcedFemales 25.8% Never married49.4% Now married5.5% Separated12.4% Widowed6.9% DivorcedWomen who gave birth in the past 12 months Now married:
92.2% (173)Unmarried:
7.8% (15)
Women who did not give birth in the past 12 months Now married:
55.3% (1,981)Unmarried:
44.7% (1,601)
Marital status - White alone, not Hispanic / Latino population 15 years and over
Males 26.5% Never married57.7% Now married4.6% Separated0.0% Widowed11.1% DivorcedFemales 16.9% Never married44.0% Now married6.5% Separated11.4% Widowed21.2% DivorcedWomen who did not give birth in the past 12 months Now married:
76.7% (134)Unmarried:
23.3% (41)
Marital status - Hispanic or Latino population 15 years and over
Males 29.6% Never married57.3% Now married2.0% Separated2.4% Widowed8.7% DivorcedFemales 31.5% Never married46.5% Now married5.9% Separated9.6% Widowed6.5% DivorcedWomen who gave birth in the past 12 months Now married:
80.9% (411)Unmarried:
19.1% (97)
Women who did not give birth in the past 12 months Now married:
47.3% (3,194)Unmarried:
52.7% (3,565)
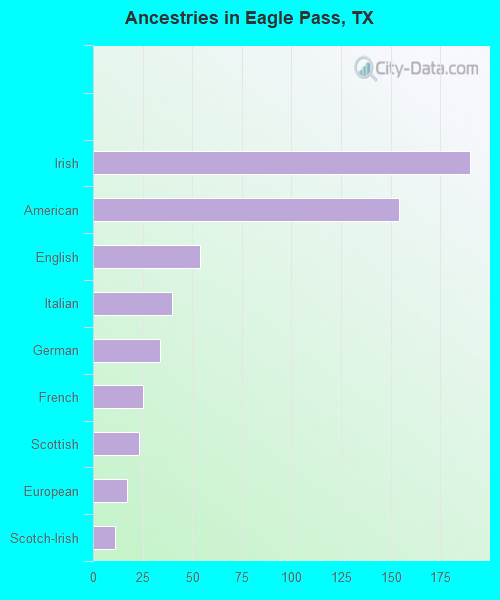
Ancestries in Eagle Pass
190 0.8% Irish154 0.6% American54 0.2% English40 0.2% Italian34 0.1% German25 0.1% French23 0.10% Scottish17 0.07% European11 0.05% Scotch-Irish
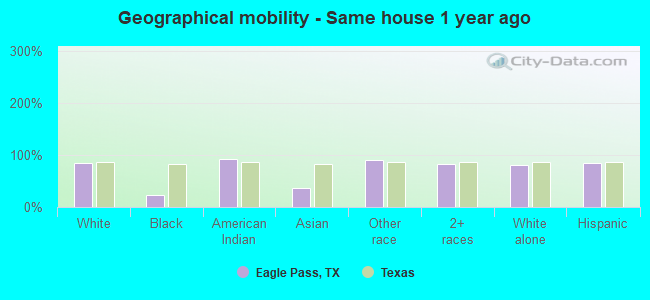
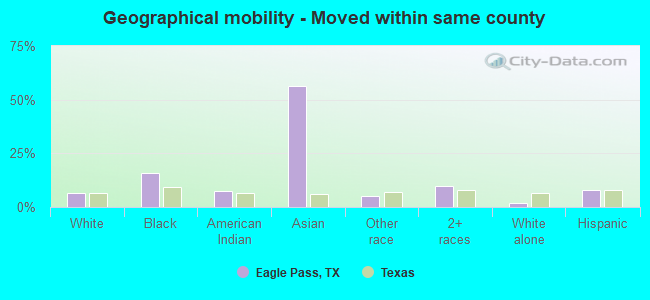
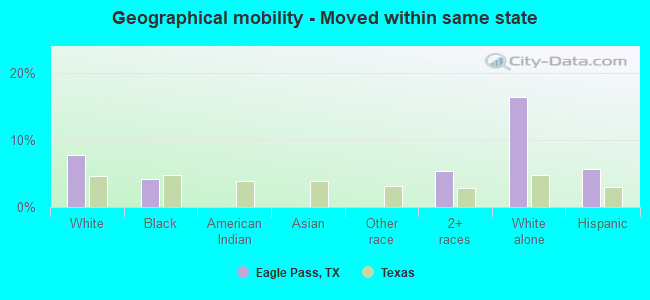
Geographical mobility in Eagle Pass Same house 1 year ago 11,190 85.1% White (Caucasian)11 22.7% Black or African American188 93.0% American Indian / Alaska Native14 35.8% Asian2,321 91.5% Other race13,031 82.5% Two or more races721 81.6% White alone, not Hispanic / Latino23,406 84.7% Hispanic or LatinoMoved within same county 861 6.5% White / Caucasian8 16.0% Black or African American15 7.7% American Indian / Alaska Native22 56.2% Asian125 4.9% Other race1,548 9.8% Two or more races15 1.7% White alone, not Hispanic / Latino2,170 7.9% Hispanic or LatinoMoved within same state 1,016 7.7% White / Caucasian2 4.2% Black or African American843 5.3% Two or more races146 16.5% White alone, not Hispanic / Latino1,583 5.7% Hispanic or LatinoMoved from different state 34 67.6% Black or African American71 0.5% Two or more races57 0.2% Hispanic or LatinoMoved from abroad 69 0.5% White106 4.2% Other race272 1.7% Two or more races9 1.0% White alone, not Hispanic / Latino357 1.3% Hispanic or Latino
Children Nativity (place of birth) in Eagle Pass
Children under 6 years - Living with two parents Both parents native 575 100.0% NativeBoth parents foreign-born 399 100.0% NativeOne native, one foreign-born parent 836 100.0% NativeChildren under 6 years - Living with one parent Native parent 959 100.0% NativeForeign-born parent 221 100.0% NativeChildren 6 to 17 years - Living with two parents Both parents native 945 100.0% NativeBoth parents foreign-born 629 98.6% Native9 1.4% Foreign-bornOne native, one foreign-born parent 872 94.9% Native47 5.1% Foreign-bornChildren 6 to 17 years - Living with one parent Native parent 1,074 100.0% NativeForeign-born parent 996 57.3% Native743 42.7% Foreign-born
Grandparents responsible for own grandchildren in Eagle Pass
Grandparents (30 to 59 years) White / Caucasian 91 51.9% Responsible for grandchildren85 48.1% Not responsible for grandchildrenOther race 20 42.0% Responsible for grandchildren28 58.0% Not responsible for grandchildrenTwo or more races 78 76.3% Responsible for grandchildren24 23.7% Not responsible for grandchildrenWhite alone, not Hispanic / Latino 21 100.0% Responsible for grandchildrenHispanic or Latino 176 51.6% Responsible for grandchildren165 48.4% Not responsible for grandchildrenGrandparents (60 years and over) White / Caucasian 95 39.6% Responsible for grandchildren145 60.4% Not responsible for grandchildrenOther race 56 100.0% Not responsible for grandchildrenTwo or more races 13 9.0% Responsible for grandchildren132 91.0% Not responsible for grandchildrenWhite alone, not Hispanic / Latino 15 51.1% Responsible for grandchildren14 48.9% Not responsible for grandchildrenHispanic or Latino 118 27.6% Responsible for grandchildren310 72.4% Not responsible for grandchildren