Carpinteria, California Submit your own pictures of this city and show them to the world
OSM Map
General Map
Google Map
MSN Map
OSM Map
General Map
Google Map
MSN Map
OSM Map
General Map
Google Map
MSN Map
OSM Map
General Map
Google Map
MSN Map
Please wait while loading the map...
Population in 2022: 12,950 (100% urban, 0% rural). Population change since 2000: -8.8%Males: 6,567 Females: 6,383
March 2022 cost of living index in Carpinteria: 117.8 (more than average, U.S. average is 100) Percentage of residents living in poverty in 2022: 5.4%for White Non-Hispanic residents , 9.6% for Black residents , 5.5% for Hispanic or Latino residents , 4.6% for other race residents , 2.9% for two or more races residents )
Profiles of local businesses
Business Search - 14 Million verified businesses
Data:
Median household income ($)
Median household income (% change since 2000)
Household income diversity
Ratio of average income to average house value (%)
Ratio of average income to average rent
Median household income ($) - White
Median household income ($) - Black or African American
Median household income ($) - Asian
Median household income ($) - Hispanic or Latino
Median household income ($) - American Indian and Alaska Native
Median household income ($) - Multirace
Median household income ($) - Other Race
Median household income for houses/condos with a mortgage ($)
Median household income for apartments without a mortgage ($)
Races - White alone (%)
Races - White alone (% change since 2000)
Races - Black alone (%)
Races - Black alone (% change since 2000)
Races - American Indian alone (%)
Races - American Indian alone (% change since 2000)
Races - Asian alone (%)
Races - Asian alone (% change since 2000)
Races - Hispanic (%)
Races - Hispanic (% change since 2000)
Races - Native Hawaiian and Other Pacific Islander alone (%)
Races - Native Hawaiian and Other Pacific Islander alone (% change since 2000)
Races - Two or more races (%)
Races - Two or more races (% change since 2000)
Races - Other race alone (%)
Races - Other race alone (% change since 2000)
Racial diversity
Unemployment (%)
Unemployment (% change since 2000)
Unemployment (%) - White
Unemployment (%) - Black or African American
Unemployment (%) - Asian
Unemployment (%) - Hispanic or Latino
Unemployment (%) - American Indian and Alaska Native
Unemployment (%) - Multirace
Unemployment (%) - Other Race
Population density (people per square mile)
Population - Males (%)
Population - Females (%)
Population - Males (%) - White
Population - Males (%) - Black or African American
Population - Males (%) - Asian
Population - Males (%) - Hispanic or Latino
Population - Males (%) - American Indian and Alaska Native
Population - Males (%) - Multirace
Population - Males (%) - Other Race
Population - Females (%) - White
Population - Females (%) - Black or African American
Population - Females (%) - Asian
Population - Females (%) - Hispanic or Latino
Population - Females (%) - American Indian and Alaska Native
Population - Females (%) - Multirace
Population - Females (%) - Other Race
Coronavirus confirmed cases (Apr 26, 2024)
Deaths caused by coronavirus (Apr 26, 2024)
Coronavirus confirmed cases (per 100k population) (Apr 26, 2024)
Deaths caused by coronavirus (per 100k population) (Apr 26, 2024)
Daily increase in number of cases (Apr 26, 2024)
Weekly increase in number of cases (Apr 26, 2024)
Cases doubled (in days) (Apr 26, 2024)
Hospitalized patients (Apr 18, 2022)
Negative test results (Apr 18, 2022)
Total test results (Apr 18, 2022)
COVID Vaccine doses distributed (per 100k population) (Sep 19, 2023)
COVID Vaccine doses administered (per 100k population) (Sep 19, 2023)
COVID Vaccine doses distributed (Sep 19, 2023)
COVID Vaccine doses administered (Sep 19, 2023)
Likely homosexual households (%)
Likely homosexual households (% change since 2000)
Likely homosexual households - Lesbian couples (%)
Likely homosexual households - Lesbian couples (% change since 2000)
Likely homosexual households - Gay men (%)
Likely homosexual households - Gay men (% change since 2000)
Cost of living index
Median gross rent ($)
Median contract rent ($)
Median monthly housing costs ($)
Median house or condo value ($)
Median house or condo value ($ change since 2000)
Mean house or condo value by units in structure - 1, detached ($)
Mean house or condo value by units in structure - 1, attached ($)
Mean house or condo value by units in structure - 2 ($)
Mean house or condo value by units in structure by units in structure - 3 or 4 ($)
Mean house or condo value by units in structure - 5 or more ($)
Mean house or condo value by units in structure - Boat, RV, van, etc. ($)
Mean house or condo value by units in structure - Mobile home ($)
Median house or condo value ($) - White
Median house or condo value ($) - Black or African American
Median house or condo value ($) - Asian
Median house or condo value ($) - Hispanic or Latino
Median house or condo value ($) - American Indian and Alaska Native
Median house or condo value ($) - Multirace
Median house or condo value ($) - Other Race
Median resident age
Resident age diversity
Median resident age - Males
Median resident age - Females
Median resident age - White
Median resident age - Black or African American
Median resident age - Asian
Median resident age - Hispanic or Latino
Median resident age - American Indian and Alaska Native
Median resident age - Multirace
Median resident age - Other Race
Median resident age - Males - White
Median resident age - Males - Black or African American
Median resident age - Males - Asian
Median resident age - Males - Hispanic or Latino
Median resident age - Males - American Indian and Alaska Native
Median resident age - Males - Multirace
Median resident age - Males - Other Race
Median resident age - Females - White
Median resident age - Females - Black or African American
Median resident age - Females - Asian
Median resident age - Females - Hispanic or Latino
Median resident age - Females - American Indian and Alaska Native
Median resident age - Females - Multirace
Median resident age - Females - Other Race
Commute - mean travel time to work (minutes)
Travel time to work - Less than 5 minutes (%)
Travel time to work - Less than 5 minutes (% change since 2000)
Travel time to work - 5 to 9 minutes (%)
Travel time to work - 5 to 9 minutes (% change since 2000)
Travel time to work - 10 to 19 minutes (%)
Travel time to work - 10 to 19 minutes (% change since 2000)
Travel time to work - 20 to 29 minutes (%)
Travel time to work - 20 to 29 minutes (% change since 2000)
Travel time to work - 30 to 39 minutes (%)
Travel time to work - 30 to 39 minutes (% change since 2000)
Travel time to work - 40 to 59 minutes (%)
Travel time to work - 40 to 59 minutes (% change since 2000)
Travel time to work - 60 to 89 minutes (%)
Travel time to work - 60 to 89 minutes (% change since 2000)
Travel time to work - 90 or more minutes (%)
Travel time to work - 90 or more minutes (% change since 2000)
Marital status - Never married (%)
Marital status - Now married (%)
Marital status - Separated (%)
Marital status - Widowed (%)
Marital status - Divorced (%)
Median family income ($)
Median family income (% change since 2000)
Median non-family income ($)
Median non-family income (% change since 2000)
Median per capita income ($)
Median per capita income (% change since 2000)
Median family income ($) - White
Median family income ($) - Black or African American
Median family income ($) - Asian
Median family income ($) - Hispanic or Latino
Median family income ($) - American Indian and Alaska Native
Median family income ($) - Multirace
Median family income ($) - Other Race
Median year house/condo built
Median year apartment built
Year house built - Built 2005 or later (%)
Year house built - Built 2000 to 2004 (%)
Year house built - Built 1990 to 1999 (%)
Year house built - Built 1980 to 1989 (%)
Year house built - Built 1970 to 1979 (%)
Year house built - Built 1960 to 1969 (%)
Year house built - Built 1950 to 1959 (%)
Year house built - Built 1940 to 1949 (%)
Year house built - Built 1939 or earlier (%)
Average household size
Household density (households per square mile)
Average household size - White
Average household size - Black or African American
Average household size - Asian
Average household size - Hispanic or Latino
Average household size - American Indian and Alaska Native
Average household size - Multirace
Average household size - Other Race
Occupied housing units (%)
Vacant housing units (%)
Owner occupied housing units (%)
Renter occupied housing units (%)
Vacancy status - For rent (%)
Vacancy status - For sale only (%)
Vacancy status - Rented or sold, not occupied (%)
Vacancy status - For seasonal, recreational, or occasional use (%)
Vacancy status - For migrant workers (%)
Vacancy status - Other vacant (%)
Residents with income below the poverty level (%)
Residents with income below 50% of the poverty level (%)
Children below poverty level (%)
Poor families by family type - Married-couple family (%)
Poor families by family type - Male, no wife present (%)
Poor families by family type - Female, no husband present (%)
Poverty status for native-born residents (%)
Poverty status for foreign-born residents (%)
Poverty among high school graduates not in families (%)
Poverty among people who did not graduate high school not in families (%)
Residents with income below the poverty level (%) - White
Residents with income below the poverty level (%) - Black or African American
Residents with income below the poverty level (%) - Asian
Residents with income below the poverty level (%) - Hispanic or Latino
Residents with income below the poverty level (%) - American Indian and Alaska Native
Residents with income below the poverty level (%) - Multirace
Residents with income below the poverty level (%) - Other Race
Air pollution - Air Quality Index (AQI)
Air pollution - CO
Air pollution - NO2
Air pollution - SO2
Air pollution - Ozone
Air pollution - PM10
Air pollution - PM25
Air pollution - Pb
Crime - Murders per 100,000 population
Crime - Rapes per 100,000 population
Crime - Robberies per 100,000 population
Crime - Assaults per 100,000 population
Crime - Burglaries per 100,000 population
Crime - Thefts per 100,000 population
Crime - Auto thefts per 100,000 population
Crime - Arson per 100,000 population
Crime - City-data.com crime index
Crime - Violent crime index
Crime - Property crime index
Crime - Murders per 100,000 population (5 year average)
Crime - Rapes per 100,000 population (5 year average)
Crime - Robberies per 100,000 population (5 year average)
Crime - Assaults per 100,000 population (5 year average)
Crime - Burglaries per 100,000 population (5 year average)
Crime - Thefts per 100,000 population (5 year average)
Crime - Auto thefts per 100,000 population (5 year average)
Crime - Arson per 100,000 population (5 year average)
Crime - City-data.com crime index (5 year average)
Crime - Violent crime index (5 year average)
Crime - Property crime index (5 year average)
1996 Presidential Elections Results (%) - Democratic Party (Clinton)
1996 Presidential Elections Results (%) - Republican Party (Dole)
1996 Presidential Elections Results (%) - Other
2000 Presidential Elections Results (%) - Democratic Party (Gore)
2000 Presidential Elections Results (%) - Republican Party (Bush)
2000 Presidential Elections Results (%) - Other
2004 Presidential Elections Results (%) - Democratic Party (Kerry)
2004 Presidential Elections Results (%) - Republican Party (Bush)
2004 Presidential Elections Results (%) - Other
2008 Presidential Elections Results (%) - Democratic Party (Obama)
2008 Presidential Elections Results (%) - Republican Party (McCain)
2008 Presidential Elections Results (%) - Other
2012 Presidential Elections Results (%) - Democratic Party (Obama)
2012 Presidential Elections Results (%) - Republican Party (Romney)
2012 Presidential Elections Results (%) - Other
2016 Presidential Elections Results (%) - Democratic Party (Clinton)
2016 Presidential Elections Results (%) - Republican Party (Trump)
2016 Presidential Elections Results (%) - Other
2020 Presidential Elections Results (%) - Democratic Party (Biden)
2020 Presidential Elections Results (%) - Republican Party (Trump)
2020 Presidential Elections Results (%) - Other
Ancestries Reported - Arab (%)
Ancestries Reported - Czech (%)
Ancestries Reported - Danish (%)
Ancestries Reported - Dutch (%)
Ancestries Reported - English (%)
Ancestries Reported - French (%)
Ancestries Reported - French Canadian (%)
Ancestries Reported - German (%)
Ancestries Reported - Greek (%)
Ancestries Reported - Hungarian (%)
Ancestries Reported - Irish (%)
Ancestries Reported - Italian (%)
Ancestries Reported - Lithuanian (%)
Ancestries Reported - Norwegian (%)
Ancestries Reported - Polish (%)
Ancestries Reported - Portuguese (%)
Ancestries Reported - Russian (%)
Ancestries Reported - Scotch-Irish (%)
Ancestries Reported - Scottish (%)
Ancestries Reported - Slovak (%)
Ancestries Reported - Subsaharan African (%)
Ancestries Reported - Swedish (%)
Ancestries Reported - Swiss (%)
Ancestries Reported - Ukrainian (%)
Ancestries Reported - United States (%)
Ancestries Reported - Welsh (%)
Ancestries Reported - West Indian (%)
Ancestries Reported - Other (%)
Educational Attainment - No schooling completed (%)
Educational Attainment - Less than high school (%)
Educational Attainment - High school or equivalent (%)
Educational Attainment - Less than 1 year of college (%)
Educational Attainment - 1 or more years of college (%)
Educational Attainment - Associate degree (%)
Educational Attainment - Bachelor's degree (%)
Educational Attainment - Master's degree (%)
Educational Attainment - Professional school degree (%)
Educational Attainment - Doctorate degree (%)
School Enrollment - Nursery, preschool (%)
School Enrollment - Kindergarten (%)
School Enrollment - Grade 1 to 4 (%)
School Enrollment - Grade 5 to 8 (%)
School Enrollment - Grade 9 to 12 (%)
School Enrollment - College undergrad (%)
School Enrollment - Graduate or professional (%)
School Enrollment - Not enrolled in school (%)
School enrollment - Public schools (%)
School enrollment - Private schools (%)
School enrollment - Not enrolled (%)
Median number of rooms in houses and condos
Median number of rooms in apartments
Housing units lacking complete plumbing facilities (%)
Housing units lacking complete kitchen facilities (%)
Density of houses
Urban houses (%)
Rural houses (%)
Households with people 60 years and over (%)
Households with people 65 years and over (%)
Households with people 75 years and over (%)
Households with one or more nonrelatives (%)
Households with no nonrelatives (%)
Population in households (%)
Family households (%)
Nonfamily households (%)
Population in families (%)
Family households with own children (%)
Median number of bedrooms in owner occupied houses
Mean number of bedrooms in owner occupied houses
Median number of bedrooms in renter occupied houses
Mean number of bedrooms in renter occupied houses
Median number of vehichles in owner occupied houses
Mean number of vehichles in owner occupied houses
Median number of vehichles in renter occupied houses
Mean number of vehichles in renter occupied houses
Mortgage status - with mortgage (%)
Mortgage status - with second mortgage (%)
Mortgage status - with home equity loan (%)
Mortgage status - with both second mortgage and home equity loan (%)
Mortgage status - without a mortgage (%)
Average family size
Average family size - White
Average family size - Black or African American
Average family size - Asian
Average family size - Hispanic or Latino
Average family size - American Indian and Alaska Native
Average family size - Multirace
Average family size - Other Race
Geographical mobility - Same house 1 year ago (%)
Geographical mobility - Moved within same county (%)
Geographical mobility - Moved from different county within same state (%)
Geographical mobility - Moved from different state (%)
Geographical mobility - Moved from abroad (%)
Place of birth - Born in state of residence (%)
Place of birth - Born in other state (%)
Place of birth - Native, outside of US (%)
Place of birth - Foreign born (%)
Housing units in structures - 1, detached (%)
Housing units in structures - 1, attached (%)
Housing units in structures - 2 (%)
Housing units in structures - 3 or 4 (%)
Housing units in structures - 5 to 9 (%)
Housing units in structures - 10 to 19 (%)
Housing units in structures - 20 to 49 (%)
Housing units in structures - 50 or more (%)
Housing units in structures - Mobile home (%)
Housing units in structures - Boat, RV, van, etc. (%)
House/condo owner moved in on average (years ago)
Renter moved in on average (years ago)
Year householder moved into unit - Moved in 1999 to March 2000 (%)
Year householder moved into unit - Moved in 1995 to 1998 (%)
Year householder moved into unit - Moved in 1990 to 1994 (%)
Year householder moved into unit - Moved in 1980 to 1989 (%)
Year householder moved into unit - Moved in 1970 to 1979 (%)
Year householder moved into unit - Moved in 1969 or earlier (%)
Means of transportation to work - Drove car alone (%)
Means of transportation to work - Carpooled (%)
Means of transportation to work - Public transportation (%)
Means of transportation to work - Bus or trolley bus (%)
Means of transportation to work - Streetcar or trolley car (%)
Means of transportation to work - Subway or elevated (%)
Means of transportation to work - Railroad (%)
Means of transportation to work - Ferryboat (%)
Means of transportation to work - Taxicab (%)
Means of transportation to work - Motorcycle (%)
Means of transportation to work - Bicycle (%)
Means of transportation to work - Walked (%)
Means of transportation to work - Other means (%)
Working at home (%)
Industry diversity
Most Common Industries - Agriculture, forestry, fishing and hunting, and mining (%)
Most Common Industries - Agriculture, forestry, fishing and hunting (%)
Most Common Industries - Mining, quarrying, and oil and gas extraction (%)
Most Common Industries - Construction (%)
Most Common Industries - Manufacturing (%)
Most Common Industries - Wholesale trade (%)
Most Common Industries - Retail trade (%)
Most Common Industries - Transportation and warehousing, and utilities (%)
Most Common Industries - Transportation and warehousing (%)
Most Common Industries - Utilities (%)
Most Common Industries - Information (%)
Most Common Industries - Finance and insurance, and real estate and rental and leasing (%)
Most Common Industries - Finance and insurance (%)
Most Common Industries - Real estate and rental and leasing (%)
Most Common Industries - Professional, scientific, and management, and administrative and waste management services (%)
Most Common Industries - Professional, scientific, and technical services (%)
Most Common Industries - Management of companies and enterprises (%)
Most Common Industries - Administrative and support and waste management services (%)
Most Common Industries - Educational services, and health care and social assistance (%)
Most Common Industries - Educational services (%)
Most Common Industries - Health care and social assistance (%)
Most Common Industries - Arts, entertainment, and recreation, and accommodation and food services (%)
Most Common Industries - Arts, entertainment, and recreation (%)
Most Common Industries - Accommodation and food services (%)
Most Common Industries - Other services, except public administration (%)
Most Common Industries - Public administration (%)
Occupation diversity
Most Common Occupations - Management, business, science, and arts occupations (%)
Most Common Occupations - Management, business, and financial occupations (%)
Most Common Occupations - Management occupations (%)
Most Common Occupations - Business and financial operations occupations (%)
Most Common Occupations - Computer, engineering, and science occupations (%)
Most Common Occupations - Computer and mathematical occupations (%)
Most Common Occupations - Architecture and engineering occupations (%)
Most Common Occupations - Life, physical, and social science occupations (%)
Most Common Occupations - Education, legal, community service, arts, and media occupations (%)
Most Common Occupations - Community and social service occupations (%)
Most Common Occupations - Legal occupations (%)
Most Common Occupations - Education, training, and library occupations (%)
Most Common Occupations - Arts, design, entertainment, sports, and media occupations (%)
Most Common Occupations - Healthcare practitioners and technical occupations (%)
Most Common Occupations - Health diagnosing and treating practitioners and other technical occupations (%)
Most Common Occupations - Health technologists and technicians (%)
Most Common Occupations - Service occupations (%)
Most Common Occupations - Healthcare support occupations (%)
Most Common Occupations - Protective service occupations (%)
Most Common Occupations - Fire fighting and prevention, and other protective service workers including supervisors (%)
Most Common Occupations - Law enforcement workers including supervisors (%)
Most Common Occupations - Food preparation and serving related occupations (%)
Most Common Occupations - Building and grounds cleaning and maintenance occupations (%)
Most Common Occupations - Personal care and service occupations (%)
Most Common Occupations - Sales and office occupations (%)
Most Common Occupations - Sales and related occupations (%)
Most Common Occupations - Office and administrative support occupations (%)
Most Common Occupations - Natural resources, construction, and maintenance occupations (%)
Most Common Occupations - Farming, fishing, and forestry occupations (%)
Most Common Occupations - Construction and extraction occupations (%)
Most Common Occupations - Installation, maintenance, and repair occupations (%)
Most Common Occupations - Production, transportation, and material moving occupations (%)
Most Common Occupations - Production occupations (%)
Most Common Occupations - Transportation occupations (%)
Most Common Occupations - Material moving occupations (%)
People in Group quarters - Institutionalized population (%)
People in Group quarters - Correctional institutions (%)
People in Group quarters - Federal prisons and detention centers (%)
People in Group quarters - Halfway houses (%)
People in Group quarters - Local jails and other confinement facilities (including police lockups) (%)
People in Group quarters - Military disciplinary barracks (%)
People in Group quarters - State prisons (%)
People in Group quarters - Other types of correctional institutions (%)
People in Group quarters - Nursing homes (%)
People in Group quarters - Hospitals/wards, hospices, and schools for the handicapped (%)
People in Group quarters - Hospitals/wards and hospices for chronically ill (%)
People in Group quarters - Hospices or homes for chronically ill (%)
People in Group quarters - Military hospitals or wards for chronically ill (%)
People in Group quarters - Other hospitals or wards for chronically ill (%)
People in Group quarters - Hospitals or wards for drug/alcohol abuse (%)
People in Group quarters - Mental (Psychiatric) hospitals or wards (%)
People in Group quarters - Schools, hospitals, or wards for the mentally retarded (%)
People in Group quarters - Schools, hospitals, or wards for the physically handicapped (%)
People in Group quarters - Institutions for the deaf (%)
People in Group quarters - Institutions for the blind (%)
People in Group quarters - Orthopedic wards and institutions for the physically handicapped (%)
People in Group quarters - Wards in general hospitals for patients who have no usual home elsewhere (%)
People in Group quarters - Wards in military hospitals for patients who have no usual home elsewhere (%)
People in Group quarters - Juvenile institutions (%)
People in Group quarters - Long-term care (%)
People in Group quarters - Homes for abused, dependent, and neglected children (%)
People in Group quarters - Residential treatment centers for emotionally disturbed children (%)
People in Group quarters - Training schools for juvenile delinquents (%)
People in Group quarters - Short-term care, detention or diagnostic centers for delinquent children (%)
People in Group quarters - Type of juvenile institution unknown (%)
People in Group quarters - Noninstitutionalized population (%)
People in Group quarters - College dormitories (includes college quarters off campus) (%)
People in Group quarters - Military quarters (%)
People in Group quarters - On base (%)
People in Group quarters - Barracks, unaccompanied personnel housing (UPH), (Enlisted/Officer), ;and similar group living quarters for military personnel (%)
People in Group quarters - Transient quarters for temporary residents (%)
People in Group quarters - Military ships (%)
People in Group quarters - Group homes (%)
People in Group quarters - Homes or halfway houses for drug/alcohol abuse (%)
People in Group quarters - Homes for the mentally ill (%)
People in Group quarters - Homes for the mentally retarded (%)
People in Group quarters - Homes for the physically handicapped (%)
People in Group quarters - Other group homes (%)
People in Group quarters - Religious group quarters (%)
People in Group quarters - Dormitories (%)
People in Group quarters - Agriculture workers' dormitories on farms (%)
People in Group quarters - Job Corps and vocational training facilities (%)
People in Group quarters - Other workers' dormitories (%)
People in Group quarters - Crews of maritime vessels (%)
People in Group quarters - Other nonhousehold living situations (%)
People in Group quarters - Other noninstitutional group quarters (%)
Residents speaking English at home (%)
Residents speaking English at home - Born in the United States (%)
Residents speaking English at home - Native, born elsewhere (%)
Residents speaking English at home - Foreign born (%)
Residents speaking Spanish at home (%)
Residents speaking Spanish at home - Born in the United States (%)
Residents speaking Spanish at home - Native, born elsewhere (%)
Residents speaking Spanish at home - Foreign born (%)
Residents speaking other language at home (%)
Residents speaking other language at home - Born in the United States (%)
Residents speaking other language at home - Native, born elsewhere (%)
Residents speaking other language at home - Foreign born (%)
Class of Workers - Employee of private company (%)
Class of Workers - Self-employed in own incorporated business (%)
Class of Workers - Private not-for-profit wage and salary workers (%)
Class of Workers - Local government workers (%)
Class of Workers - State government workers (%)
Class of Workers - Federal government workers (%)
Class of Workers - Self-employed workers in own not incorporated business and Unpaid family workers (%)
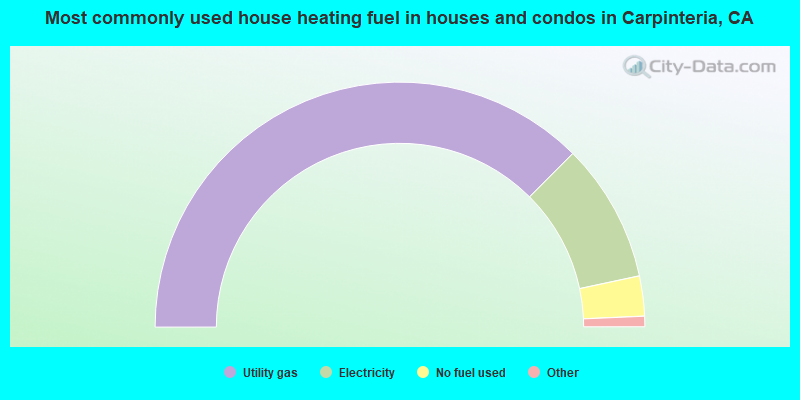
House heating fuel used in houses and condos - Utility gas (%)
House heating fuel used in houses and condos - Bottled, tank, or LP gas (%)
House heating fuel used in houses and condos - Electricity (%)
House heating fuel used in houses and condos - Fuel oil, kerosene, etc. (%)
House heating fuel used in houses and condos - Coal or coke (%)
House heating fuel used in houses and condos - Wood (%)
House heating fuel used in houses and condos - Solar energy (%)
House heating fuel used in houses and condos - Other fuel (%)
House heating fuel used in houses and condos - No fuel used (%)
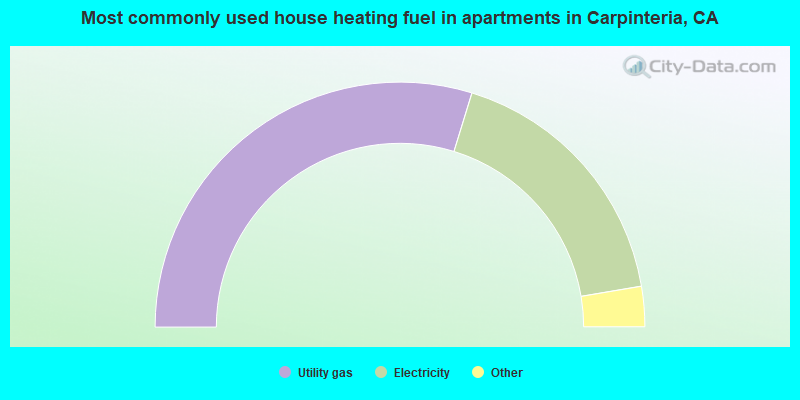
House heating fuel used in apartments - Utility gas (%)
House heating fuel used in apartments - Bottled, tank, or LP gas (%)
House heating fuel used in apartments - Electricity (%)
House heating fuel used in apartments - Fuel oil, kerosene, etc. (%)
House heating fuel used in apartments - Coal or coke (%)
House heating fuel used in apartments - Wood (%)
House heating fuel used in apartments - Solar energy (%)
House heating fuel used in apartments - Other fuel (%)
House heating fuel used in apartments - No fuel used (%)
Armed forces status - In Armed Forces (%)
Armed forces status - Civilian (%)
Armed forces status - Civilian - Veteran (%)
Armed forces status - Civilian - Nonveteran (%)
Fatal accidents locations in years 2005-2021
Fatal accidents locations in 2005
Fatal accidents locations in 2006
Fatal accidents locations in 2007
Fatal accidents locations in 2008
Fatal accidents locations in 2009
Fatal accidents locations in 2010
Fatal accidents locations in 2011
Fatal accidents locations in 2012
Fatal accidents locations in 2013
Fatal accidents locations in 2014
Fatal accidents locations in 2015
Fatal accidents locations in 2016
Fatal accidents locations in 2017
Fatal accidents locations in 2018
Fatal accidents locations in 2019
Fatal accidents locations in 2020
Fatal accidents locations in 2021
Alcohol use - People drinking some alcohol every month (%)
Alcohol use - People not drinking at all (%)
Alcohol use - Average days/month drinking alcohol
Alcohol use - Average drinks/week
Alcohol use - Average days/year people drink much
Audiometry - Average condition of hearing (%)
Audiometry - People that can hear a whisper from across a quiet room (%)
Audiometry - People that can hear normal voice from across a quiet room (%)
Audiometry - Ears ringing, roaring, buzzing (%)
Audiometry - Had a job exposure to loud noise (%)
Audiometry - Had off-work exposure to loud noise (%)
Blood Pressure & Cholesterol - Has high blood pressure (%)
Blood Pressure & Cholesterol - Checking blood pressure at home (%)
Blood Pressure & Cholesterol - Frequently checking blood cholesterol (%)
Blood Pressure & Cholesterol - Has high cholesterol level (%)
Consumer Behavior - Money monthly spent on food at supermarket/grocery store
Consumer Behavior - Money monthly spent on food at other stores
Consumer Behavior - Money monthly spent on eating out
Consumer Behavior - Money monthly spent on carryout/delivered foods
Consumer Behavior - Income spent on food at supermarket/grocery store (%)
Consumer Behavior - Income spent on food at other stores (%)
Consumer Behavior - Income spent on eating out (%)
Consumer Behavior - Income spent on carryout/delivered foods (%)
Current Health Status - General health condition (%)
Current Health Status - Blood donors (%)
Current Health Status - Has blood ever tested for HIV virus (%)
Current Health Status - Left-handed people (%)
Dermatology - People using sunscreen (%)
Diabetes - Diabetics (%)
Diabetes - Had a blood test for high blood sugar (%)
Diabetes - People taking insulin (%)
Diet Behavior & Nutrition - Diet health (%)
Diet Behavior & Nutrition - Milk product consumption (# of products/month)
Diet Behavior & Nutrition - Meals not home prepared (#/week)
Diet Behavior & Nutrition - Meals from fast food or pizza place (#/week)
Diet Behavior & Nutrition - Ready-to-eat foods (#/month)
Diet Behavior & Nutrition - Frozen meals/pizza (#/month)
Drug Use - People that ever used marijuana or hashish (%)
Drug Use - Ever used hard drugs (%)
Drug Use - Ever used any form of cocaine (%)
Drug Use - Ever used heroin (%)
Drug Use - Ever used methamphetamine (%)
Health Insurance - People covered by health insurance (%)
Kidney Conditions-Urology - Avg. # of times urinating at night
Medical Conditions - People with asthma (%)
Medical Conditions - People with anemia (%)
Medical Conditions - People with psoriasis (%)
Medical Conditions - People with overweight (%)
Medical Conditions - Elderly people having difficulties in thinking or remembering (%)
Medical Conditions - People who ever received blood transfusion (%)
Medical Conditions - People having trouble seeing even with glass/contacts (%)
Medical Conditions - People with arthritis (%)
Medical Conditions - People with gout (%)
Medical Conditions - People with congestive heart failure (%)
Medical Conditions - People with coronary heart disease (%)
Medical Conditions - People with angina pectoris (%)
Medical Conditions - People who ever had heart attack (%)
Medical Conditions - People who ever had stroke (%)
Medical Conditions - People with emphysema (%)
Medical Conditions - People with thyroid problem (%)
Medical Conditions - People with chronic bronchitis (%)
Medical Conditions - People with any liver condition (%)
Medical Conditions - People who ever had cancer or malignancy (%)
Mental Health - People who have little interest in doing things (%)
Mental Health - People feeling down, depressed, or hopeless (%)
Mental Health - People who have trouble sleeping or sleeping too much (%)
Mental Health - People feeling tired or having little energy (%)
Mental Health - People with poor appetite or overeating (%)
Mental Health - People feeling bad about themself (%)
Mental Health - People who have trouble concentrating on things (%)
Mental Health - People moving or speaking slowly or too fast (%)
Mental Health - People having thoughts they would be better off dead (%)
Oral Health - Average years since last visit a dentist
Oral Health - People embarrassed because of mouth (%)
Oral Health - People with gum disease (%)
Oral Health - General health of teeth and gums (%)
Oral Health - Average days a week using dental floss/device
Oral Health - Average days a week using mouthwash for dental problem
Oral Health - Average number of teeth
Pesticide Use - Households using pesticides to control insects (%)
Pesticide Use - Households using pesticides to kill weeds (%)
Physical Activity - People doing vigorous-intensity work activities (%)
Physical Activity - People doing moderate-intensity work activities (%)
Physical Activity - People walking or bicycling (%)
Physical Activity - People doing vigorous-intensity recreational activities (%)
Physical Activity - People doing moderate-intensity recreational activities (%)
Physical Activity - Average hours a day doing sedentary activities
Physical Activity - Average hours a day watching TV or videos
Physical Activity - Average hours a day using computer
Physical Functioning - People having limitations keeping them from working (%)
Physical Functioning - People limited in amount of work they can do (%)
Physical Functioning - People that need special equipment to walk (%)
Physical Functioning - People experiencing confusion/memory problems (%)
Physical Functioning - People requiring special healthcare equipment (%)
Prescription Medications - Average number of prescription medicines taking
Preventive Aspirin Use - Adults 40+ taking low-dose aspirin (%)
Reproductive Health - Vaginal deliveries (%)
Reproductive Health - Cesarean deliveries (%)
Reproductive Health - Deliveries resulted in a live birth (%)
Reproductive Health - Pregnancies resulted in a delivery (%)
Reproductive Health - Women breastfeeding newborns (%)
Reproductive Health - Women that had a hysterectomy (%)
Reproductive Health - Women that had both ovaries removed (%)
Reproductive Health - Women that have ever taken birth control pills (%)
Reproductive Health - Women taking birth control pills (%)
Reproductive Health - Women that have ever used Depo-Provera or injectables (%)
Reproductive Health - Women that have ever used female hormones (%)
Sexual Behavior - People 18+ that ever had sex (vaginal, anal, or oral) (%)
Sexual Behavior - Males 18+ that ever had vaginal sex with a woman (%)
Sexual Behavior - Males 18+ that ever performed oral sex on a woman (%)
Sexual Behavior - Males 18+ that ever had anal sex with a woman (%)
Sexual Behavior - Males 18+ that ever had any sex with a man (%)
Sexual Behavior - Females 18+ that ever had vaginal sex with a man (%)
Sexual Behavior - Females 18+ that ever performed oral sex on a man (%)
Sexual Behavior - Females 18+ that ever had anal sex with a man (%)
Sexual Behavior - Females 18+ that ever had any kind of sex with a woman (%)
Sexual Behavior - Average age people first had sex
Sexual Behavior - Average number of female sex partners in lifetime (males 18+)
Sexual Behavior - Average number of female vaginal sex partners in lifetime (males 18+)
Sexual Behavior - Average age people first performed oral sex on a woman (18+)
Sexual Behavior - Average number of woman performed oral sex on in lifetime (18+)
Sexual Behavior - Average number of male sex partners in lifetime (males 18+)
Sexual Behavior - Average number of male anal sex partners in lifetime (males 18+)
Sexual Behavior - Average age people first performed oral sex on a man (18+)
Sexual Behavior - Average number of male oral sex partners in lifetime (18+)
Sexual Behavior - People using protection when performing oral sex (%)
Sexual Behavior - Average number of times people have vaginal or anal sex a year
Sexual Behavior - People having sex without condom (%)
Sexual Behavior - Average number of male sex partners in lifetime (females 18+)
Sexual Behavior - Average number of male vaginal sex partners in lifetime (females 18+)
Sexual Behavior - Average number of female sex partners in lifetime (females 18+)
Sexual Behavior - Circumcised males 18+ (%)
Sleep Disorders - Average hours sleeping at night
Sleep Disorders - People that has trouble sleeping (%)
Smoking-Cigarette Use - People smoking cigarettes (%)
Taste & Smell - People 40+ having problems with smell (%)
Taste & Smell - People 40+ having problems with taste (%)
Taste & Smell - People 40+ that ever had wisdom teeth removed (%)
Taste & Smell - People 40+ that ever had tonsils teeth removed (%)
Taste & Smell - People 40+ that ever had a loss of consciousness because of a head injury (%)
Taste & Smell - People 40+ that ever had a broken nose or other serious injury to face or skull (%)
Taste & Smell - People 40+ that ever had two or more sinus infections (%)
Weight - Average height (inches)
Weight - Average weight (pounds)
Weight - Average BMI
Weight - People that are obese (%)
Weight - People that ever were obese (%)
Weight - People trying to lose weight (%)
6,402 48.7% White alone 5,769 43.9% Hispanic 482 3.7% Two or more races 273 2.1% Asian alone 109 0.8% Black alone 97 0.7% Other race alone
Officers per 1,000 residents here:
0.07California average:
1.98
Latest news from Carpinteria, CA collected exclusively by city-data.com from local newspapers, TV, and radio stations
Ancestries: German (6.5%), Irish (5.9%), American (3.6%), Scottish (3.1%), English (2.9%), European (2.4%).
Current Local Time:
Land area: 2.70 square miles.
Population density: 4,791 people per square mile (average).
2,923 residents are foreign born (16.8% Latin America , 3.3% Europe ).
This city:
22.2%California:
26.5%
Median real estate property taxes paid for housing units with mortgages in 2022: $6,284 (0.6%)Median real estate property taxes paid for housing units with no mortgage in 2022: $2,995 (0.4%)
Nearest city with pop. 50,000+: Santa Barbara, CA
Nearest city with pop. 200,000+: Los Angeles, CA
Nearest cities:
Latitude: 34.40 N, Longitude: 119.52 W
Daytime population change due to commuting: -227 (-1.7%)Workers who live and work in this city: 2,287 (35.0%)
Property values in Carpinteria, CA
Single-family new house construction building permits:
2022: 1 building , cost: $700,0002021: 9 buildings , average cost: $645,7002020: 5 buildings , average cost: $508,9002019: 12 buildings , average cost: $604,4002018: 4 buildings , average cost: $213,8002015: 5 buildings , average cost: $362,5002014: 4 buildings , average cost: $300,0002013: 4 buildings , average cost: $300,0002012: 56 buildings , average cost: $346,3002011: 8 buildings , average cost: $356,8002010: 2 buildings , average cost: $215,0002009: 4 buildings , average cost: $268,8002008: 1 building , cost: $300,0002007: 6 buildings , average cost: $383,3002006: 69 buildings , average cost: $153,8002005: 7 buildings , average cost: $173,5002004: 2 buildings , average cost: $181,4002003: 2 buildings , average cost: $97,5002002: 1 building , cost: $300,0002001: 2 buildings , average cost: $97,9002000: 4 buildings , average cost: $147,7001999: 20 buildings , average cost: $275,5001998: 14 buildings , average cost: $217,000Unemployment in December 2023:
Population change in the 1990s: +376 (+2.7%).
Most common industries in Carpinteria, CA (%)
Both Males Females
Educational services (9.7%)
Construction (9.7%)
Accommodation & food services (8.0%)
Health care (6.6%)
Professional, scientific, technical services (6.0%)
Administrative & support & waste management services (4.5%)
Miscellaneous nondurable goods merchant wholesalers (4.0%)
Construction (16.1%)
Educational services (8.0%)
Accommodation & food services (7.7%)
Administrative & support & waste management services (6.0%)
Miscellaneous nondurable goods merchant wholesalers (5.2%)
Professional, scientific, technical services (4.9%)
Agriculture, forestry, fishing & hunting (3.8%)
Health care (12.4%)
Educational services (12.0%)
Accommodation & food services (8.4%)
Professional, scientific, technical services (7.2%)
Miscellaneous manufacturing (5.3%)
Finance & insurance (5.0%)
Arts, entertainment, recreation (3.5%)
Most common occupations in Carpinteria, CA (%)
Both Males Females
Building and grounds cleaning and maintenance occupations (7.3%)
Other management occupations, except farmers and farm managers (5.5%)
Other office and administrative support workers, including supervisors (4.7%)
Material recording, scheduling, dispatching, and distributing workers (3.6%)
Other sales and related occupations, including supervisors (3.1%)
Agricultural workers, including supervisors (3.0%)
Information and record clerks, except customer service representatives (3.0%)
Building and grounds cleaning and maintenance occupations (9.7%)
Other management occupations, except farmers and farm managers (5.3%)
Material recording, scheduling, dispatching, and distributing workers (4.7%)
Agricultural workers, including supervisors (4.3%)
Driver/sales workers and truck drivers (3.6%)
Electrical equipment mechanics and other installation, maintenance, and repair workers, including supervisors (3.4%)
Construction traders workers except carpenters, electricians, painters, plumbers, and construction laborers (2.9%)
Other office and administrative support workers, including supervisors (7.6%)
Information and record clerks, except customer service representatives (5.9%)
Other management occupations, except farmers and farm managers (5.9%)
Preschool, kindergarten, elementary, and middle school teachers (4.6%)
Building and grounds cleaning and maintenance occupations (4.4%)
Secretaries and administrative assistants (4.3%)
Registered nurses (3.8%)
Earthquake activity:
Carpinteria-area historical earthquake activity is significantly above California state average. It is 6635% greater than the overall U.S. average. On 7/21/1952 at 11:52:14, a magnitude 7.7 (7.7 UK, Class: Major, Intensity: VIII - XII) earthquake occurred 50.9 miles away from Carpinteria center, causing $50,000,000 total damage On 11/4/1927 at 13:51:53, a magnitude 7.5 (7.5 UK) earthquake occurred 93.3 miles away from Carpinteria center On 6/28/1992 at 11:57:34, a magnitude 7.6 (6.2 MB, 7.6 MS, 7.3 MW, Depth: 0.7 mi) earthquake occurred 171.2 miles away from the city center, causing 3 deaths ( 1 shaking deaths, 2 other deaths) and 400 injuries, causing $100,000,000 total damage and $40,000,000 insured lossesOn 10/16/1999 at 09:46:44, a magnitude 7.4 (6.3 MB, 7.4 MS, 7.2 MW, 7.3 ML) earthquake occurred 175.9 miles away from the city center On 1/17/1994 at 12:30:55, a magnitude 6.8 (6.4 MB, 6.8 MS, 6.7 MW, Depth: 11.4 mi, Class: Strong, Intensity: VII - IX) earthquake occurred 56.4 miles away from Carpinteria center, causing 60 deaths ( 60 shaking deaths) and 7000 injuriesOn 4/18/1906 at 13:12:21, a magnitude 7.9 (7.9 UK) earthquake occurred 315.9 miles away from Carpinteria center, causing $524,000,000 total damage Magnitude types: body-wave magnitude (MB), local magnitude (ML), surface-wave magnitude (MS), moment magnitude (MW) Natural disasters: The number of natural disasters in Santa Barbara County (31) is a lot greater than the US average (15).Major Disasters (Presidential) Declared: 19Emergencies Declared: 3Floods: 17, Fires: 10, Storms: 8, Winter Storms: 8, Mudslides: 7, Landslides: 4, Drought: 1, Earthquake: 1, Freeze: 1, Hurricane: 1, Tornado: 1, Wind: 1, Other: 1 (Note: some incidents may be assigned to more than one category). Main business address for: Venoco, Inc. CRUDE PETROLEUM & NATURAL GAS ), QAD INC SERVICES-PREPACKAGED SOFTWARE ), CKE RESTAURANTS INC RETAIL-EATING PLACES ).
Hospitals and medical centers near Carpinteria: CASA DORINDA (Nursing Home, about 8 miles away; SANTA BARBARA, CA)
VISITING NURSE AND HOSPICE CARE OF SANTA BARBARA (Home Health Center, about 11 miles away; SANTA BARBARA, CA)
ASSISTED HEALTHCARE SERVICES (Home Health Center, about 11 miles away; SANTA BARBARA, CA)
SANTA BARBARA ARTIFICIAL KIDNEY CENTER, LLC (Dialysis Facility, about 12 miles away; SANTA BARBARA, CA)
FOREMOST HOME CARE OF CALIFORNIA, INC (Home Health Center, about 12 miles away; SANTA BARBARA, CA)
SANTA BARBARA CONVALESCENT HOSPITAL (Nursing Home, about 12 miles away; SANTA BARBARA, CA)
SANTA BARBARA COTTAGE CARE CENTER (Nursing Home, about 12 miles away; SANTA BARBARA, CA)
Amtrak station: CARPINTERIA (5TH ST. & LINDEN AVE.)
.
Services: fully wheelchair accessible, public payphones, full-service food facilities, free short-term parking, free long-term parking, call for taxi service.
Colleges/Universities in Carpinteria: Pacifica Graduate Institute Full-time enrollment: 775; Location: 249 Lambert Rd; Private, for-profit; Website: www.pacifica.edu; Offers Doctor's degree )
International Sports Sciences Association Location: 1015 Mark Ave; Private, for-profit; Website: www.issaonline.edu/)
Colleges/universities with over 2000 students nearest to Carpinteria:
Santa Barbara City College (about 11 miles; Santa Barbara, CA ; Full-time enrollment: 12,568)
Ventura College (about 19 miles; Ventura, CA ; FT enrollment: 8,460)
University of California-Santa Barbara (about 19 miles; Santa Barbara, CA ; FT enrollment: 22,806)
Oxnard College (about 27 miles; Oxnard, CA ; FT enrollment: 3,879)
California State University-Channel Islands (about 32 miles; Camarillo, CA ; FT enrollment: 4,163)
California Lutheran University (about 39 miles; Thousand Oaks, CA ; FT enrollment: 4,103)
Moorpark College (about 40 miles; Moorpark, CA ; FT enrollment: 9,338)
Public high schools in Carpinteria:
Private high school in Carpinteria: CATE SCHOOL Students: 276, Location: 1960 CATE MESA RD, Grades: 9-12)
Public elementary/middle schools in Carpinteria: CARPINTERIA MIDDLE Students: 516, Location: 5351 CARPINTERIA AVE., Grades: 6-8)CANALINO ELEMENTARY Students: 335, Location: 1480 LINDEN AVE., Grades: KG-5)ALISO ELEMENTARY Location: 4545 CARPINTERIA AVE., Grades: KG-5)
CARPINTERIA FAMILY Location: 1480 LINDEN AVE., Grades: KG-5)
Private elementary/middle school in Carpinteria: HOWARD CARDEN Students: 80, Location: 5315 FOOTHILL RD, Grades: PK-8)
See full list of schools located in Carpinteria
Notable locations in Carpinteria: (A) , Seaside Theatre (B) , Carpinteria Valley Museum of History (C) , Carpinteria Union School District Office (D) , Carpinteria Girls Club (E) , Carpinteria Civic Center (F) , Carpinteria City Hall (G) , Carpinteria Chamber of Commerce (H) , Carpinteria Branch Santa Barbara Public Library (I) , American Medical Response Station 1 (J) , Carpinteria - Summerland Fire Protection District Station 1 (K) . Display/hide their locations on the map
Shopping Center: (1) . Display/hide its location on the map
Main business address in Carpinteria include: (A) , QAD INC (B) , CKE RESTAURANTS INC (C) . Display/hide their locations on the map
Churches in Carpinteria include: (A) , Carpinteria Valley Baptist Church (B) , Church of Christ (C) , Faith Lutheran Church (D) , First Church of Christ Scientist (E) , Saint Joseph Catholic Church (F) , The Carpenters Chapel (G) . Display/hide their locations on the map
Creek: (A) . Display/hide its location on the map
Parks in Carpinteria include: (1) , El Carro Park (2) , Franklin Creek Park (3) , Heath Ranch Park (4) , Memorial Park (5) , Monte Vista Park (6) , Carpinteria State Beach (7) , Carpinteria City Beach (8) . Display/hide their locations on the map
Hotel:
Courts:
Santa Barbara County has a predicted average indoor radon screening level greater than 4 pCi/L (pico curies per liter) - Highest Potential Drinking water stations with addresses in Carpinteria and their reported violations in the past:
CARPINTERIA VALLEY WATER DISTRICT (Population served: 17,000, Purch surface water):
Past health violations:
MCL, Average - Between JUL-2013 and SEP-2013, Contaminant: TTHM. Follow-up actions: St AO (w/o penalty) issued (SEP-12-2013)
MCL, Average - Between APR-2013 and JUN-2013, Contaminant: TTHM. Follow-up actions: St AO (w/o penalty) issued (JUN-04-2013)
MCL, Average - Between JUL-2008 and SEP-2008, Contaminant: TTHM. Follow-up actions: St AO (w/o penalty) issued (SEP-12-2008), St Compliance achieved (SEP-12-2008)
MCL, Average - Between OCT-2005 and DEC-2005, Contaminant: TTHM
Average household size: This city:
2.7 peopleCalifornia:
2.9 people
Percentage of family households: This city:
66.0%Whole state:
68.7%
Percentage of households with unmarried partners: This city:
6.7%Whole state:
7.2%
Likely homosexual households (counted as self-reported same-sex unmarried-partner households)
Lesbian couples: 0.4% of all households Gay men: 0.2% of all households
16 people in group homes intended for adults in 2010people in other noninstitutional facilities in 2010People in group quarters in Carpinteria in 2000:
81 people in homes or halfway houses for drug/alcohol abuse
19 people in other noninstitutional group quarters
10 people in homes for the physically handicapped
6 people in schools, hospitals, or wards for the intellectually disabled
6 people in homes for the mentally ill
3 people in religious group quarters
Banks with branches in Carpinteria (2011 data):
Rabobank, National Association: Carpenteria Branch at 5030 Carpenteria Avenue, branch established on 2009/07/31. Info updated 2011/01/27: Bank assets: $11,745.0 mil, Deposits: $8,446.0 mil, headquarters in Roseville, CA, positive income , Agricultural Specialization, 124 total offices , Holding Company: Cooperatieve Centrale Raiffeisen-Boerenleenbank B.A., "rabobank Nederland
Santa Barbara Bank & Trust, National Association: Carpinteria Branch at 5420 Carpinteria Avenue, branch established on 1972/03/24. Info updated 2011/06/09: Bank assets: $5,847.9 mil, Deposits: $4,684.3 mil, headquarters in Santa Barbara, CA, positive income , Commercial Lending Specialization, 48 total offices , Holding Company: Sb Acquisition Company, Llc
Montecito Bank & Trust: Carpinteria Branch at 1023 Casitas Pass Road, branch established on 1986/01/06. Info updated 2009/04/07: Bank assets: $1,018.4 mil, Deposits: $875.7 mil, headquarters in Santa Barbara, CA, positive income , Commercial Lending Specialization, 10 total offices , Holding Company: Montecito Bancorp
JPMorgan Chase Bank, National Association: Carpinteria Branch at 5400 Carpinteria Avenue, branch established on 1934/11/01. Info updated 2011/11/10: Bank assets: $1,811,678.0 mil, Deposits: $1,190,738.0 mil, headquarters in Columbus, OH, positive income , International Specialization, 5577 total offices , Holding Company: Jpmorgan Chase & Co.
Bank of America, National Association: Carpinteria Branch at 4994 Carpinteria Avenue, branch established on 1911/06/02. Info updated 2009/11/18: Bank assets: $1,451,969.3 mil, Deposits: $1,077,176.8 mil, headquarters in Charlotte, NC, positive income , 5782 total offices , Holding Company: Bank Of America Corporation
For population 15 years and over in Carpinteria:
Never married: 26.1%Now married: 55.5%Separated: 2.2%Widowed: 5.8%Divorced: 10.4% For population 25 years and over in Carpinteria:
High school or higher: 84.9%Bachelor's degree or higher: 42.3%Graduate or professional degree: 15.7%Unemployed: 3.0%Mean travel time to work (commute): 20.0 minutes
Education Gini index (Inequality in education) Here:
14.4California average:
15.5
Religion statistics for Carpinteria, CA (based on Santa Barbara County data)
Religion Adherents Congregations Catholic 146,940 17 Evangelical Protestant 24,775 161 Other 15,951 58 Mainline Protestant 10,610 43 Black Protestant 1,979 13 Orthodox 1,536 7 None 222,104 -
Source: Clifford Grammich, Kirk Hadaway, Richard Houseal, Dale E.Jones, Alexei Krindatch, Richie Stanley and Richard H.Taylor. 2012. 2010 U.S.Religion Census: Religious Congregations & Membership Study. Association of Statisticians of American Religious Bodies. Jones, Dale E., et al. 2002. Congregations and Membership in the United States 2000. Nashville, TN: Glenmary Research Center. Graphs represent county-level data
Food Environment Statistics: Number of grocery stores : 105Santa Barbara County :
2.61 / 10,000 pop.California :
2.14 / 10,000 pop.
Number of supercenters and club stores : 2Here :
0.05 / 10,000 pop.California :
0.04 / 10,000 pop.
Number of convenience stores (no gas) : 30Here :
0.75 / 10,000 pop.California :
0.62 / 10,000 pop.
Number of convenience stores (with gas) : 74This county :
1.84 / 10,000 pop.California :
1.49 / 10,000 pop.
Number of full-service restaurants : 388Santa Barbara County :
9.65 / 10,000 pop.State :
7.42 / 10,000 pop.
Adult diabetes rate : Santa Barbara County :
7.3%California :
7.3%
Adult obesity rate : This county :
22.2%State :
21.3%
Low-income preschool obesity rate : This county :
18.3%California :
17.9%
Health and Nutrition: Healthy diet rate : Carpinteria:
48.4%State:
49.4%
Average overall health of teeth and gums : Here:
47.6%California:
48.0%
Average BMI : Carpinteria:
28.3California:
28.1
People feeling badly about themselves : Here:
22.0%California:
20.2%
People not drinking alcohol at all : This city:
9.4%State:
11.2%
Average hours sleeping at night : Overweight people : Here:
33.5%California:
31.5%
General health condition : This city:
55.4%State:
56.4%
Average condition of hearing : This city:
80.0%California:
80.9%
More about Health and Nutrition of Carpinteria, CA Residents
Local government employment and payroll (March 2022)
Function
Full-time employees
Monthly full-time payroll
Average yearly full-time wage
Part-time employees
Monthly part-time payroll
Other Government Administration
15 $136,825 $109,460 1 $1,614 Streets and Highways
13 $85,239 $78,682 0 $0 Parks and Recreation
4 $30,475 $91,425 27 $30,544 Financial Administration
2 $26,563 $159,378 0 $0 Other and Unallocable
0 $0 2 $740
Totals for Government
34 $279,102 $98,507 30 $32,898
Carpinteria government finances - Expenditure in 2017 (per resident):
Construction - Regular Highways: $173,000 ($13.36)
Parks and Recreation: $94,000 ($7.26)Current Operations - Central Staff Services: $3,768,000 ($290.97)
Police Protection: $3,548,000 ($273.98)Parks and Recreation: $1,859,000 ($143.55)Regular Highways: $1,426,000 ($110.12)Protective Inspection and Regulation - Other: $471,000 ($36.37)Financial Administration: $454,000 ($35.06)Housing and Community Development: $139,000 ($10.73)Health - Other: $69,000 ($5.33)Transit Utilities: $43,000 ($3.32)General - Other: $9,000 ($0.69)Parking Facilities: $2,000 ($0.15)General - Interest on Debt: $17,000 ($1.31)
Other Capital Outlay - Central Staff Services: $23,000 ($1.78)
Parks and Recreation: $5,000 ($0.39)
Carpinteria government finances - Revenue in 2017 (per resident):
Charges - Other: $774,000 ($59.77)
Parks and Recreation: $673,000 ($51.97)Federal Intergovernmental - General Local Government Support: $8,000 ($0.62)
Miscellaneous - Interest Earnings: $142,000 ($10.97)
Rents: $133,000 ($10.27)Special Assessments: $104,000 ($8.03)Fines and Forfeits: $87,000 ($6.72)Donations From Private Sources: $13,000 ($1.00)State Intergovernmental - Other: $1,249,000 ($96.45)
Highways: $264,000 ($20.39)General Local Government Support: $10,000 ($0.77)Tax - Property: $3,634,000 ($280.62)
General Sales and Gross Receipts: $2,708,000 ($209.11)Other Selective Sales: $2,504,000 ($193.36)Public Utilities Sales: $615,000 ($47.49)Other: $156,000 ($12.05)Other License: $152,000 ($11.74)Occupation and Business License - Other: $94,000 ($7.26)Documentary and Stock Transfer: $80,000 ($6.18)
Carpinteria government finances - Debt in 2017 (per resident):
Long Term Debt - Beginning Outstanding - Unspecified Public Purpose: $330,000 ($25.48)
Outstanding Unspecified Public Purpose: $170,000 ($13.13)Retired Unspecified Public Purpose: $160,000 ($12.36)
Carpinteria government finances - Cash and Securities in 2017 (per resident):
Other Funds - Cash and Securities: $15,486,000 ($1195.83)
Sinking Funds - Cash and Securities: $183,000 ($14.13)
4.93% of this county's 2021 resident taxpayers lived in other counties in 2020 ($102,533 average adjusted gross income )
Here:
4.93%California average:
5.19%
0.04% of residents moved from foreign countries ($459 average AGI )Santa Barbara County:
0.04%California average:
0.03%
Top counties from which taxpayers relocated into this county between 2020 and 2021:
6.09% of this county's 2020 resident taxpayers moved to other counties in 2021 ($82,188 average adjusted gross income )
Here:
6.09%California average:
6.14%
0.03% of residents moved to foreign countries ($259 average AGI )Santa Barbara County:
0.03%California average:
0.02%
Top counties to which taxpayers relocated from this county between 2020 and 2021:
Businesses in Carpinteria, CA
Name Count Name Count
7-Eleven 1 IHOP 1 Albertsons 1 McDonald's 1 Best Western 1 Motel 6 2 Blockbuster 1 RadioShack 1 CVS 1 Rite Aid 1 Carl\s Jr. 1 Starbucks 2 Curves 1 T-Mobile 1 Domino's Pizza 1 UPS 2 FedEx 5 Vans 1 H&R Block 1 Vons 1 Holiday Inn 1
Strongest AM radio stations in Carpinteria:
KTMS (990 AM; 5 kW; SANTA BARBARA, CA; Owner: CITICASTERS LICENSES, L.P.)
KGDP (660 AM; 50 kW; ORCUTT, CA; Owner: RADIO REPRESENTATIVES, INC.)
KACD (850 AM; 25 kW; THOUSAND OAKS, CA; Owner: CITICASTERS LICENSES, L.P.)
KSPN (710 AM; 50 kW; LOS ANGELES, CA; Owner: KABC-AM RADIO, INC.)
KLAC (570 AM; 50 kW; LOS ANGELES, CA; Owner: AMFM RADIO LICENSES, L.L.C.)
KOXR (910 AM; 5 kW; OXNARD, CA; Owner: LAZER BROADCASTING CORPORATION)
KIRN (670 AM; 35 kW; SIMI VALLEY, CA; Owner: LOTUS OXNARD CORP.)
KVTA (1520 AM; 10 kW; PORT HUENEME, CA; Owner: GOLD COAST BROADCASTING LLC)
KFI (640 AM; 50 kW; LOS ANGELES, CA; Owner: CAPSTAR TX LIMITED PARTNERSHIP)
KFWB (980 AM; 50 kW; LOS ANGELES, CA; Owner: INFINITY BROADCASTING OPERATIONS, INC.)
KNX (1070 AM; 50 kW; LOS ANGELES, CA; Owner: INFINITY BROADCASTING OPERATIONS, INC.)
KUNX (1590 AM; 5 kW; VENTURA, CA; Owner: GOLD COAST BROADCASTING LLC)
KBKO (1490 AM; 1 kW; SANTA BARBARA, CA; Owner: CITICASTERS LICENSES, L.P.)
Strongest FM radio stations in Carpinteria:
K254AH (98.7 FM; ISLA VISTA, CA; Owner: PACIFICA FOUNDATION, INC.)
K210CH (89.9 FM; OAK VIEW, CA; Owner: LIFE ON THE WAY COMMUNICATIONS, INC.)
KCAQ (104.7 FM; OXNARD, CA; Owner: GOLD COAST BROADCASTING LLC)
KOCP (95.9 FM; CAMARILLO, CA; Owner: GOLD COAST BROADCASTING LLC)
KFYV (105.5 FM; OJAI, CA; Owner: GOLD COAST BROADCASTING LLC)
K271AC (102.1 FM; OJAI, CA; Owner: SANTA MONICA COMMUNITY COLLEGE DIST.)
KTYD (99.9 FM; SANTA BARBARA, CA; Owner: CITICASTERS LICENSES, L.P.)
KHAY (100.7 FM; VENTURA, CA; Owner: CUMULUS LICENSING CORP.)
KSBX (89.5 FM; SANTA BARBARA, CA; Owner: KCBX, INC.)
KJEE (92.9 FM; MONTECITO, CA; Owner: MONTECITO, FM, INC)
K218CP (91.5 FM; SANTA BARBARA, CA; Owner: CALVARY CHAPEL OF TWIN FALLS, INC.)
KDB (93.7 FM; SANTA BARBARA, CA; Owner: PACIFIC BROADCASTING COMPANY)
KFAC (88.7 FM; SANTA BARBARA, CA; Owner: UNIVERSITY OF SOUTHERN CALIFORNIA)
KRAZ (105.9 FM; SANTA YNEZ, CA; Owner: KNIGHT BROADCASTING, INC.)
KRUZ (103.3 FM; SANTA BARBARA, CA; Owner: CUMULUS LICENSING CORP.)
KKSB (106.3 FM; GOLETA, CA; Owner: CUMULUS LICENSING CORP.)
KSPE-FM (94.5 FM; ELLWOOD, CA; Owner: CITICASTERS LICENSES, L.P.)
KMGQ (97.5 FM; SANTA BARBARA, CA; Owner: CUMULUS LICENSING CORP.)
KSBL (101.7 FM; CARPINTERIA, CA; Owner: CITICASTERS LICENSES, L.P.)
KCSB-FM (91.9 FM; SANTA BARBARA, CA; Owner: UNIVERSITY OF CALIFORNIA)
TV broadcast stations around Carpinteria:
KJLA (Channel 57; VENTURA, CA; Owner: KJLA, LLC)
KTRO-LP (Channel 50; LANCASTER, CA; Owner: ROBERT D. ADELMAN)
KVMM-CA (Channel 41; SANTA BARBARA, CA; Owner: CABALLERO TELEVISION TEXAS, L.L.C.)
KSBT-LP (Channel 32; SANTA BARBARA, CA; Owner: ARNOLD N. APPLEBAUM)
K49EK (Channel 49; SANTA BARBARA, CA; Owner: COASTLINE COMMUNICATIONS, INC.)
K46GC (Channel 46; SANTA BARBARA, CA; Owner: PENNY DRUCKER)
National Bridge Inventory (NBI) Statistics 32 Number of bridges325ft / 98.6m Total length $4,276,000 Total costs921,133 Total average daily traffic83,997 Total average daily truck traffic
New bridges - historical statistics
1 1910-1919 2 1920-1929 8 1950-1959 3 1960-1969 7 1970-1979 1 1980-1989 2 2000-2009 2 2010-2019 6 2020-2022
See full National Bridge Inventory statistics for Carpinteria, CA
Home Mortgage Disclosure Act Aggregated Statistics For Year 2009(Based on 3 partial tracts) A) FHA, FSA/RHS & VA B) Conventional C) Refinancings D) Home Improvement Loans E) Loans on Dwellings For 5+ Families F) Non-occupant Loans on G) Loans On Manufactured Number Average Value Number Average Value Number Average Value Number Average Value Number Average Value Number Average Value Number Average Value
LOANS ORIGINATED 8 $465,968 41 $355,336 140 $360,952 2 $292,445 1 $3,484,400 34 $466,808 6 $118,875 APPLICATIONS APPROVED, NOT ACCEPTED 1 $382,170 8 $365,045 16 $308,688 0 $0 0 $0 6 $274,388 0 $0 APPLICATIONS DENIED 0 $0 7 $439,594 46 $348,442 1 $425,850 1 $2,351,970 13 $405,505 3 $75,367 APPLICATIONS WITHDRAWN 1 $496,920 10 $329,771 33 $413,873 1 $324,930 0 $0 9 $495,510 1 $32,690 FILES CLOSED FOR INCOMPLETENESS 0 $0 0 $0 8 $305,764 1 $413,420 0 $0 3 $260,453 0 $0
Aggregated Statistics For Year 2008(Based on 3 partial tracts) A) FHA, FSA/RHS & VA B) Conventional C) Refinancings D) Home Improvement Loans E) Loans on Dwellings For 5+ Families F) Non-occupant Loans on G) Loans On Manufactured Number Average Value Number Average Value Number Average Value Number Average Value Number Average Value Number Average Value Number Average Value
LOANS ORIGINATED 3 $399,650 41 $358,271 79 $353,742 5 $225,908 1 $793,570 30 $418,795 15 $151,945 APPLICATIONS APPROVED, NOT ACCEPTED 0 $0 5 $292,022 17 $401,334 1 $141,830 0 $0 4 $447,092 2 $66,055 APPLICATIONS DENIED 2 $429,200 10 $586,908 34 $455,692 4 $260,250 0 $0 12 $776,801 7 $162,416 APPLICATIONS WITHDRAWN 1 $394,610 7 $350,689 13 $425,972 2 $142,430 0 $0 3 $357,477 2 $246,525 FILES CLOSED FOR INCOMPLETENESS 0 $0 3 $681,937 7 $478,513 1 $174,340 0 $0 1 $933,180 0 $0
Aggregated Statistics For Year 2007(Based on 3 partial tracts) B) Conventional C) Refinancings D) Home Improvement Loans E) Loans on Dwellings For 5+ Families F) Non-occupant Loans on G) Loans On Manufactured Number Average Value Number Average Value Number Average Value Number Average Value Number Average Value Number Average Value
LOANS ORIGINATED 62 $458,225 124 $417,999 17 $371,469 2 $1,019,185 43 $483,238 14 $122,639 APPLICATIONS APPROVED, NOT ACCEPTED 13 $452,812 39 $469,753 3 $420,433 0 $0 14 $487,904 4 $112,138 APPLICATIONS DENIED 28 $393,398 69 $598,185 3 $441,647 0 $0 23 $527,801 9 $113,016 APPLICATIONS WITHDRAWN 9 $357,472 26 $426,521 0 $0 0 $0 9 $427,800 1 $138,160 FILES CLOSED FOR INCOMPLETENESS 4 $529,042 12 $387,391 0 $0 0 $0 4 $254,418 0 $0
Aggregated Statistics For Year 2006(Based on 3 partial tracts) A) FHA, FSA/RHS & VA B) Conventional C) Refinancings D) Home Improvement Loans E) Loans on Dwellings For 5+ Families F) Non-occupant Loans on G) Loans On Manufactured Number Average Value Number Average Value Number Average Value Number Average Value Number Average Value Number Average Value Number Average Value
LOANS ORIGINATED 0 $0 57 $571,291 150 $428,642 19 $420,515 1 $1,245,950 60 $518,778 9 $146,867 APPLICATIONS APPROVED, NOT ACCEPTED 0 $0 10 $464,205 29 $490,825 3 $394,130 0 $0 6 $720,740 4 $106,735 APPLICATIONS DENIED 1 $150,700 39 $531,205 60 $447,590 7 $245,456 0 $0 18 $413,330 10 $119,868 APPLICATIONS WITHDRAWN 0 $0 8 $696,064 29 $517,125 2 $658,410 0 $0 7 $445,939 1 $93,930 FILES CLOSED FOR INCOMPLETENESS 0 $0 4 $387,190 10 $323,420 0 $0 0 $0 1 $616,230 3 $131,290
Aggregated Statistics For Year 2005(Based on 3 partial tracts) B) Conventional C) Refinancings D) Home Improvement Loans E) Loans on Dwellings For 5+ Families F) Non-occupant Loans on G) Loans On Manufactured Number Average Value Number Average Value Number Average Value Number Average Value Number Average Value Number Average Value
LOANS ORIGINATED 91 $481,624 185 $410,201 23 $383,493 3 $1,132,300 59 $402,602 19 $107,347 APPLICATIONS APPROVED, NOT ACCEPTED 19 $372,633 24 $372,529 7 $342,067 0 $0 9 $318,359 3 $65,280 APPLICATIONS DENIED 36 $431,552 60 $497,041 11 $232,112 0 $0 23 $515,463 14 $152,596 APPLICATIONS WITHDRAWN 26 $484,720 45 $465,267 7 $260,221 0 $0 13 $448,037 4 $149,380 FILES CLOSED FOR INCOMPLETENESS 4 $650,762 16 $442,940 1 $211,480 0 $0 2 $636,485 0 $0
Aggregated Statistics For Year 2004(Based on 3 partial tracts) B) Conventional C) Refinancings D) Home Improvement Loans E) Loans on Dwellings For 5+ Families F) Non-occupant Loans on G) Loans On Manufactured Number Average Value Number Average Value Number Average Value Number Average Value Number Average Value Number Average Value
LOANS ORIGINATED 129 $462,200 268 $331,905 20 $267,247 2 $956,235 82 $349,940 25 $103,475 APPLICATIONS APPROVED, NOT ACCEPTED 18 $469,698 33 $320,238 0 $0 0 $0 9 $372,187 2 $116,285 APPLICATIONS DENIED 35 $467,738 66 $319,723 13 $219,597 0 $0 12 $487,676 15 $110,129 APPLICATIONS WITHDRAWN 15 $451,509 49 $284,283 3 $85,983 0 $0 4 $375,682 4 $162,355 FILES CLOSED FOR INCOMPLETENESS 4 $580,030 8 $315,451 0 $0 0 $0 2 $445,105 0 $0
Aggregated Statistics For Year 2003(Based on 3 partial tracts) B) Conventional C) Refinancings D) Home Improvement Loans E) Loans on Dwellings For 5+ Families F) Non-occupant Loans on Number Average Value Number Average Value Number Average Value Number Average Value Number Average Value
LOANS ORIGINATED 112 $336,917 567 $261,205 6 $62,998 5 $1,402,312 119 $262,011 APPLICATIONS APPROVED, NOT ACCEPTED 21 $336,875 67 $272,974 2 $105,335 0 $0 13 $246,005 APPLICATIONS DENIED 19 $293,476 71 $254,586 3 $45,920 0 $0 12 $181,399 APPLICATIONS WITHDRAWN 12 $260,706 92 $230,932 3 $293,043 0 $0 17 $222,202 FILES CLOSED FOR INCOMPLETENESS 5 $269,820 16 $303,368 0 $0 0 $0 3 $307,737
Aggregated Statistics For Year 2002(Based on 3 partial tracts) A) FHA, FSA/RHS & VA B) Conventional C) Refinancings D) Home Improvement Loans E) Loans on Dwellings For 5+ Families F) Non-occupant Loans on Number Average Value Number Average Value Number Average Value Number Average Value Number Average Value Number Average Value
LOANS ORIGINATED 1 $228,230 123 $275,877 387 $248,702 7 $45,469 2 $770,925 70 $250,752 APPLICATIONS APPROVED, NOT ACCEPTED 0 $0 18 $269,097 56 $243,005 1 $41,920 0 $0 13 $195,411 APPLICATIONS DENIED 0 $0 17 $217,263 54 $253,816 3 $11,283 0 $0 7 $349,220 APPLICATIONS WITHDRAWN 0 $0 13 $311,778 46 $256,601 2 $24,270 0 $0 10 $226,249 FILES CLOSED FOR INCOMPLETENESS 1 $214,290 5 $398,116 17 $229,530 0 $0 0 $0 6 $274,730
Aggregated Statistics For Year 2001(Based on 3 partial tracts) B) Conventional C) Refinancings D) Home Improvement Loans E) Loans on Dwellings For 5+ Families F) Non-occupant Loans on Number Average Value Number Average Value Number Average Value Number Average Value Number Average Value
LOANS ORIGINATED 105 $230,582 280 $241,666 9 $45,510 5 $1,245,498 48 $217,373 APPLICATIONS APPROVED, NOT ACCEPTED 15 $138,538 32 $226,774 2 $18,670 1 $574,930 6 $229,285 APPLICATIONS DENIED 22 $195,508 57 $239,437 4 $37,452 0 $0 15 $200,887 APPLICATIONS WITHDRAWN 12 $180,592 33 $272,035 1 $16,990 0 $0 5 $246,126 FILES CLOSED FOR INCOMPLETENESS 6 $214,218 13 $208,026 0 $0 1 $513,950 1 $252,430
Aggregated Statistics For Year 2000(Based on 3 partial tracts) A) FHA, FSA/RHS & VA B) Conventional C) Refinancings D) Home Improvement Loans E) Loans on Dwellings For 5+ Families F) Non-occupant Loans on Number Average Value Number Average Value Number Average Value Number Average Value Number Average Value Number Average Value
LOANS ORIGINATED 0 $0 143 $222,157 90 $218,265 11 $52,950 3 $750,597 39 $215,559 APPLICATIONS APPROVED, NOT ACCEPTED 0 $0 26 $212,990 17 $211,183 2 $48,905 1 $958,210 7 $328,859 APPLICATIONS DENIED 1 $191,640 24 $199,308 30 $202,308 6 $48,692 2 $1,110,650 7 $206,249 APPLICATIONS WITHDRAWN 1 $132,420 22 $205,695 21 $180,521 1 $15,680 0 $0 2 $460,975 FILES CLOSED FOR INCOMPLETENESS 1 $191,640 2 $151,800 10 $199,958 1 $14,810 1 $1,236,960 1 $151,350
Aggregated Statistics For Year 1999(Based on 3 partial tracts) A) FHA, FSA/RHS & VA B) Conventional C) Refinancings D) Home Improvement Loans E) Loans on Dwellings For 5+ Families F) Non-occupant Loans on Number Average Value Number Average Value Number Average Value Number Average Value Number Average Value Number Average Value
LOANS ORIGINATED 6 $154,547 159 $207,282 169 $194,713 8 $51,610 2 $369,805 46 $210,942 APPLICATIONS APPROVED, NOT ACCEPTED 0 $0 24 $167,352 28 $164,800 3 $17,087 0 $0 7 $166,084 APPLICATIONS DENIED 1 $125,590 35 $199,523 53 $142,561 5 $25,084 1 $1,557,450 9 $215,806 APPLICATIONS WITHDRAWN 0 $0 16 $227,010 33 $177,946 1 $26,730 0 $0 6 $329,468 FILES CLOSED FOR INCOMPLETENESS 0 $0 5 $148,058 6 $178,010 0 $0 0 $0 1 $44,180
Detailed HMDA statistics for the following Tracts:
0016.01
, 0016.02 , 0017.02
Private Mortgage Insurance Companies Aggregated Statistics For Year 2009(Based on 3 partial tracts) A) Conventional C) Non-occupant Loans on Number Average Value Number Average Value
LOANS ORIGINATED 3 $364,987 0 $0 APPLICATIONS APPROVED, NOT ACCEPTED 4 $246,312 1 $263,590 APPLICATIONS DENIED 1 $361,510 0 $0 APPLICATIONS WITHDRAWN 0 $0 0 $0 FILES CLOSED FOR INCOMPLETENESS 0 $0 0 $0
Aggregated Statistics For Year 2008(Based on 3 partial tracts) A) Conventional B) Refinancings C) Non-occupant Loans on Number Average Value Number Average Value Number Average Value
LOANS ORIGINATED 4 $405,115 1 $469,070 1 $350,180 APPLICATIONS APPROVED, NOT ACCEPTED 1 $169,860 0 $0 0 $0 APPLICATIONS DENIED 1 $562,220 0 $0 0 $0 APPLICATIONS WITHDRAWN 0 $0 0 $0 0 $0 FILES CLOSED FOR INCOMPLETENESS 0 $0 0 $0 0 $0
Aggregated Statistics For Year 2007(Based on 2 partial tracts) B) Refinancings C) Non-occupant Loans on Number Average Value Number Average Value
LOANS ORIGINATED 0 $0 0 $0 APPLICATIONS APPROVED, NOT ACCEPTED 0 $0 0 $0 APPLICATIONS DENIED 0 $0 0 $0 APPLICATIONS WITHDRAWN 1 $404,190 1 $404,190 FILES CLOSED FOR INCOMPLETENESS 0 $0 0 $0
Aggregated Statistics For Year 2004(Based on 2 partial tracts) A) Conventional B) Refinancings Number Average Value Number Average Value
LOANS ORIGINATED 2 $342,465 1 $187,290 APPLICATIONS APPROVED, NOT ACCEPTED 0 $0 0 $0 APPLICATIONS DENIED 0 $0 0 $0 APPLICATIONS WITHDRAWN 0 $0 0 $0 FILES CLOSED FOR INCOMPLETENESS 0 $0 0 $0
Aggregated Statistics For Year 2003(Based on 3 partial tracts) A) Conventional B) Refinancings Number Average Value Number Average Value
LOANS ORIGINATED 4 $353,612 2 $300,990 APPLICATIONS APPROVED, NOT ACCEPTED 2 $322,305 0 $0 APPLICATIONS DENIED 0 $0 0 $0 APPLICATIONS WITHDRAWN 0 $0 0 $0 FILES CLOSED FOR INCOMPLETENESS 0 $0 0 $0
Aggregated Statistics For Year 2002(Based on 3 partial tracts) A) Conventional B) Refinancings C) Non-occupant Loans on Number Average Value Number Average Value Number Average Value
LOANS ORIGINATED 5 $287,810 0 $0 1 $262,200 APPLICATIONS APPROVED, NOT ACCEPTED 1 $353,240 2 $323,180 1 $262,200 APPLICATIONS DENIED 0 $0 0 $0 0 $0 APPLICATIONS WITHDRAWN 0 $0 0 $0 0 $0 FILES CLOSED FOR INCOMPLETENESS 0 $0 0 $0 0 $0
Aggregated Statistics For Year 2001(Based on 3 partial tracts) A) Conventional B) Refinancings C) Non-occupant Loans on Number Average Value Number Average Value Number Average Value
LOANS ORIGINATED 11 $301,940 1 $221,260 1 $177,700 APPLICATIONS APPROVED, NOT ACCEPTED 0 $0 0 $0 0 $0 APPLICATIONS DENIED 1 $293,560 0 $0 0 $0 APPLICATIONS WITHDRAWN 0 $0 0 $0 0 $0 FILES CLOSED FOR INCOMPLETENESS 0 $0 0 $0 0 $0
Aggregated Statistics For Year 2000(Based on 3 partial tracts) A) Conventional Number Average Value
LOANS ORIGINATED 7 $220,407 APPLICATIONS APPROVED, NOT ACCEPTED 6 $282,380 APPLICATIONS DENIED 0 $0 APPLICATIONS WITHDRAWN 1 $190,640 FILES CLOSED FOR INCOMPLETENESS 0 $0
Aggregated Statistics For Year 1999(Based on 3 partial tracts) A) Conventional B) Refinancings C) Non-occupant Loans on Number Average Value Number Average Value Number Average Value
LOANS ORIGINATED 14 $216,989 0 $0 1 $107,150 APPLICATIONS APPROVED, NOT ACCEPTED 2 $338,185 1 $286,560 0 $0 APPLICATIONS DENIED 2 $201,495 1 $141,930 0 $0 APPLICATIONS WITHDRAWN 0 $0 0 $0 0 $0 FILES CLOSED FOR INCOMPLETENESS 0 $0 0 $0 0 $0
Detailed PMIC statistics for the following Tracts:
0016.01
, 0016.02 , 0017.02 Fire-safe hotels and motels in Carpinteria, California:
Best Western Carpinteria Inn, 4558 Carpinteria Ave, Carpinteria, California 93103 Phone: (805) 684-0473
Holiday Inn Express Hotel & Suites, 5606 Carpinteria Ave, Carpinteria, California 93013 Phone: (888) 409-8300, Fax: (805) 566-9433
All 2 fire-safe hotels and motels in Carpinteria, California
Most common first names in Carpinteria, CA among deceased individuals Name Count Lived (average)
John 95 74.1 years William 89 74.9 years Robert 69 74.7 years Mary 66 79.3 years James 52 73.0 years Ruth 49 83.9 years George 47 78.3 years Margaret 46 81.8 years Richard 39 70.9 years Dorothy 37 81.9 years
Most common last names in Carpinteria, CA among deceased individuals Last name Count Lived (average)
Johnson 25 75.4 years Williams 19 71.7 years Anderson 16 80.9 years Brown 16 77.8 years Clark 15 77.2 years Ramirez 15 76.8 years Miller 15 83.9 years Davis 14 77.9 years Moreno 14 74.8 years Smith 13 67.9 years
Carpinteria compared to California state average:
Unemployed percentage significantly below state average. Black race population percentage significantly below state average. Median age above state average. Length of stay since moving in significantly above state average. Percentage of population with a bachelor's degree or higher above state average. Carpinteria on our top lists :
#32 on the list of "Top 101 cities with the most people taking a bicycle to work (population 5,000+)"
#82 on the list of "Top 101 cities with the most people taking a ferryboat to work (population 5,000+)"
#17 on the list of "Top 101 counties with the lowest Sulfur Oxides Annual air pollution readings in 2012 (µg/m3 )"
#32 on the list of "Top 101 counties with the highest Nitrogen Dioxide air pollution readings in 2012 (ppm)"
#38 on the list of "Top 101 counties with the lowest number of infant deaths per 1000 residents 2007-2013 (pop. 50,000+)"
#78 on the list of "Top 101 counties with the highest carbon monoxide air pollution readings in 2012 (ppm)"
#81 on the list of "Top 101 counties with the largest decrease in the number of infant deaths per 1000 residents 2000-2006 to 2007-2013 (pop. 50,000+)"
Top Patent Applicants
Sean Snow (33)
James Wright (9)
Ashish Ekbote (8)
Ben Weiss (7)
Peter Guschl (7)
Chris Outwater (6)
Elie Helou, Jr. (6)
Jeffrey W. Scott (6)
Riley Reese (5)
Mark Lucovsky (4)
Total of 180 patent applications in 2008-2024.


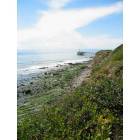
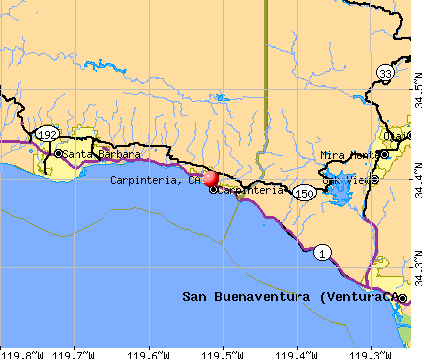


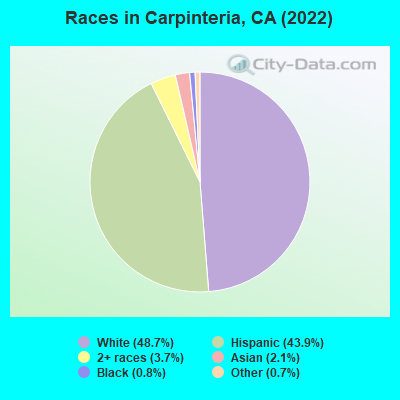
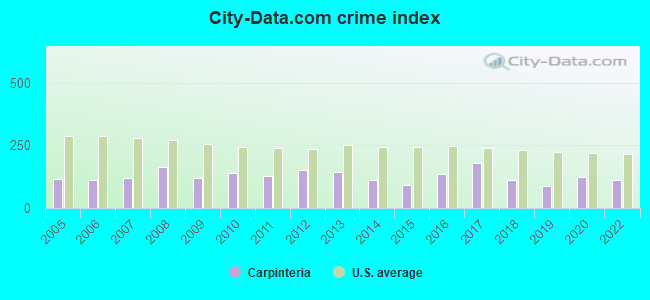
 Recent articles from our blog. Our writers, many of them Ph.D. graduates or candidates, create easy-to-read articles on a wide variety of topics.

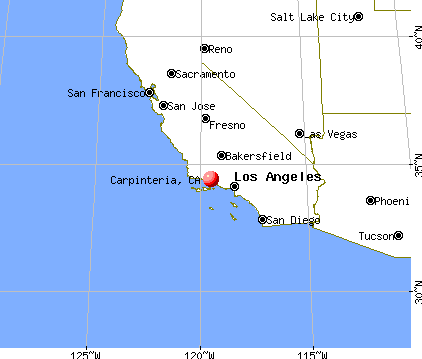
 (11.4 miles
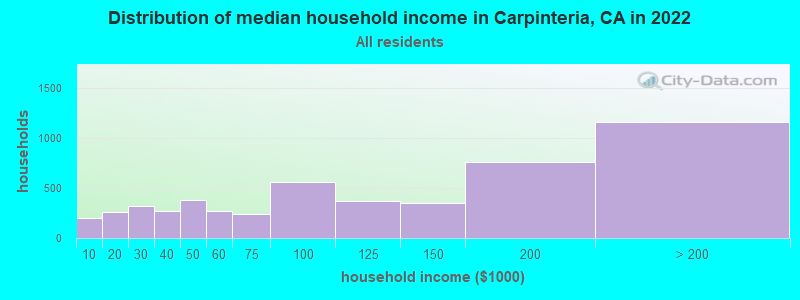
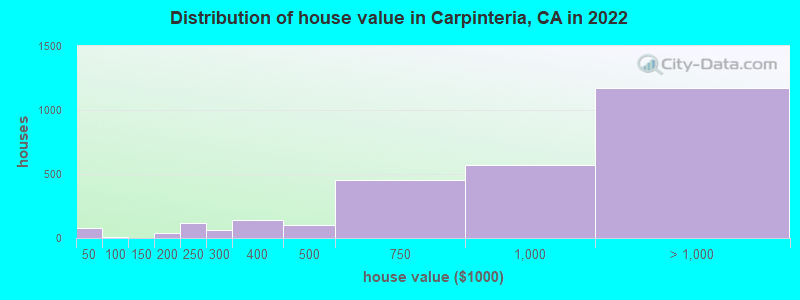

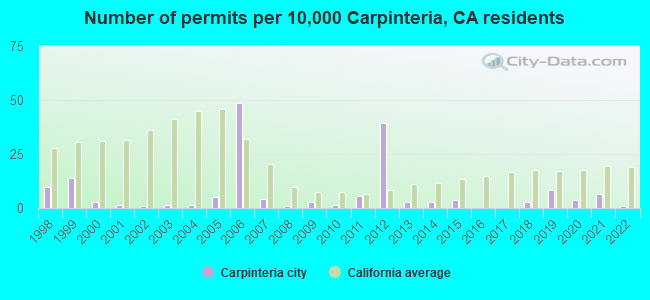
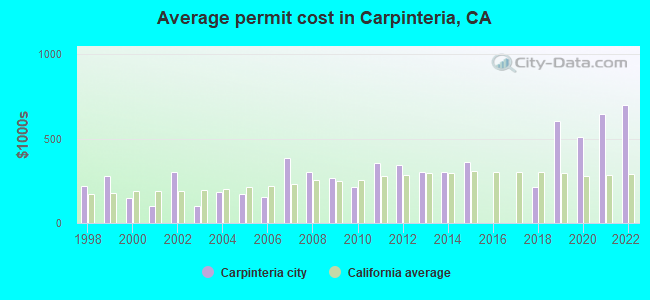
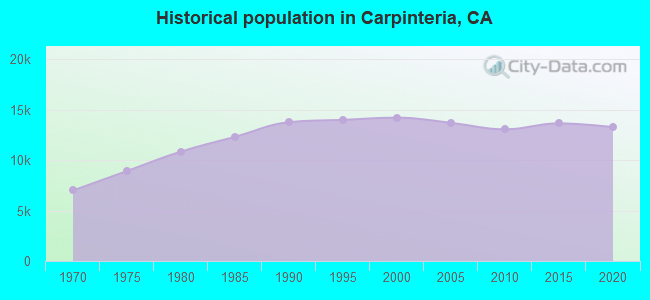
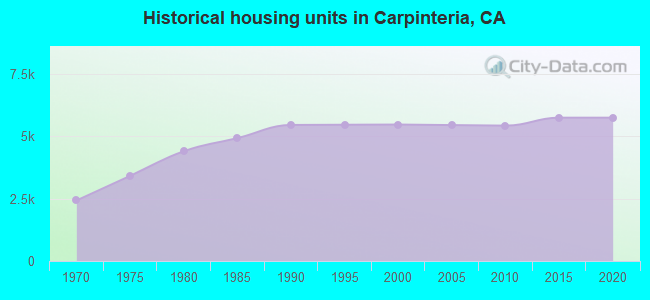
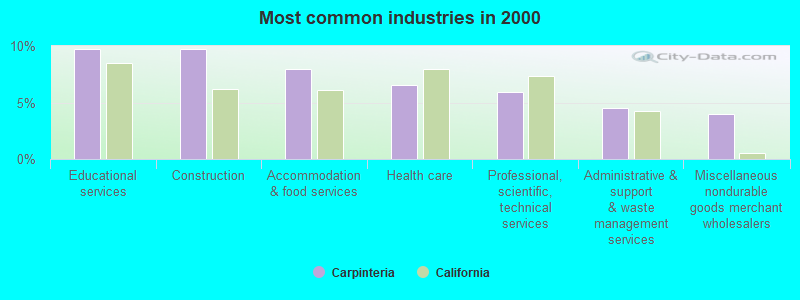
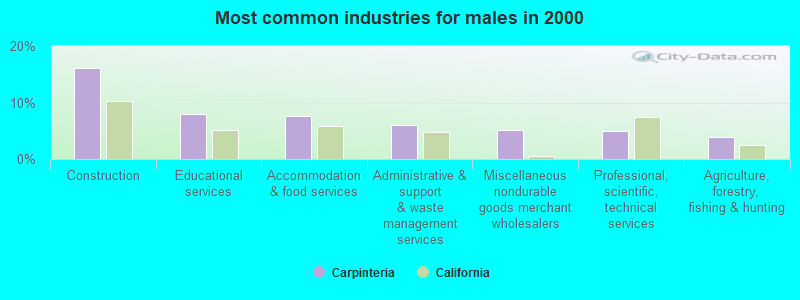
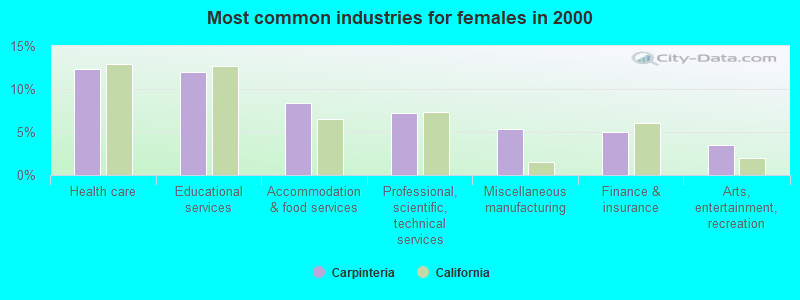
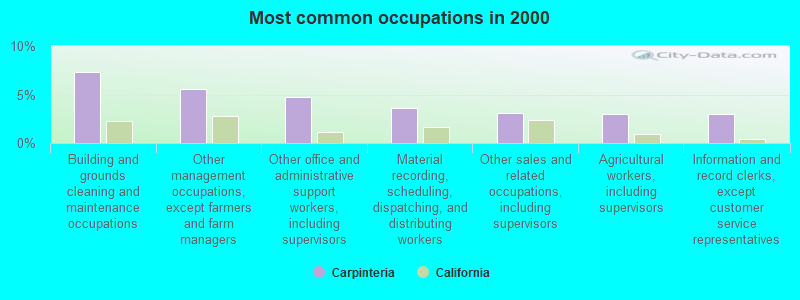
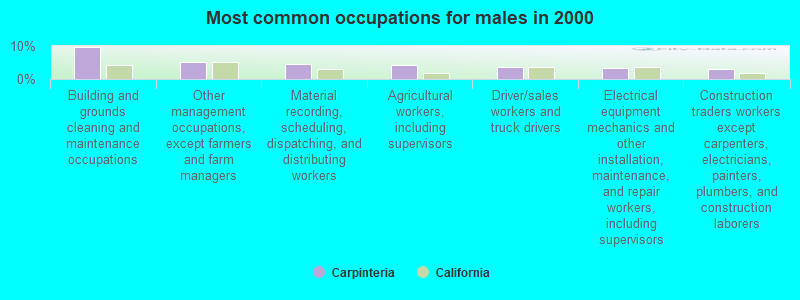
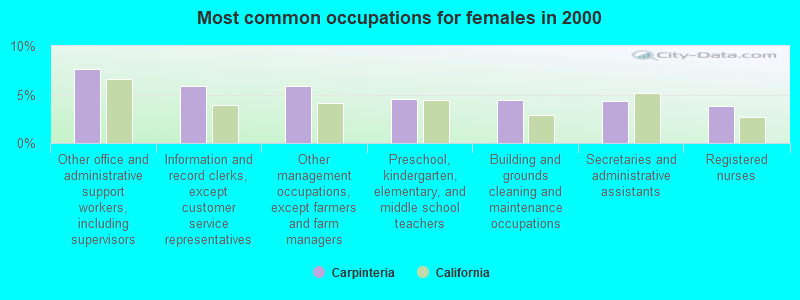
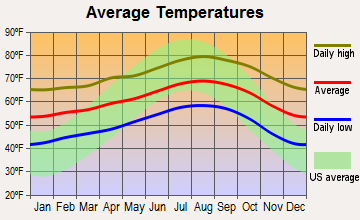

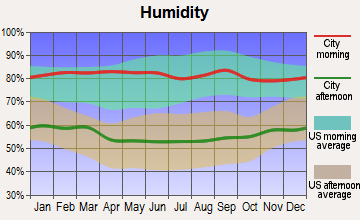
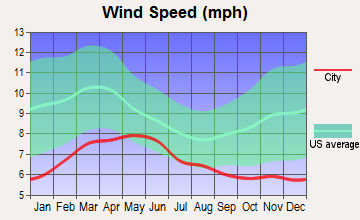
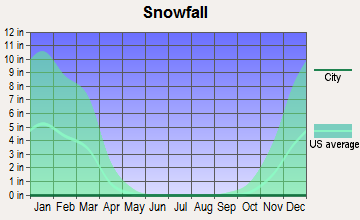
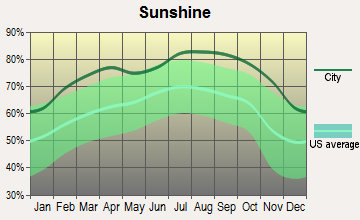
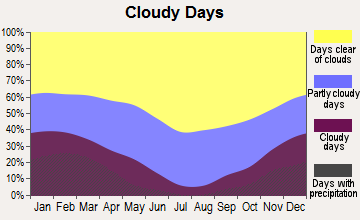


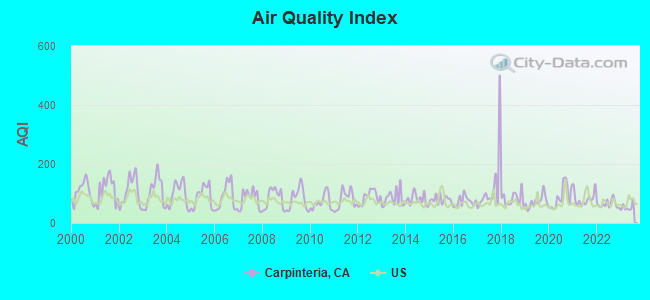
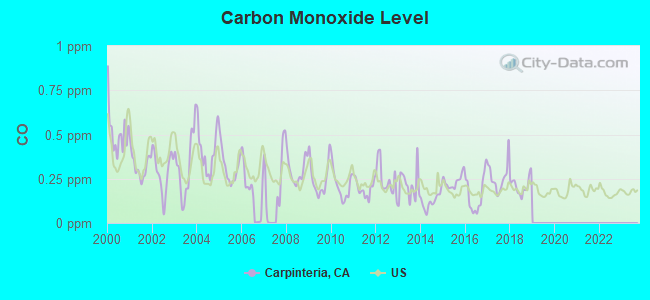
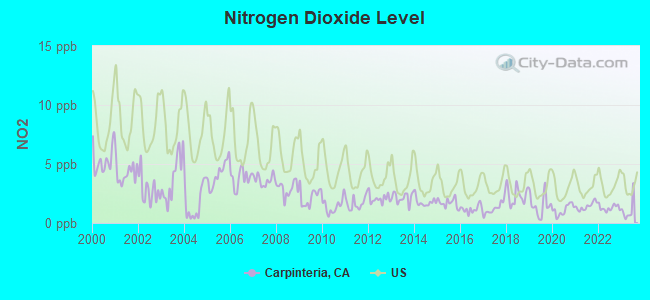
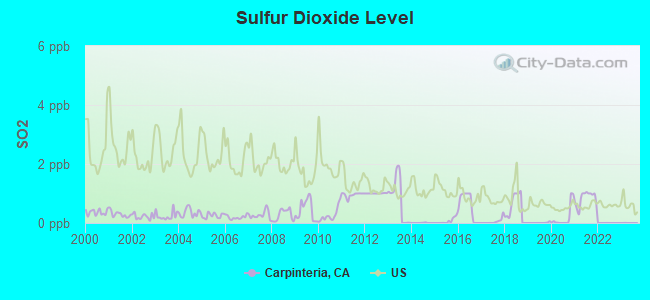
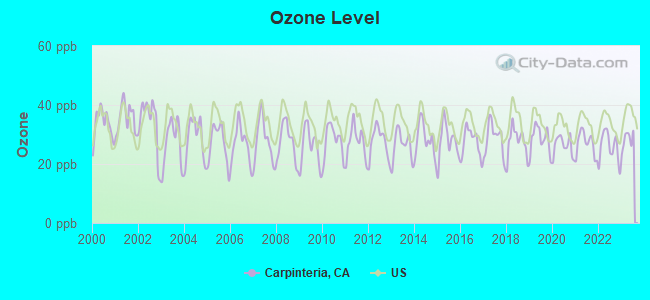
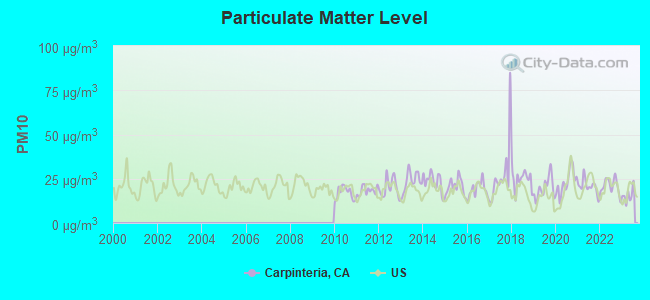
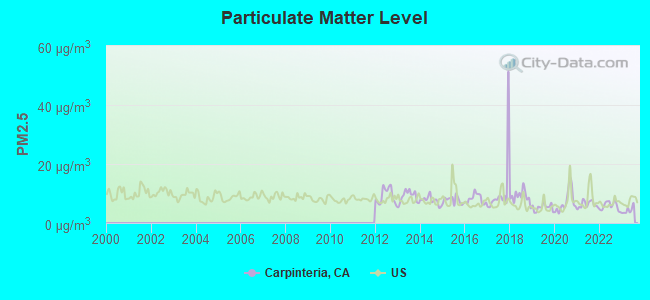
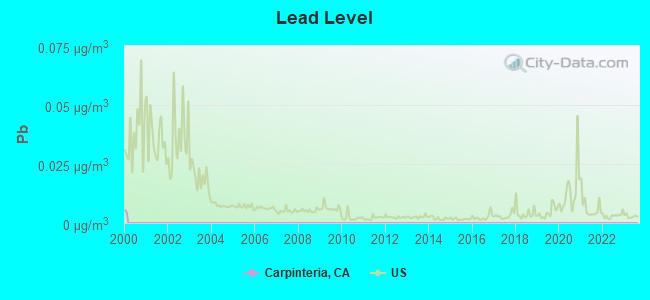
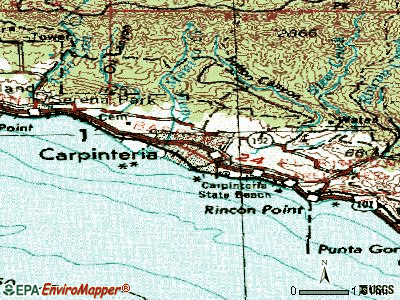
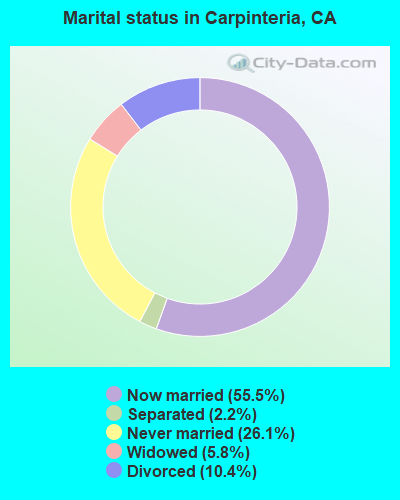
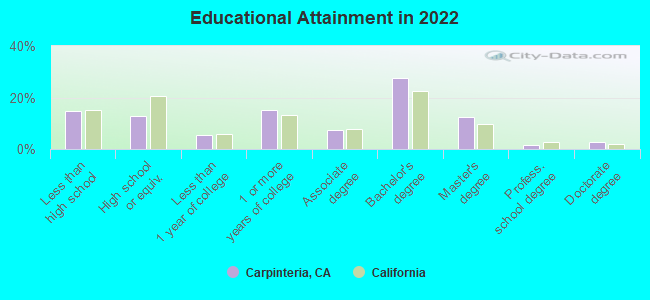
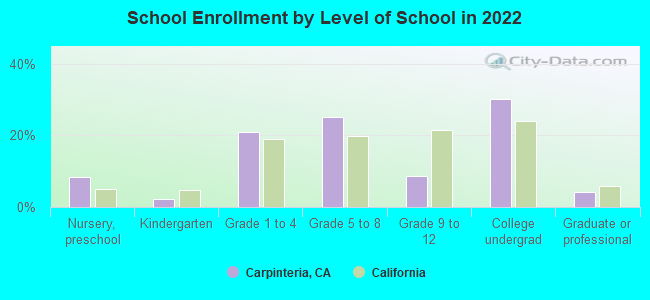
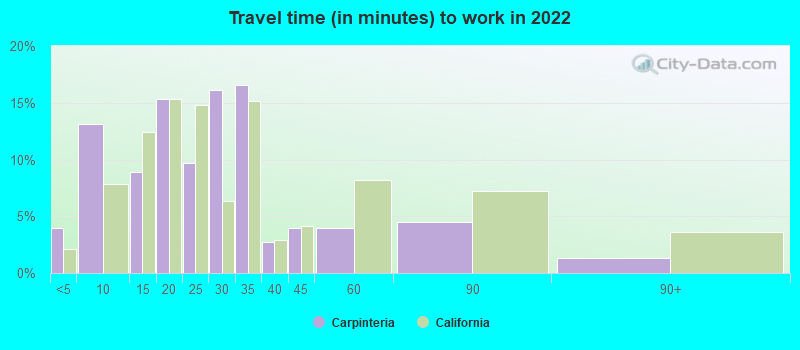
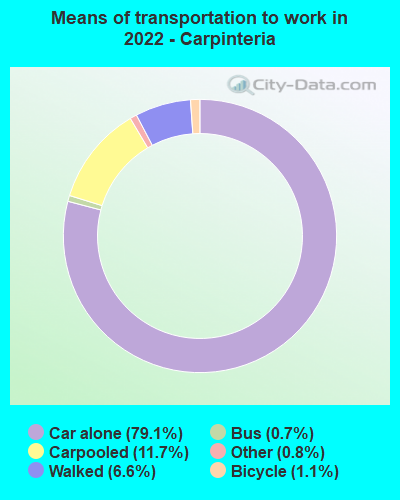
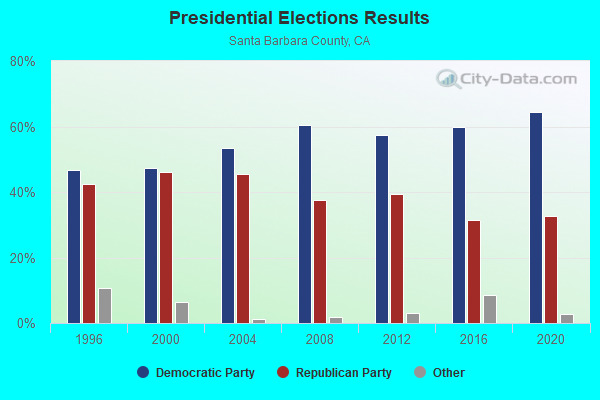
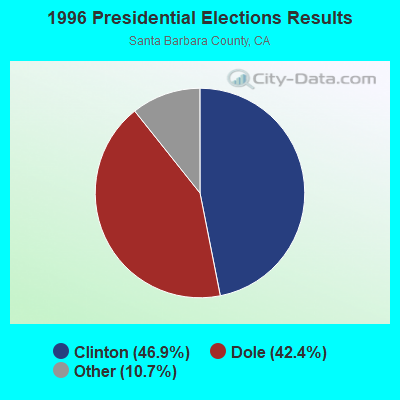
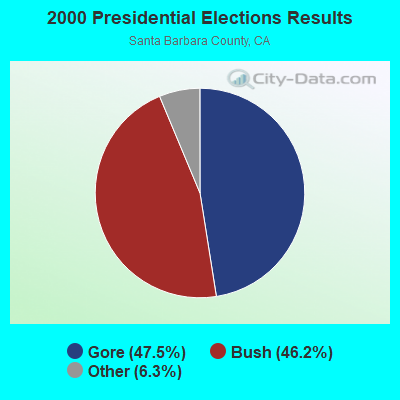
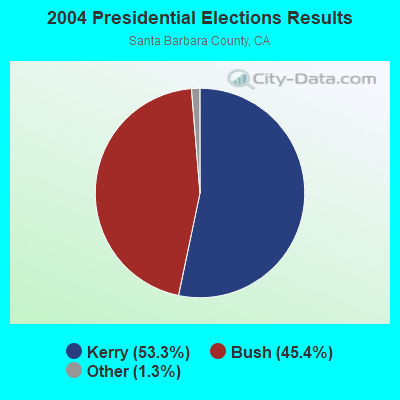
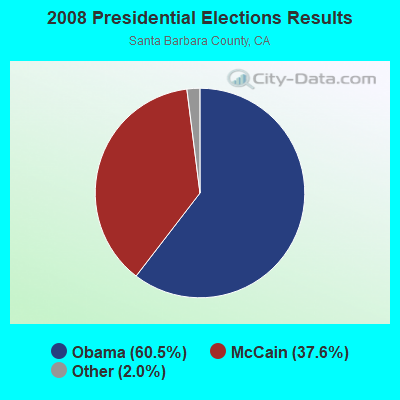
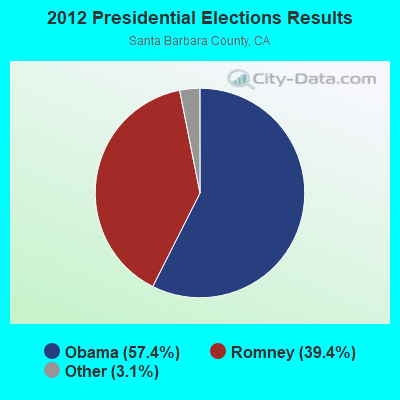
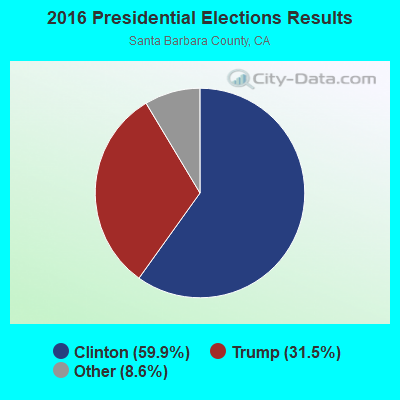
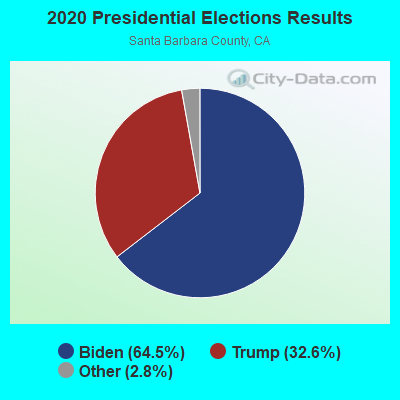
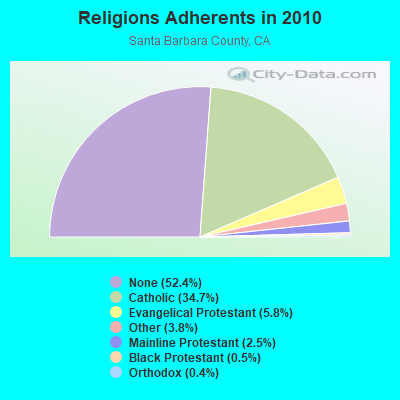
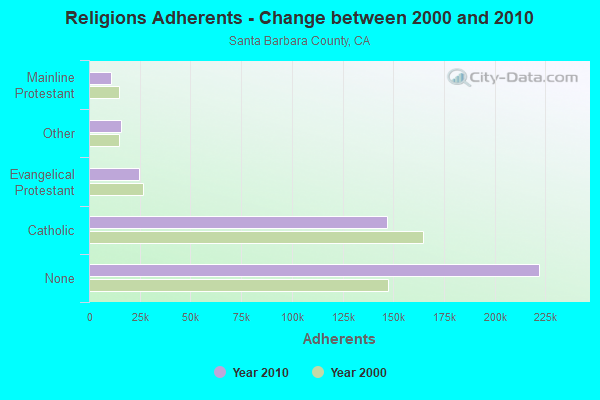
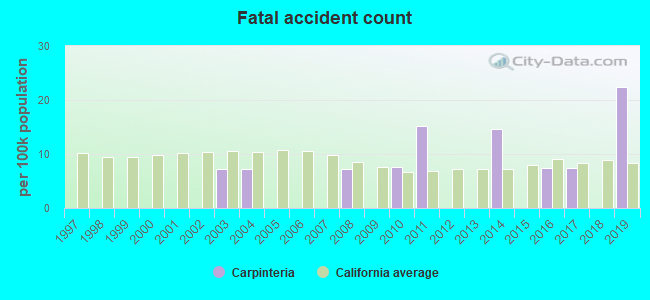
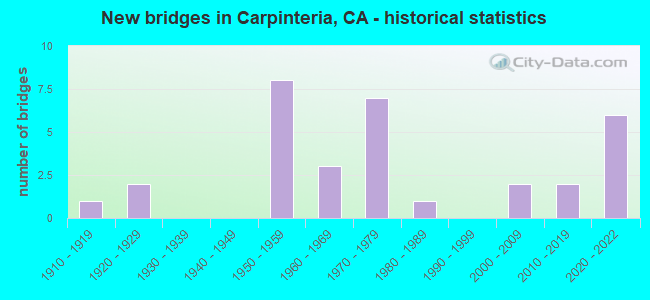
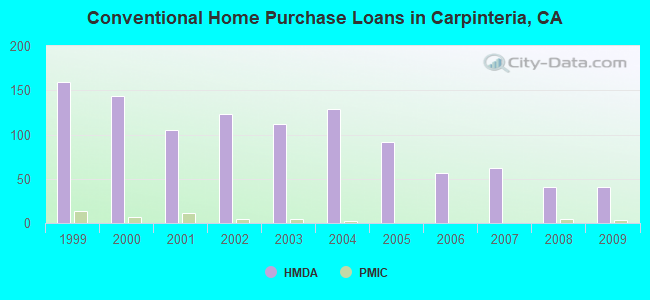
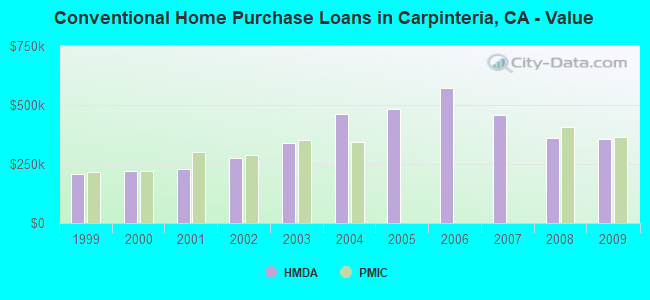
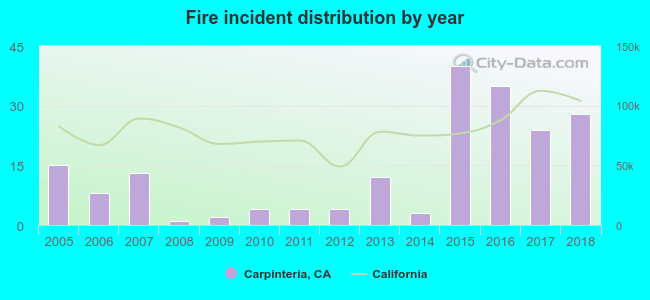 According to the data from the years 2005 - 2018 the average number of fires per year is 14. The highest number of reported fires - 40 took place in 2015, and the least - 1 in 2008. The data has a growing trend.
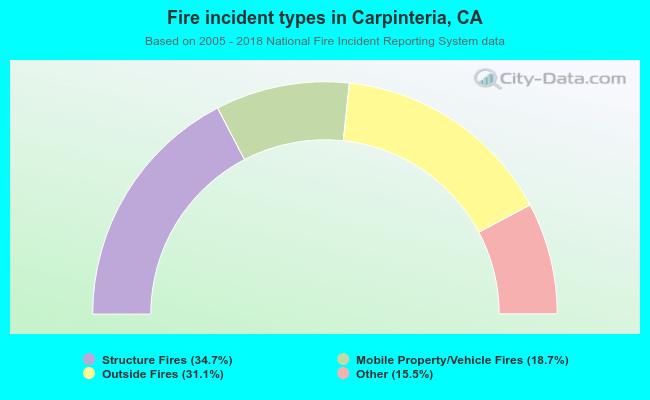 When looking into fire subcategories, the most reports belonged to: Structure Fires (34.7%), and Outside Fires (31.1%).