Carpinteria, CA (California) Houses and Residents
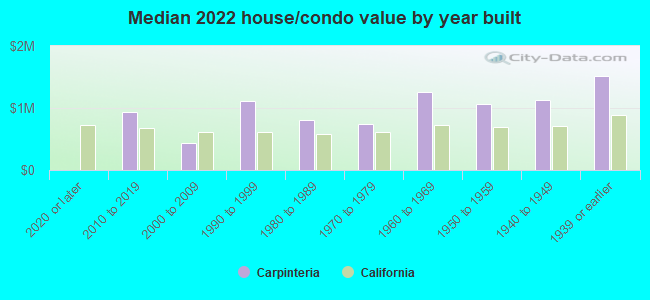
| Carpinteria: | $942,543 |
| California: | $715,900 |
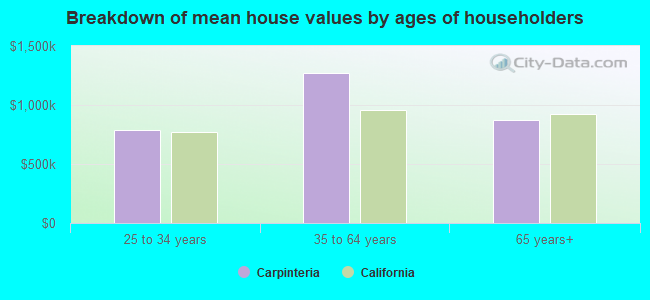
Mean price in 2022:
Detached houses: $1,413,506
Here: $1,413,506 State: $988,808 Townhouses or other attached units: $766,384
Here: $766,384 State: $838,546 In 3-to-4-unit structures: $674,039
Here: $674,039 State: $824,253 In 5-or-more-unit structures: $398,870
Here: $398,870 State: $730,996 Mobile homes: $329,306
Here: $329,306 State: $184,506
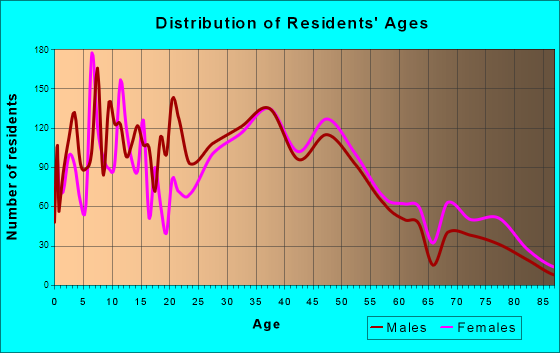
Total population: 13,671 (All urban)
Houses: 6,112 (5,146 occupied: 2,997 owner occupied, 2,178 renter occupied)
| % of renters here: | 42% |
| State: | 44% |
Housing density: 2,261 houses/condos per square mile
Median price asked for vacant for-sale houses and condos in 2022: $417,071.
Median contract rent in 2022: over $2,000 (lower quartile is $1,729, upper quartile is over $2,000)
Median rent asked for vacant for-rent units in 2022: $2,050
Median gross rent in Carpinteria, CA in 2022: over $2,000
Housing units in Carpinteria with a mortgage: 1,819 (209 second mortgage, 22 home equity loan, 194 both second mortgage and home equity loan)
Houses without a mortgage: 16
Median household income for houses/condos with a mortgage: $169,974
Median household income for apartments without a mortgage: $72,121
Median monthly housing costs: $2,162
Compare current foreclosures near Carpinteria, CA:
| Photo | Address | Area | Beds / Baths | Price | Details |
|---|---|---|---|---|---|

|
#1
Linden Ave # B
Carpinteria, CA 93013
|
- sq. feet
|
- baths - beds |
show details | |

|
#2
Dorrance Way
Carpinteria, CA 93013
|
- sq. feet
|
- baths - beds |
show details | |

|
#3
Carpinteria Ave
Carpinteria, CA 93013
|
- sq. feet
|
- baths - beds |
show details | |

|
#4
El Rodeo Rd
Santa Barbara, CA 93110
|
3,264 sq. feet
|
4 baths 4 beds |
show details | |

|
#5
San Andres St
Santa Barbara, CA 93101
|
620 sq. feet
|
2 baths 3 beds |
show details | |

|
#6
S Padre Juan Ave
Ojai, CA 93023
|
1,057 sq. feet
|
1 baths 1 beds |
show details | |

|
#7
Santa Ynez Ct
Santa Barbara, CA 93103
|
1,844 sq. feet
|
2 baths 3 beds |
show details | |

|
#8
San Rafael Ave
Santa Barbara, CA 93109
|
1,068 sq. feet
|
1 baths 3 beds |
show details | |

|
#9
E Mcfarlane St
Ventura, CA 93001
|
1,438 sq. feet
|
2 baths 4 beds |
show details | |

|
#10
Edison Dr
Ventura, CA 93001
|
1,176 sq. feet
|
1 baths 2 beds |
show details |
| Photo | Address | Area | Beds / Baths | Price | Details |
|---|---|---|---|---|---|

|
#11
Holt St
Ventura, CA 93001
|
952 sq. feet
|
1 baths 2 beds |
show details | |

|
#12
W Park Row Ave
Ventura, CA 93001
|
680 sq. feet
|
1 baths 2 beds |
show details | |

|
#13
Murrell Rd
Santa Barbara, CA 93109
|
1,383 sq. feet
|
2 baths 2 beds |
show details | |

|
#14
Valdivia Dr
Santa Barbara, CA 93110
|
1,403 sq. feet
|
2 baths 4 beds |
show details | |

|
#15
Valdivia Dr
Santa Barbara, CA 93110
|
1,402 sq. feet
|
2 baths 4 beds |
show details | |

|
#16
Santa Rosa Ln
Santa Barbara, CA 93108
|
- sq. feet
|
1 baths 2 beds |
show details | |

|
#17
Pima Ln
Ventura, CA 93001
|
908 sq. feet
|
1 baths 2 beds |
show details | |

|
#18
Primrose Dr
Ventura, CA 93001
|
1,054 sq. feet
|
2 baths 3 beds |
show details | |

|
#19
Primrose Dr
Ventura, CA 93001
|
1,066 sq. feet
|
2 baths 3 beds |
show details | |

|
#20
Poli St
Ventura, CA 93001
|
1,251 sq. feet
|
1 baths 2 beds |
show details |
| Photo | Address | Area | Beds / Baths | Price | Details |
|---|---|---|---|---|---|

|
#21
Walbridge Way
Ojai, CA 93023
|
2,138 sq. feet
|
2 baths 4 beds |
show details | |

|
#22
Del Oro Ave
Santa Barbara, CA 93109
|
- sq. feet
|
3 baths 5 beds |
show details | |

|
#23
Drown Ave
Ojai, CA 93023
|
1,481 sq. feet
|
2 baths 4 beds |
show details | |

|
#24
Shady Ln
Ojai, CA 93023
|
1,180 sq. feet
|
1 baths 3 beds |
show details | |

|
#25
Rhoads Ave
Santa Barbara, CA 93111
|
1,967 sq. feet
|
3 baths 4 beds |
show details | |

|
#26
Saint Ann Dr
Santa Barbara, CA 93109
|
1,944 sq. feet
|
2 baths 4 beds |
show details | |

|
#27
Madrona Dr
Santa Barbara, CA 93105
|
- sq. feet
|
1 baths 2 beds |
show details | |

|
#28
Kenwood Rd
Santa Barbara, CA 93109
|
- sq. feet
|
2 baths 3 beds |
show details | |

|
#29
Calle Palo Colorado
Santa Barbara, CA 93105
|
- sq. feet
|
2 baths 3 beds |
show details | |

|
#30
Calle Rosales
Santa Barbara, CA 93105
|
- sq. feet
|
2 baths 3 beds |
show details |
| Photo | Address | Area | Beds / Baths | Price | Details |
|---|---|---|---|---|---|

|
#31
Calle Linares
Santa Barbara, CA 93109
|
- sq. feet
|
4 baths 4 beds |
show details | |

|
#32
W Islay St
Santa Barbara, CA 93101
|
- sq. feet
|
1 baths 2 beds |
show details | |

|
#33
Anacapa St
Santa Barbara, CA 93105
|
- sq. feet
|
3 baths 3 beds |
show details | |

|
#34
Elizabeth St
Santa Barbara, CA 93103
|
- sq. feet
|
1 baths 2 beds |
show details | |

|
#35
Del Oro Ave
Santa Barbara, CA 93109
|
- sq. feet
|
3 baths 5 beds |
show details | |

|
#36
Dolores Dr
Santa Barbara, CA 93109
|
- sq. feet
|
2 baths 4 beds |
show details | |

|
#37
Dexter Dr Apt 17
Santa Barbara, CA 93110
|
- sq. feet
|
- baths - beds |
show details | |

|
#38
Felix Dr
Ojai, CA 93023
|
- sq. feet
|
- baths - beds |
show details | |

|
#39
N Ventura Ave
Ventura, CA 93001
|
- sq. feet
|
- baths - beds |
show details | |

|
#40
E Ocean Ave
Ventura, CA 93001
|
- sq. feet
|
- baths - beds |
show details |
| Photo | Address | Area | Beds / Baths | Price | Details |
|---|---|---|---|---|---|

|
#41
La Espada Dr
Santa Barbara, CA 93111
|
- sq. feet
|
- baths - beds |
show details | |

|
#42
Franklin Ln
Ventura, CA 93001
|
- sq. feet
|
- baths - beds |
show details | |

|
#43
Leighton Dr
Ventura, CA 93001
|
- sq. feet
|
- baths - beds |
show details | |

|
#44
Pierpont Blvd
Ventura, CA 93001
|
- sq. feet
|
- baths - beds |
show details | |

|
#45
Cedar Pl
Ventura, CA 93001
|
- sq. feet
|
- baths - beds |
show details | |

|
#46
Old Mill Rd Apt 55
Santa Barbara, CA 93110
|
- sq. feet
|
- baths - beds |
show details | |

|
#47
E Warner St
Ventura, CA 93001
|
- sq. feet
|
- baths - beds |
show details | |

|
#48
N Laurel St
Ventura, CA 93001
|
- sq. feet
|
- baths - beds |
show details | |

|
#49
Paseo De Playa Apt 504
Ventura, CA 93001
|
- sq. feet
|
- baths - beds |
show details | |

|
Check over 1 million property listings on Foreclosure.com!
|
browse all offers | |||

Latest news about housing in Carpinteria, CA collected exclusively by city-data.com from local newspapers, TV, and radio stations


Median year apartment built: 1976
Household type by relationship:
Households: 13,146- Male householders: 2,486 (524 living alone), Female householders: 2,577 (1,111 living alone)
2,678 spouses (2,627 opposite-sex spouses), 225 unmarried partners, (225 opposite-sex unmarried partners), 3,225 children (3,175 natural, 0 adopted, 50 stepchildren), 409 grandchildren, 217 brothers or sisters, 343 parents, 0 foster children, 160 other relatives, 770 non-relatives
- In group quarters: 50
Size of family households: 1,303 2-persons, 591 3-persons, 718 4-persons, 220 5-persons, 134 6-persons, 153 7-or-more-persons.
Size of nonfamily households: 1,641 1-person, 257 2-persons, 80 3-persons, 50 4-persons.
1,757 married couples with children.
277 single-parent households (106 men, 171 women).
65.0% of residents of Carpinteria speak English at home.
31.0% of residents speak Spanish at home (57% speak English very well, 13% speak English well, 19% speak English not well, 12% don't speak English at all).
2.7% of residents speak other Indo-European language at home (84% speak English very well, 14% speak English well, 2% speak English not well).
1.0% of residents speak Asian or Pacific Island language at home (80% speak English very well, 9% speak English well, 11% speak English not well).
0.3% of residents speak other language at home (69% speak English very well, 31% speak English well).
Foreign born population: 2,772 (21.1%)
(36.7% of them are naturalized citizens)
| Here: | 5.4 |
| State: | 6.0 |
| Here: | 3.9 |
| State: | 3.9 |
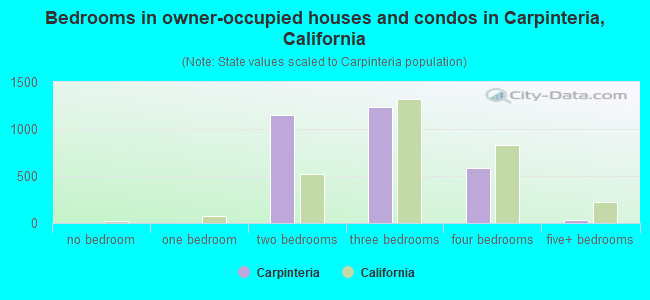
- Bedrooms in owner-occupied houses and condos in Carpinteria, California
- 0no bedroom
- 01 bedroom
- 1,1472 bedrooms
- 1,2333 bedrooms
- 5834 bedrooms
- 345+ bedrooms
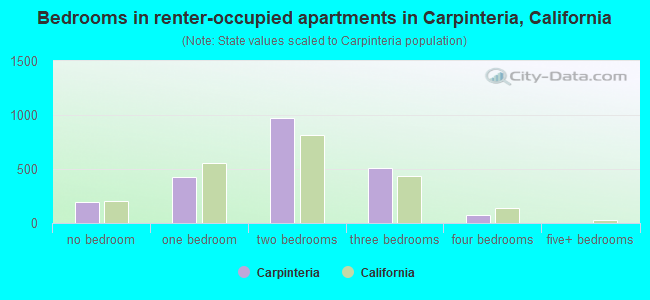
- Bedrooms in renter-occupied apartments in Carpinteria, California
- 194no bedroom
- 4271 bedroom
- 9742 bedrooms
- 5053 bedrooms
- 784 bedrooms
- 05+ bedrooms
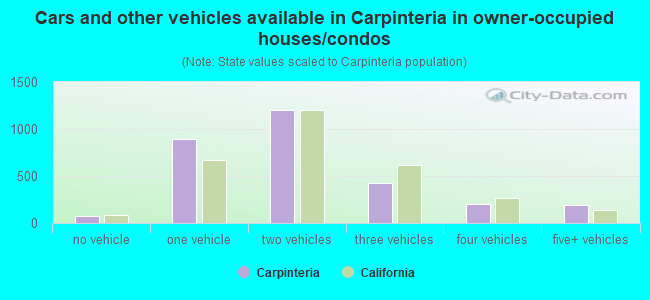
- Cars and other vehicles available in Carpinteria in owner-occupied houses/condos
- 77no vehicle
- 8901 vehicle
- 1,2062 vehicles
- 4283 vehicles
- 2074 vehicles
- 1905+ vehicles
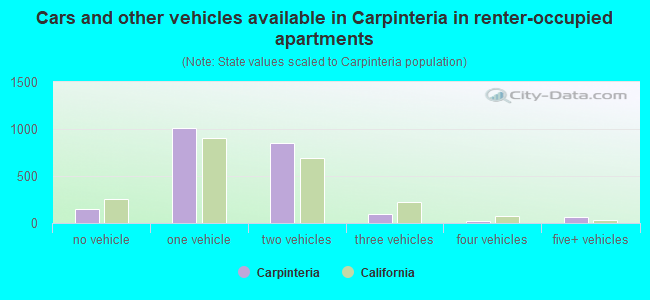
- Cars and other vehicles available in Carpinteria in renter-occupied apartments
- 144no vehicle
- 1,0151 vehicle
- 8462 vehicles
- 973 vehicles
- 174 vehicles
- 605+ vehicles
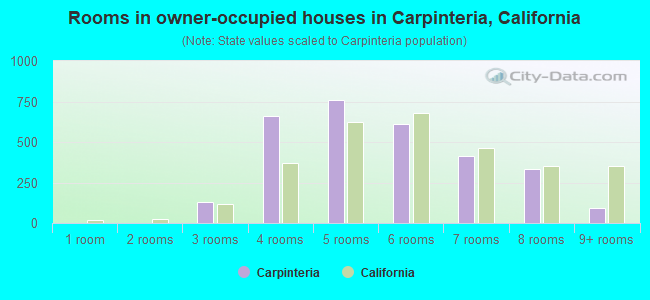
- Rooms in owner-occupied houses in Carpinteria, California
- 01 room
- 02 rooms
- 1313 rooms
- 6594 rooms
- 7585 rooms
- 6106 rooms
- 4137 rooms
- 3318 rooms
- 949+ rooms
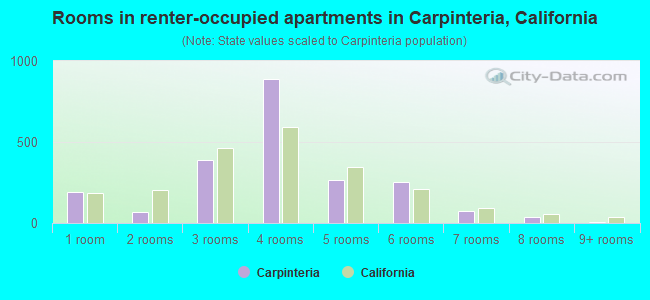
- Rooms in renter-occupied apartments in Carpinteria, California
- 1941 room
- 672 rooms
- 3903 rooms
- 8914 rooms
- 2655 rooms
- 2546 rooms
- 777 rooms
- 378 rooms
- 49+ rooms
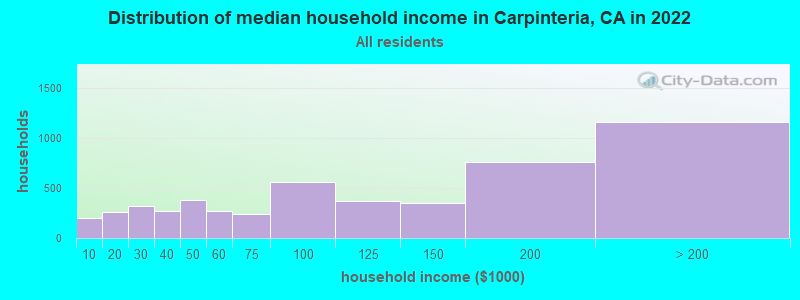
Carpinteria, CA household income distribution

- 198Less than $10,000
- 256$10,000 to $19,999
- 318$20,000 to $29,999
- 275$30,000 to $39,999
- 382$40,000 to $49,999
- 271$50,000 to $59,999
- 239$60,000 to $74,999
- 564$75,000 to $99,999
- 368$100,000 to $124,999
- 355$125,000 to $149,999
- 764$150,000 to $199,999
- 1,162$200,000 or more
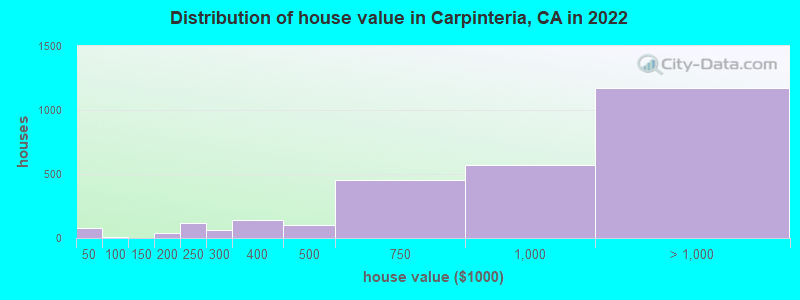
Home value of owner - occupied houses in 2022 in Carpinteria, CA
-
- 48Less than $10,000
- 9$15,000 to $19,999
- 18$25,000 to $29,999
- 5$60,000 to $69,999
- 31$150,000 to $174,999
- 6$175,000 to $199,999
- 119$200,000 to $249,999
- 62$250,000 to $299,999
- 141$300,000 to $399,999
- 104$400,000 to $499,999
- 449$500,000 to $749,999
- 566$750,000 to $999,999
- 802$1,000,000 to $1,499,999
- 263$1,500,000 to $1,999,999
- 105$2,000,000 or more
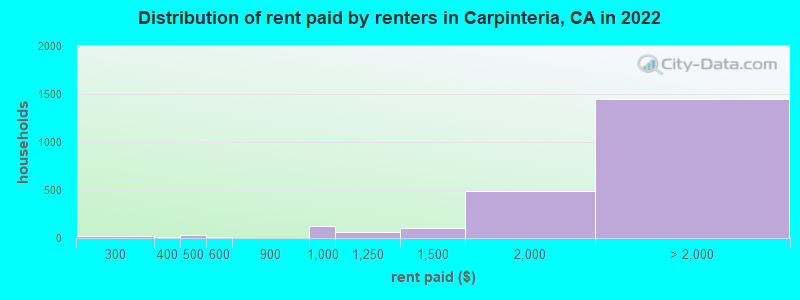
Rent paid by renters in 2022 in Carpinteria, CA
-
- 25$200 to $249
- 12$350 to $399
- 21$400 to $449
- 8$450 to $499
- 13$550 to $599
- 127$900 to $999
- 58$1,000 to $1,249
- 103$1,250 to $1,499
- 490$1,500 to $1,999
- 512$2,000 to $2,499
- 537$2,500 to $2,999
- 201$3,000 to $3,499
- 146$3,500 or more
- 45No cash rent
Percentage of workers working in this county: 91.3%
Number of people working at home: 955 (14.6% of all workers)
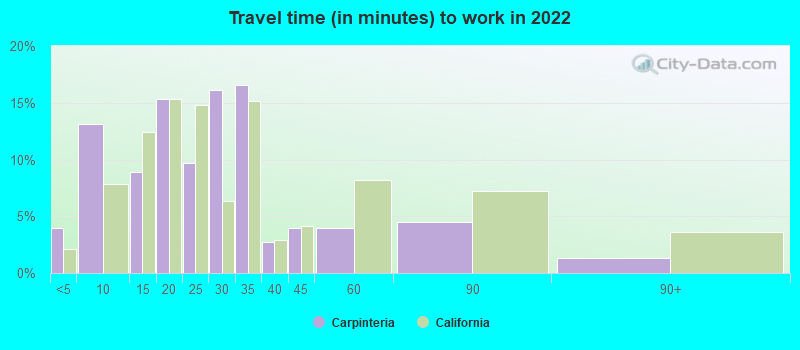
Travel time to work (commute)
- Less than 5 minutes: 295
- 5 to 9 minutes: 979
- 10 to 14 minutes: 452
- 15 to 19 minutes: 947
- 20 to 24 minutes: 676
- 25 to 29 minutes: 623
- 30 to 34 minutes: 740
- 35 to 39 minutes: 211
- 40 to 44 minutes: 73
- 45 to 59 minutes: 219
- 60 to 89 minutes: 283
- 90 or more minutes: 123
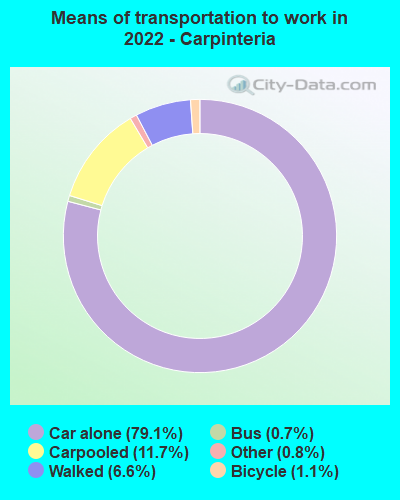
Means of transportation to work:
- Drove a car alone: 4,148 (65.7%)
- Carpooled: 567 (9.0%)
- Bus: 38 (0.6%)
- Taxi: 69 (1.1%)
- Bicycle: 67 (1.1%)
- Walked: 526 (8.3%)
- Worked at home: 955 (15.1%)
- Unemployment by race in 2022
- Unemployment rate for White non-Hispanic residents
- 2.8%Males
- 6.9%Females
- Unemployment rate for Black residents
- 36.5%Males
- Unemployment rate for other race residents
- 1.2%Males
- 1.7%Females
- Unemployment rate for Hispanic or Latino residents
- 0.5%Males
- 4.1%Females
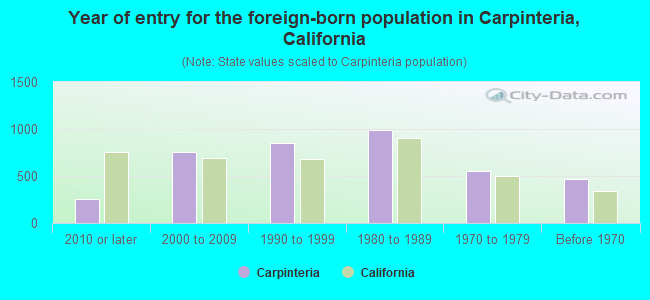
- Year of entry for the foreign-born population in Carpinteria, California
- 2572010 or later
- 7572000 to 2009
- 8521990 to 1999
- 9901980 to 1989
- 5581970 to 1979
- 469Before 1970
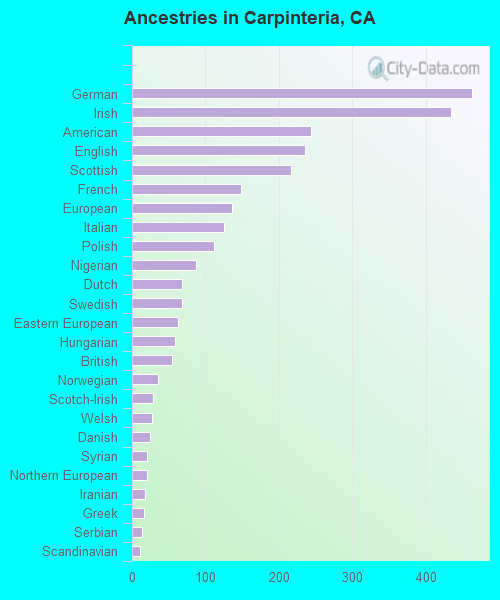
First ancestries reported:
- German: 463 (6.7%)
- Irish: 434 (6.3%)
- American: 244 (3.5%)
- English: 236 (3.4%)
- Scottish: 217 (3.2%)
- French: 148 (2.1%)
- European: 136 (2.0%)
- Italian: 125 (1.8%)
- Polish: 112 (1.6%)
- Nigerian: 87 (1.3%)
- Dutch: 68 (1.0%)
- Swedish: 68 (1.0%)
- Eastern European: 63 (0.9%)
- Hungarian: 58 (0.8%)
- British: 54 (0.8%)
- Norwegian: 35 (0.5%)
- Scotch-Irish: 28 (0.4%)
- Welsh: 27 (0.4%)
- Danish: 25 (0.4%)
- Syrian: 20 (0.3%)
- Northern European: 20 (0.3%)
- Iranian: 18 (0.3%)
- Greek: 17 (0.2%)
- Serbian: 14 (0.2%)
- Scandinavian: 11 (0.2%)
- Armenian: 10 (0.1%)
- Russian: 10 (0.1%)
- Ukrainian: 10 (0.1%)
- Pennsylvania German: 9 (0.1%)
- Portuguese: 7 (0.1%)
Most common places of birth for foreign-born residents (%):
| Carpinteria: | 74.0% (2,163) |
| California: | 37.2% (3,881,193) |
| Carpinteria: | 3.2% (94) |
| California: | 0.1% (12,221) |
| Carpinteria: | 2.7% (80) |
| California: | 1.2% (127,477) |
| Carpinteria: | 2.5% (72) |
| California: | 0.6% (57,953) |
| Carpinteria: | 2.3% (66) |
| California: | 0.7% (71,932) |
| Carpinteria: | 2.1% (62) |
| California: | 7.8% (818,297) |
| Carpinteria: | 1.8% (54) |
| California: | 0.7% (73,304) |
Place of birth for U.S.-born residents:
- This state: 7,481
- Other state: 2,594
- Northeast: 571
- Midwest: 712
- South: 410
- West: 896
93.0% of Carpinteria residents lived in the same house 1 years ago.
Out of people who lived in different houses, 37.1% lived in this county.
Out of people who lived in different counties, 57.1% lived in California.
| Carpinteria: | 93.0% |
| State average: | 88.9% |
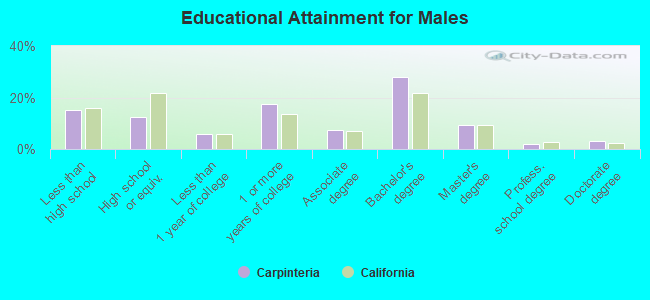
Education attainment for males 25 years and older:
- No schooling: 119
- Nursery to 4th grade: 167
- 5th and 6th grade: 60
- 7th and 8th grade: 40
- 9th grade: 100
- 10th grade: 82
- 11th grade: 47
- 12th grade, no diploma: 91
- High school graduate (or equivalency): 583
- Less than 1 year of college: 267
- Some college more than 1 year, no degree: 825
- Associate degree: 340
- Bachelor's degree: 1,310
- Master's degree: 440
- Professional school degree: 84
- Doctorate degree: 138
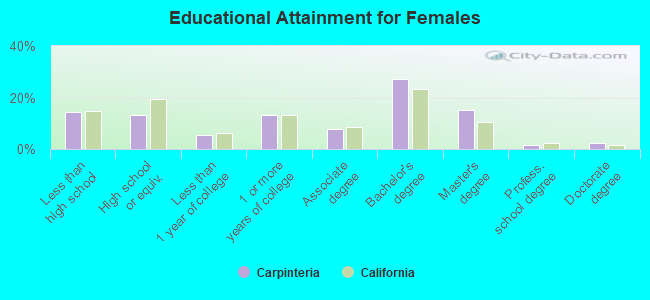
Education attainment for females 25 years and older:
- No schooling: 113
- Nursery to 4th grade: 123
- 5th and 6th grade: 104
- 7th and 8th grade: 16
- 9th grade: 83
- 10th grade: 10
- 11th grade: 27
- 12th grade, no diploma: 235
- High school graduate (or equivalency): 657
- Less than 1 year of college: 263
- Some college more than 1 year, no degree: 648
- Associate degree: 380
- Bachelor's degree: 1,349
- Master's degree: 741
- Professional school degree: 69
- Doctorate degree: 113
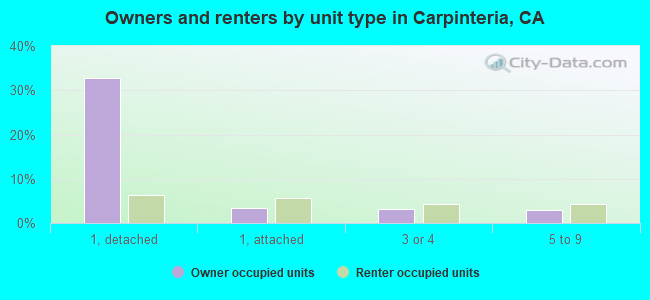
Housing units in structures:
- One, detached: 2,158
- One, attached: 549
- Two: 108
- 3 or 4: 309
- 5 to 9: 621
- 10 to 19: 565
- 20 to 49: 412
- 50 or more: 532
- Mobile homes: 856
Median worth of mobile homes: $313,839
Housing units lacking complete kitchen facilities in 2022: 1.5%
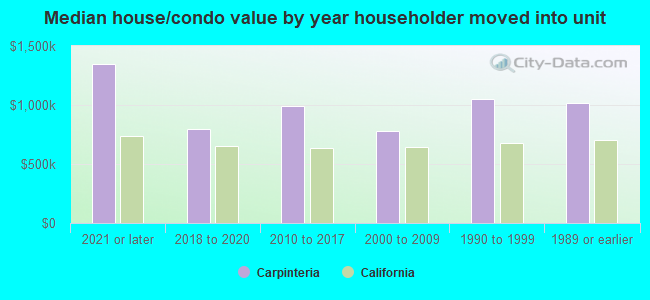
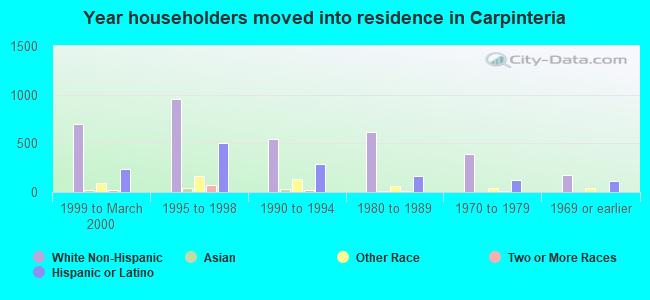
House/condo owner moved in on average 17 years ago
Renter moved in on average 5 years ago
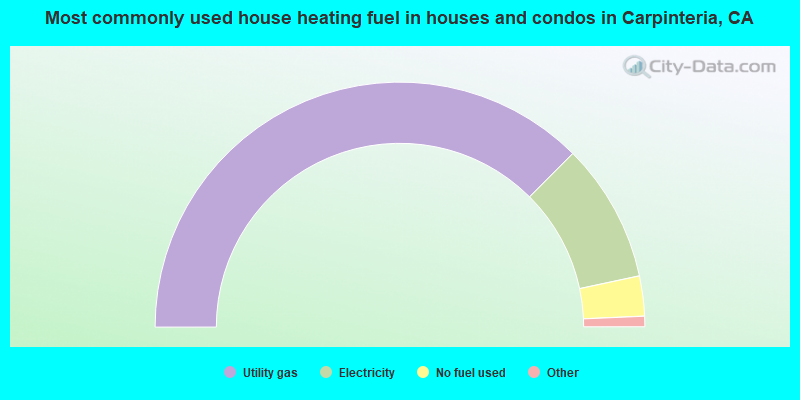
- 75.1%Utility gas
- 18.4%Electricity
- 5.3%No fuel used
- 0.8%Bottled, tank, or LP gas
- 0.5%Solar energy
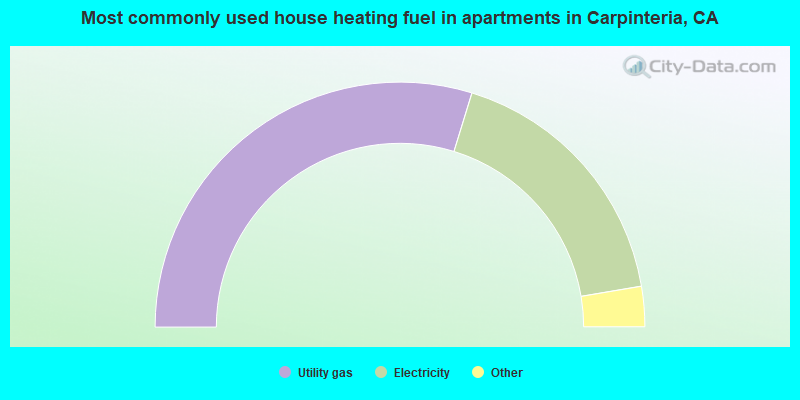
- 59.5%Utility gas
- 35.2%Electricity
- 3.6%No fuel used
- 1.0%Bottled, tank, or LP gas
- 0.6%Wood
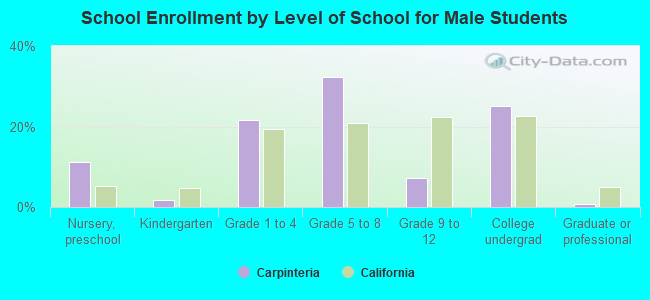
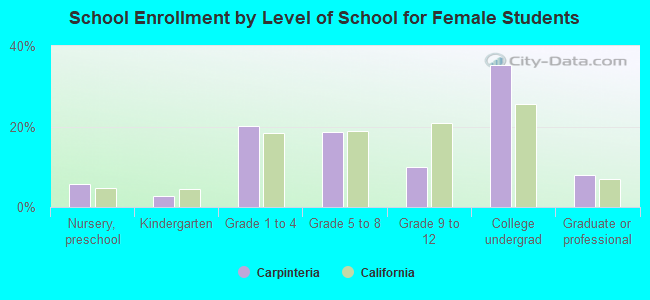
Private vs. public school enrollment:
| Here: | 20.9% |
| California: | 10.5% |
| Here: | 6.2% |
| California: | 8.5% |
| Here: | 1.2% |
| California: | 15.9% |