Brighton, Vermont
Submit your own pictures of this town and show them to the world
- OSM Map
- Google Map
- MSN Map
Population change since 2000: -3.0%
 |
| Males: 612 | |
| Females: 610 |
| Median resident age: | 48.3 years |
| Vermont median age: | 45.8 years |
Zip codes: 05846.
| Brighton: | $48,785 |
| VT: | $73,991 |
Estimated per capita income in 2022: $29,207 (it was $12,999 in 2000)
Brighton town income, earnings, and wages data
Estimated median house or condo value in 2022: $154,536 (it was $64,600 in 2000)
| Brighton: | $154,536 |
| VT: | $304,700 |
Detailed information about poverty and poor residents in Brighton, VT


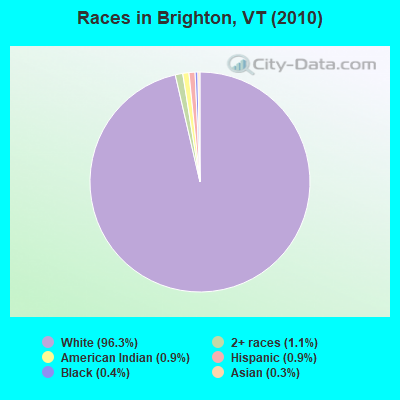
- 1,17796.3%White alone
- 131.1%Two or more races
- 110.9%American Indian alone
- 110.9%Hispanic
- 50.4%Black alone
- 40.3%Asian alone
- 10.08%Other race alone
Races in Brighton detailed stats: ancestries, foreign born residents, place of birth
 Recent articles from our blog. Our writers, many of them Ph.D. graduates or candidates, create easy-to-read articles on a wide variety of topics.
Ancestries: French (34.1%), English (15.6%), United States (12.4%), Irish (10.8%), Scottish (5.6%), Italian (4.8%).
Current Local Time: EST time zone
Land area: 52.2 square miles.
Population density: 23 people per square mile (very low).
85 residents are foreign born (5.6% North America, 0.8% Europe).
| This town: | 6.7% |
| Vermont: | 3.8% |
| Brighton town: | 1.6% ($1,063) |
| Vermont: | 2.0% ($2,196) |
Nearest city with pop. 50,000+: Portland, ME  (112.0 miles , pop. 64,249).
Nearest city with pop. 200,000+: Boston, MA (176.4 miles , pop. 589,141).
Nearest city with pop. 1,000,000+: Bronx, NY (292.3 miles , pop. 1,332,650).
Nearest cities:
), ), ), )Latitude: 44.81 N, Longitude: 71.87 W
Area code commonly used in this area: 802
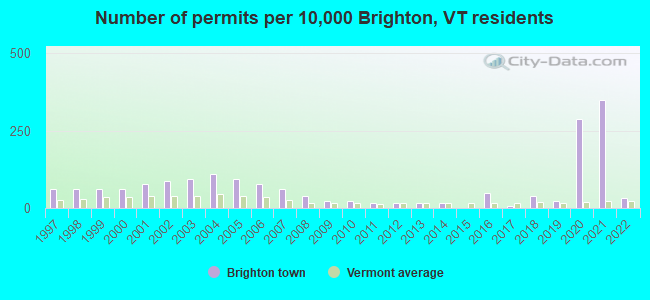
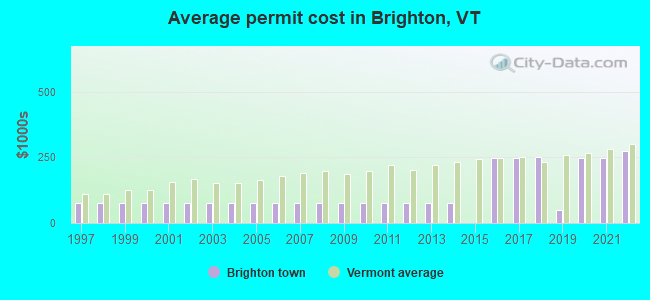
Single-family new house construction building permits:
- 2022: 4 buildings, average cost: $274,200
- 2021: 44 buildings, average cost: $248,200
- 2020: 36 buildings, average cost: $248,200
- 2019: 3 buildings, average cost: $50,000
- 2018: 5 buildings, average cost: $249,800
- 2017: 1 building, cost: $248,100
- 2016: 6 buildings, average cost: $246,000
- 2014: 2 buildings, average cost: $77,500
- 2013: 2 buildings, average cost: $77,500
- 2012: 2 buildings, average cost: $77,500
- 2011: 2 buildings, average cost: $77,500
- 2010: 3 buildings, average cost: $77,500
- 2009: 3 buildings, average cost: $77,500
- 2008: 5 buildings, average cost: $77,500
- 2007: 8 buildings, average cost: $77,500
- 2006: 10 buildings, average cost: $77,500
- 2005: 12 buildings, average cost: $77,500
- 2004: 14 buildings, average cost: $77,500
- 2003: 12 buildings, average cost: $77,500
- 2002: 11 buildings, average cost: $77,500
- 2001: 10 buildings, average cost: $77,500
- 2000: 8 buildings, average cost: $77,500
- 1999: 8 buildings, average cost: $77,300
- 1998: 8 buildings, average cost: $78,200
- 1997: 8 buildings, average cost: $74,800
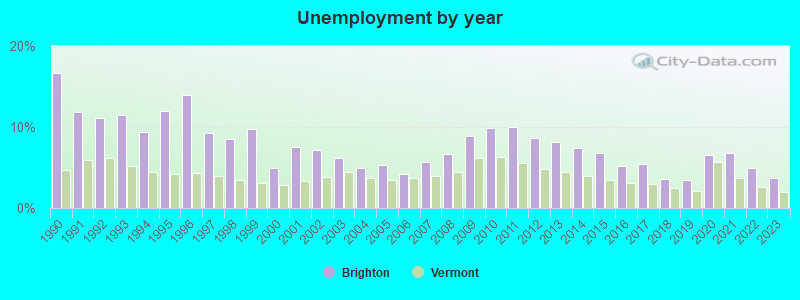
| Here: | 3.7% |
| Vermont: | 2.0% |
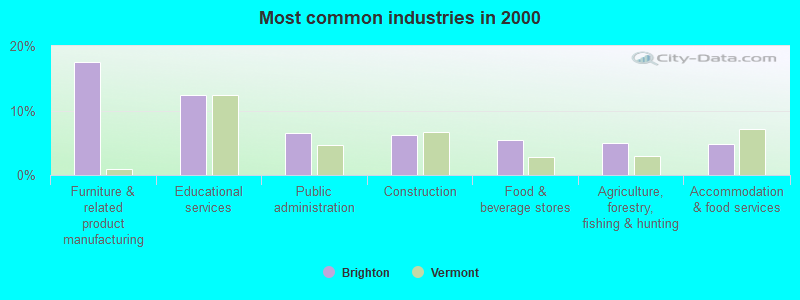
- Furniture & related product manufacturing (17.5%)
- Educational services (12.3%)
- Public administration (6.6%)
- Construction (6.2%)
- Food & beverage stores (5.4%)
- Agriculture, forestry, fishing & hunting (5.0%)
- Accommodation & food services (4.8%)
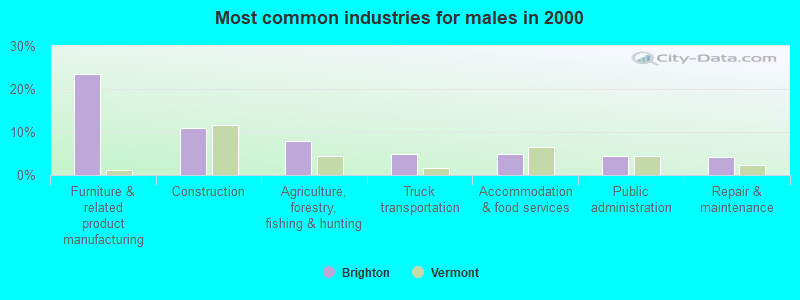
- Furniture & related product manufacturing (23.4%)
- Construction (10.9%)
- Agriculture, forestry, fishing & hunting (7.9%)
- Truck transportation (4.9%)
- Accommodation & food services (4.9%)
- Public administration (4.5%)
- Repair & maintenance (4.2%)
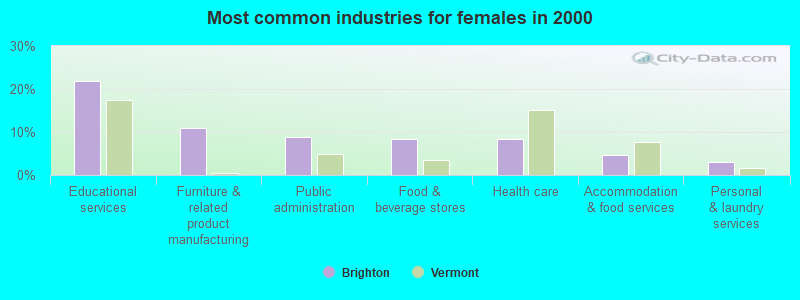
- Educational services (21.8%)
- Furniture & related product manufacturing (10.9%)
- Public administration (8.8%)
- Food & beverage stores (8.4%)
- Health care (8.4%)
- Accommodation & food services (4.6%)
- Personal & laundry services (2.9%)
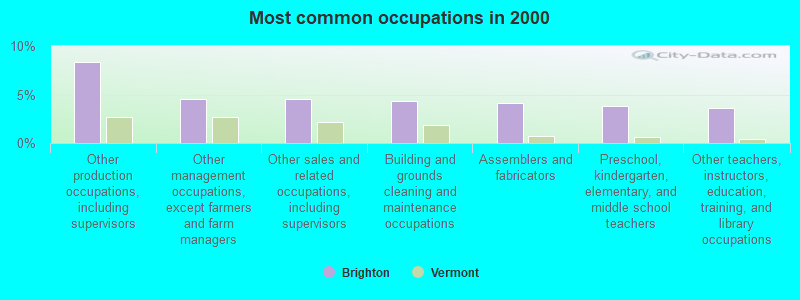
- Other production occupations, including supervisors (8.3%)
- Other management occupations, except farmers and farm managers (4.6%)
- Other sales and related occupations, including supervisors (4.6%)
- Building and grounds cleaning and maintenance occupations (4.4%)
- Assemblers and fabricators (4.2%)
- Preschool, kindergarten, elementary, and middle school teachers (3.8%)
- Other teachers, instructors, education, training, and library occupations (3.6%)
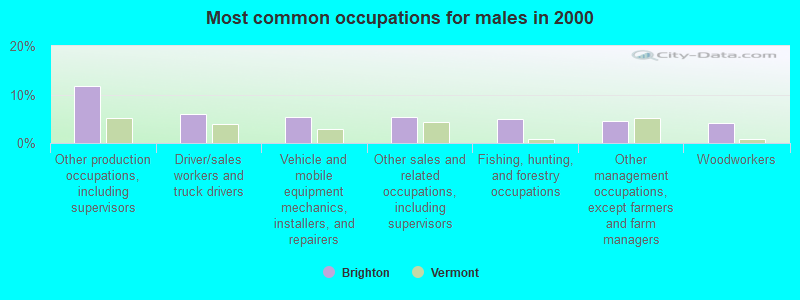
- Other production occupations, including supervisors (11.7%)
- Driver/sales workers and truck drivers (6.0%)
- Vehicle and mobile equipment mechanics, installers, and repairers (5.3%)
- Other sales and related occupations, including supervisors (5.3%)
- Fishing, hunting, and forestry occupations (4.9%)
- Other management occupations, except farmers and farm managers (4.5%)
- Woodworkers (4.2%)
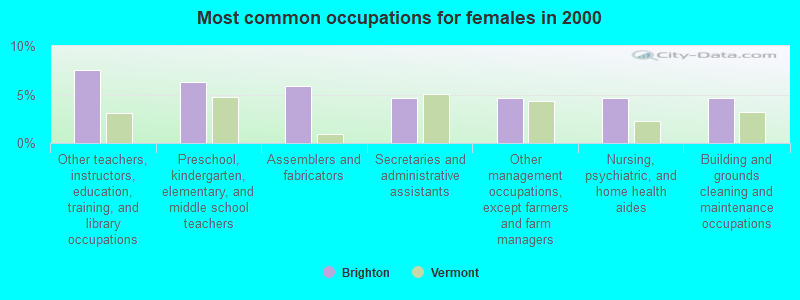
- Other teachers, instructors, education, training, and library occupations (7.6%)
- Preschool, kindergarten, elementary, and middle school teachers (6.3%)
- Assemblers and fabricators (5.9%)
- Secretaries and administrative assistants (4.6%)
- Other management occupations, except farmers and farm managers (4.6%)
- Nursing, psychiatric, and home health aides (4.6%)
- Building and grounds cleaning and maintenance occupations (4.6%)
Average climate in Brighton, Vermont
Based on data reported by over 4,000 weather stations


(lower is better)
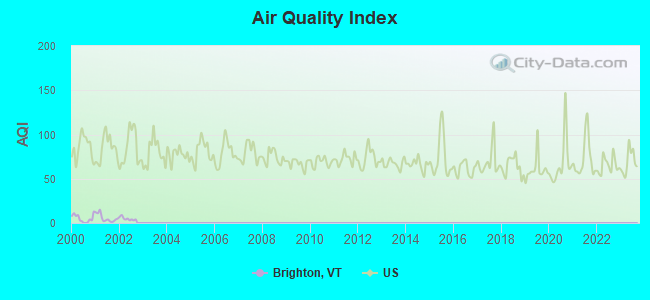
Air Quality Index (AQI) level in 2002 was 4.67. This is significantly better than average.
| City: | 4.67 |
| U.S.: | 72.56 |
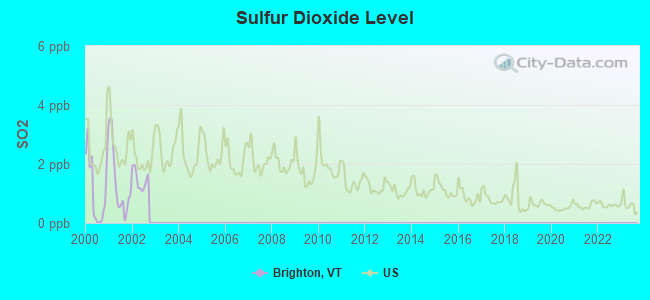
Sulfur Dioxide (SO2) [ppb] level in 2002 was 1.47. This is about average. Closest monitor was 22.7 miles away from the city center.
| City: | 1.47 |
| U.S.: | 1.51 |
Earthquake activity:
Brighton-area historical earthquake activity is significantly above Vermont state average. It is 77% smaller than the overall U.S. average.On 4/20/2002 at 10:50:47, a magnitude 5.3 (5.3 ML, Depth: 3.0 mi, Class: Moderate, Intensity: VI - VII) earthquake occurred 92.2 miles away from the city center
On 4/20/2002 at 10:50:47, a magnitude 5.2 (5.2 MB, 4.2 MS, 5.2 MW, 5.0 MW) earthquake occurred 93.7 miles away from the city center
On 10/7/1983 at 10:18:46, a magnitude 5.3 (5.1 MB, 5.3 LG, 5.1 ML) earthquake occurred 135.8 miles away from Brighton center
On 1/19/1982 at 00:14:42, a magnitude 4.7 (4.5 MB, 4.7 MD, 4.5 LG, Class: Light, Intensity: IV - V) earthquake occurred 91.5 miles away from Brighton center
On 10/16/2012 at 23:12:25, a magnitude 4.7 (4.7 ML, Depth: 10.0 mi) earthquake occurred 103.2 miles away from Brighton center
On 6/16/1995 at 12:13:11, a magnitude 3.8 (3.8 LG, Depth: 3.1 mi, Class: Light, Intensity: II - III) earthquake occurred 36.2 miles away from Brighton center
Magnitude types: regional Lg-wave magnitude (LG), body-wave magnitude (MB), duration magnitude (MD), local magnitude (ML), surface-wave magnitude (MS), moment magnitude (MW)
Natural disasters:
The number of natural disasters in Essex County (20) is greater than the US average (15).Major Disasters (Presidential) Declared: 15
Emergencies Declared: 1
Causes of natural disasters: Floods: 14, Storms: 13, Tropical Storms: 2, Winter Storms: 2, Heavy Rain: 1, Hurricane: 1, Landslide: 1, Other: 1 (Note: some incidents may be assigned to more than one category).
Colleges/universities with over 2000 students nearest to Brighton:
- Norwich University (about 61 miles; Northfield, VT; Full-time enrollment: 4,221)
- Saint Michael's College (about 68 miles; Colchester, VT; FT enrollment: 2,336)
- Community College of Vermont (about 69 miles; Winooski, VT; FT enrollment: 3,394)
- University of Vermont (about 70 miles; Burlington, VT; FT enrollment: 11,566)
- Champlain College (about 70 miles; Burlington, VT; FT enrollment: 2,623)
- Plymouth State University (about 74 miles; Plymouth, NH; FT enrollment: 4,838)
- SUNY College at Plattsburgh (about 79 miles; Plattsburgh, NY; FT enrollment: 5,934)
Points of interest:
Notable locations in Brighton: Don Eagle Museum (A), Island Pond Fire Station (B), Brighton Fire Department (C), Derby Line Rescue Squad (D). Display/hide their locations on the map
Churches in Brighton include: The Church of Jesus Christ of Latter Day Saints (A), Christ Episcopal Church (B), Brigton Baptist Church (C). Display/hide their locations on the map
Cemeteries: Old Protestant Cemetery (1), Old Catholic Cemetery (2), New Catholic Cemetery (3), Lakeside Cemetery (4). Display/hide their locations on the map
Lakes: Nulhegan Pond (A), Beecher Pond (B), Back Pond (C), Island Pond (D), Sukes Pond (E), Spectacle Pond (F), Mud Ponds (G), Mud Pond (H). Display/hide their locations on the map
Streams, rivers, and creeks: Taylor Brook (A), Pherrins River (B), Payne Brook (C), Oswegatchie Brook (D), McKinley Brook (E), Lightning Brook (F), Bailey Brook (G), Cold Brook (H), Clay Hill Brook (I). Display/hide their locations on the map
Parks in Brighton include: Brighton State Park (1), Island Pond Historic District (2). Display/hide their locations on the map
| This town: | 2.2 people |
| Vermont: | 2.3 people |
| This town: | 61.9% |
| Whole state: | 62.5% |
| This town: | 8.7% |
| Whole state: | 9.2% |
Likely homosexual households (counted as self-reported same-sex unmarried-partner households)
- Lesbian couples: 0.5% of all households
- Gay men: 0.0% of all households
| This town: | 19.2% |
| Whole state: | 9.4% |
| This town: | 9.3% |
| Whole state: | 3.6% |
For population 15 years and over in Brighton:
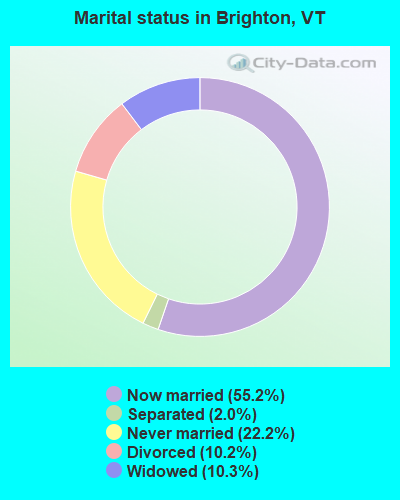
- Never married: 22.2%
- Now married: 55.2%
- Separated: 2.0%
- Widowed: 10.3%
- Divorced: 10.2%
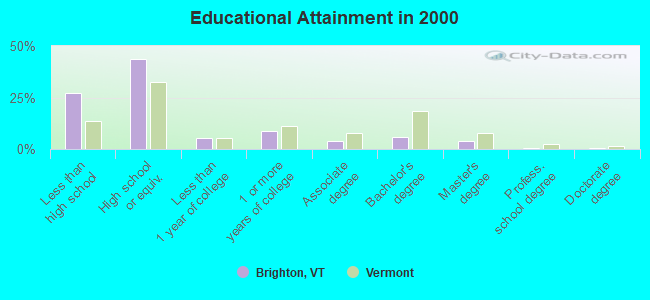
For population 25 years and over in Brighton:
- High school or higher: 73.0%
- Bachelor's degree or higher: 11.3%
- Graduate or professional degree: 5.2%
- Unemployed: 7.9%
- Mean travel time to work (commute): 18.7 minutes
| Here: | 12.4 |
| Vermont average: | 11.7 |
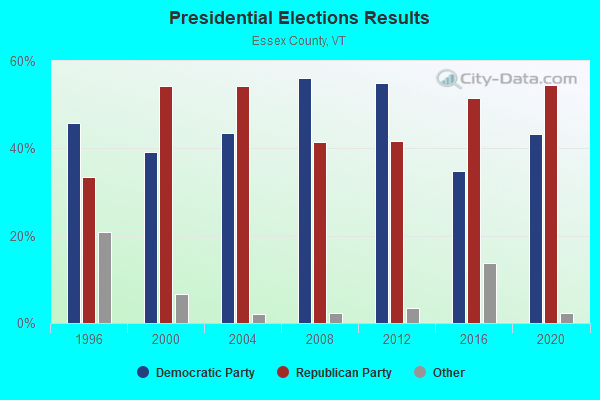
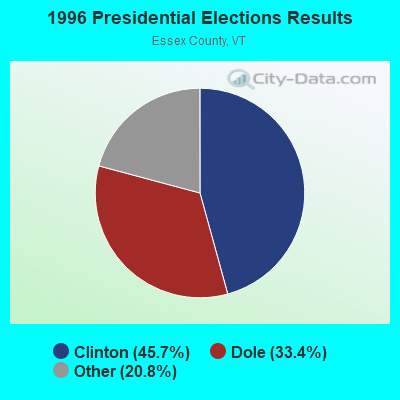
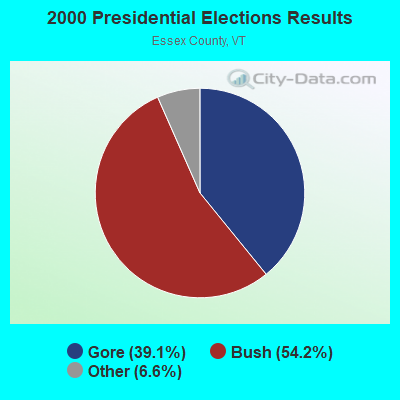
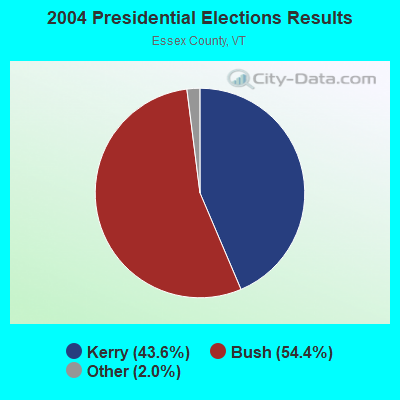
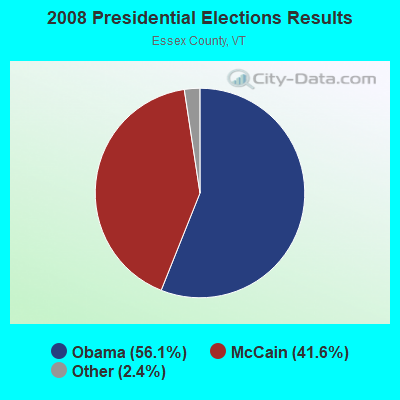

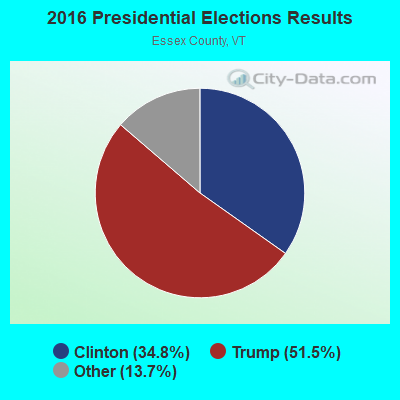
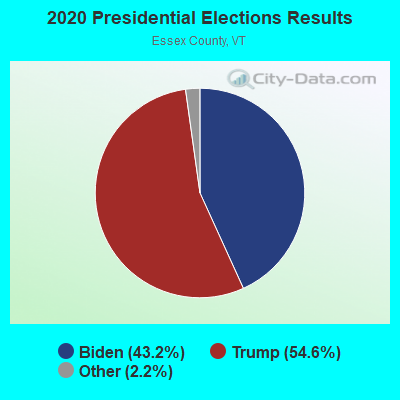
Graphs represent county-level data. Detailed 2008 Election Results
Religion statistics for Brighton, VT (based on Essex County data)
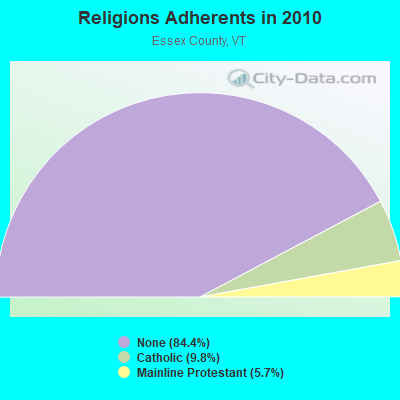
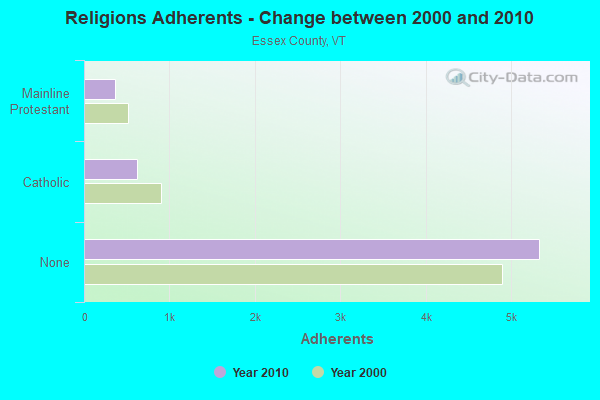
| Religion | Adherents | Congregations |
|---|---|---|
| Catholic | 619 | 2 |
| Mainline Protestant | 360 | 11 |
| Other | 3 | - |
| None | 5,324 | - |
Food Environment Statistics:
| Essex County: | 3.08 / 10,000 pop. |
| Vermont: | 3.84 / 10,000 pop. |
| Essex County: | 6.16 / 10,000 pop. |
| Vermont: | 6.40 / 10,000 pop. |
| Essex County: | 15.40 / 10,000 pop. |
| Vermont: | 11.52 / 10,000 pop. |
| Here: | 6.7% |
| Vermont: | 6.8% |
| Here: | 25.1% |
| Vermont: | 22.3% |
| Essex County: | 11.3% |
| Vermont: | 13.3% |
Strongest AM radio stations in Brighton:
- WCHP (760 AM; 35 kW; CHAMPLAIN, NY; Owner: CHAMPLAIN RADIO, INC.)
- WDEV (550 AM; 5 kW; WATERBURY, VT; Owner: RADIO VERMONT, INC.)
- WICY (1490 AM; 50 kW; MALONE, NY; Owner: CARTIER COMMUNICATIONS INC.)
- WRKO (680 AM; 50 kW; BOSTON, MA; Owner: ENTERCOM BOSTON LICENSE, LLC)
- WTME (780 AM; 10 kW; RUMFORD, ME; Owner: MOUNTAIN VALLEY BROADCASTING, INC.)
- WNNZ (640 AM; 50 kW; WESTFIELD, MA; Owner: CLEAR CHANNEL BROADCASTING LICENSES, INC.)
- WTWN (1100 AM; daytime; 5 kW; WELLS RIVER, VT; Owner: PUFFER BROADCASTING, INC.)
- WGY (810 AM; 50 kW; SCHENECTADY, NY; Owner: CLEAR CHANNEL BROADCASTING LICENSES, INC.)
- WCRN (830 AM; 50 kW; WORCESTER, MA; Owner: CARTER BROADCASTING CORPORATION)
- WEEI (850 AM; 50 kW; BOSTON, MA; Owner: ENTERCOM BOSTON LICENSE, LLC)
- WIKE (1490 AM; 1 kW; NEWPORT, VT; Owner: NORTHSTAR MEDIA, INC.)
- WVMT (620 AM; 5 kW; BURLINGTON, VT; Owner: SISON BROADCASTING, INC.)
- WBZ (1030 AM; 50 kW; BOSTON, MA; Owner: INFINITY BROADCASTING OPERATIONS, INC.)
Strongest FM radio stations in Brighton:
- WGMT (97.7 FM; LYNDON, VT; Owner: VERMONT BROADCAST ASSOCIATES, INC.)
- WPKQ (103.7 FM; NORTH CONWAY, NH; Owner: CITADEL BROADCASTING COMPANY)
- WHOM (94.9 FM; MT. WASHINGTON, NH; Owner: CITADEL BROADCASTING COMPANY)
- W243AE (96.5 FM; ORLEANS, VT; Owner: CHRISTIAN MINISTRIES, INC.)
- WMOO (92.1 FM; DERBY CENTER, VT; Owner: NORTHSTAR MEDIA, INC.)
- WLKC (103.3 FM; WATERBURY, VT; Owner: RADIO BROADCASTING SERVICES, INC.)
- WEZF (92.9 FM; BURLINGTON, VT; Owner: CAPSTAR TX LIMITED PARTNERSHIP)
- WVPS (107.9 FM; BURLINGTON, VT; Owner: VERMONT PUBLIC RADIO)
- WCVT (101.7 FM; STOWE, VT; Owner: RADIO VERMONT CLASSICS, L.L.C.)
- WMTK (106.3 FM; LITTLETON, NH; Owner: VERMONT BROADCAST ASSOCIATES, INC.)
- WDOT (95.7 FM; DANVILLE, VT; Owner: MONTPELIER BROADCASTING INC)
- WNCS (104.7 FM; MONTPELIER, VT; Owner: MONTPELIER BROADCASTING, INC.)
- WXXS (102.3 FM; LANCASTER, NH; Owner: BARRY P. LUNDERVILLE)
- WCKJ (90.5 FM; ST. JOHNSBURY, VT; Owner: CHRISTIAN MINISTRIES, INC.)
- WKXH (105.5 FM; ST. JOHNSBURY, VT; Owner: VERMONT BROADCAST ASSOCIATES, INC.)
- WVFM (105.7 FM; CAMPTON, NH; Owner: DEVON BROADCASTING COMPANY, INC.)
- National Bridge Inventory (NBI) Statistics
- 6Number of bridges
- 23ft / 7.1mTotal length
- $376,000Total costs
- 4,580Total average daily traffic
- 316Total average daily truck traffic
- 4,810Total future (year 2028) average daily traffic
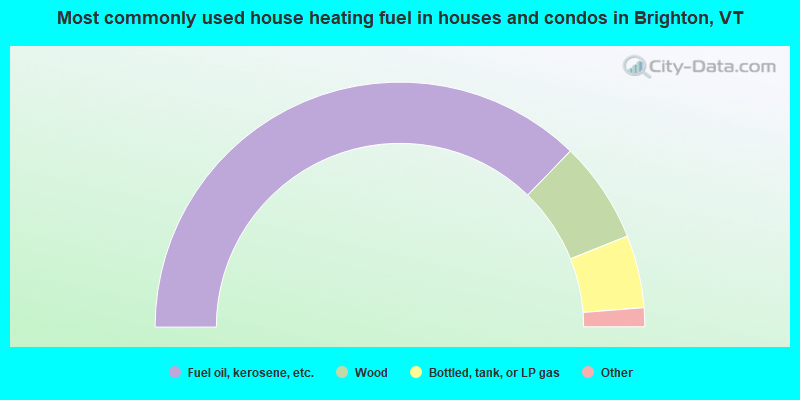
- 74.5%Fuel oil, kerosene, etc.
- 13.4%Wood
- 9.6%Bottled, tank, or LP gas
- 1.9%Electricity
- 0.5%Utility gas
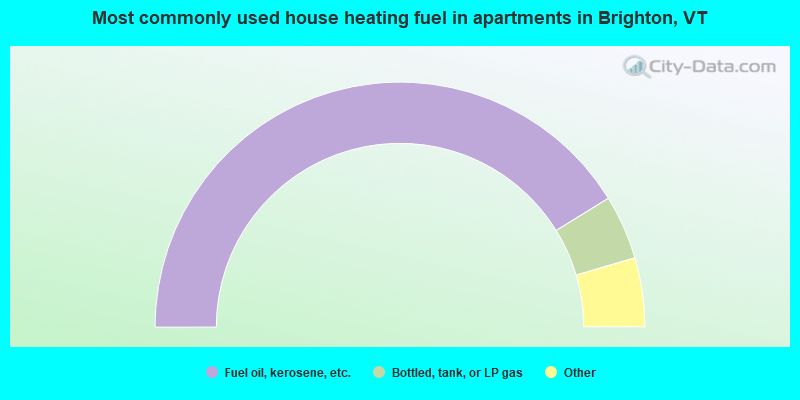
- 82.3%Fuel oil, kerosene, etc.
- 8.5%Bottled, tank, or LP gas
- 3.7%Wood
- 2.4%No fuel used
- 1.8%Electricity
- 1.2%Utility gas
Brighton compared to Vermont state average:
- Median household income below state average.
- Median house value below state average.
- Black race population percentage below state average.
- Hispanic race population percentage below state average.
- Foreign-born population percentage above state average.
- Length of stay since moving in significantly above state average.
- Number of rooms per house significantly below state average.
- House age significantly below state average.
- Number of college students below state average.
- Percentage of population with a bachelor's degree or higher significantly below state average.
Brighton on our top lists:
- #39 on the list of "Top 101 cities with the most residents born in Northern America (population 500+)"
- #39 on the list of "Top 101 cities with the most residents born in Canada (population 500+)"
- #41 (05846) on the list of "Top 101 zip codes with the lowest charity contributions deductions as a percentage of AGI in 2012 (pop 1,000+)"
- #43 on the list of "Top 101 counties with the lowest surface withdrawal of fresh water for public supply"

|
Total of 1 patent application in 2008-2024.