Brighton, VT (Vermont) Houses and Residents
| Brighton: | $154,536 |
| Vermont: | $304,700 |
Total population: 1,222 (Urban population: 0, Rural population: 1,260 (25 farm, 1,235 nonfarm))
Houses: 891 (529 occupied: 365 owner occupied, 164 renter occupied)
| % of renters here: | 31% |
| State: | 26% |
Housing density: 17 houses/condos per square mile
Median price asked for vacant for-sale houses and condos in 2022 in this county: $68,366.
Median contract rent in 2022: $729 (lower quartile is $563, upper quartile is $781)
Median rent asked for vacant for-rent units in 2022: $754
Median gross rent in Brighton, VT in 2022: $803
Housing units in Brighton with a mortgage: 108 (0 second mortgage, 9 home equity loan, 0 both second mortgage and home equity loan)
Houses without a mortgage: 125


Household type by relationship:
Households: 6,290- In family households: 5,087 (1,345 male householders, 469 female householders)
1,438 spouses, 1,454 children (1,312 natural, 47 adopted, 95 stepchildren), 75 grandchildren, 27 brothers or sisters, 31 parents, foster children, 37 other relatives, 182 non-relatives
- In nonfamily households: 1,203 (543 male householders (441 living alone)), 461 female householders (385 living alone)), 199 nonrelatives
- In group quarters: 16 (0 institutionalized population)
1,185 married couples with children.
365 single-parent households (133 men, 232 women).
89.4% of residents of Brighton speak English at home.
0.2% of residents speak Spanish at home (100% speak English very well).
10.1% of residents speak other Indo-European language at home (68% speak English very well, 18% speak English well, 14% speak English not well).
0.2% of residents speak Asian or Pacific Island language at home (100% speak English very well).
0.2% of residents speak other language at home (100% speak English very well).
Foreign born population: 93 (6.6%)
(74.2% of them are naturalized citizens)
| Here: | 6.4 |
| State: | 6.4 |
| Here: | 4.3 |
| State: | 3.9 |

- Bedrooms in owner-occupied houses and condos in Brighton, Vermont
- 5no bedroom
- 161 bedroom
- 752 bedrooms
- 1633 bedrooms
- 814 bedrooms
- 255+ bedrooms

- Bedrooms in renter-occupied apartments in Brighton, Vermont
- 0no bedroom
- 611 bedroom
- 382 bedrooms
- 533 bedrooms
- 124 bedrooms
- 05+ bedrooms

- Cars and other vehicles available in Brighton in owner-occupied houses/condos
- 22no vehicle
- 911 vehicle
- 1902 vehicles
- 413 vehicles
- 174 vehicles
- 45+ vehicles

- Cars and other vehicles available in Brighton in renter-occupied apartments
- 42no vehicle
- 651 vehicle
- 492 vehicles
- 83 vehicles
- 04 vehicles
- 05+ vehicles

- Rooms in owner-occupied houses in Brighton, Vermont
- 31 room
- 42 rooms
- 103 rooms
- 384 rooms
- 775 rooms
- 836 rooms
- 647 rooms
- 408 rooms
- 469+ rooms

- Rooms in renter-occupied apartments in Brighton, Vermont
- 01 room
- 152 rooms
- 463 rooms
- 284 rooms
- 325 rooms
- 226 rooms
- 197 rooms
- 28 rooms
- 09+ rooms


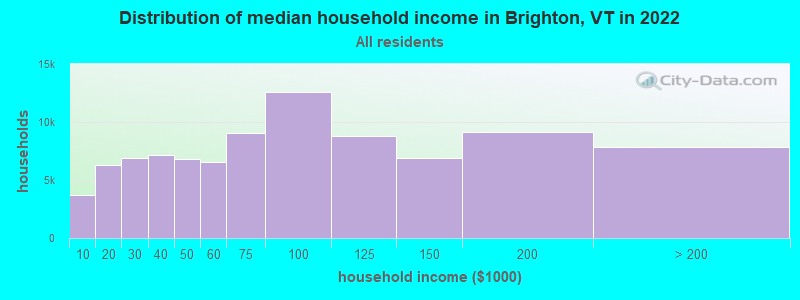
Brighton, VT household income distribution

- 3,319Less than $10,000
- 6,776$10,000 to $19,999
- 7,779$20,000 to $29,999
- 9,054$30,000 to $39,999
- 8,398$40,000 to $49,999
- 8,183$50,000 to $59,999
- 10,892$60,000 to $74,999
- 16,486$75,000 to $99,999
- 10,917$100,000 to $124,999
- 8,716$125,000 to $149,999
- 11,067$150,000 to $199,999
- 9,997$200,000 or more
Percentage of workers working in this county: 61.9%
Number of people working at home: 92 (17.2% of all workers)
Travel time to work (commute)
- Less than 5 minutes: 62
- 5 to 9 minutes: 127
- 10 to 14 minutes: 50
- 15 to 19 minutes: 19
- 20 to 24 minutes: 36
- 25 to 29 minutes: 14
- 30 to 34 minutes: 60
- 35 to 39 minutes: 8
- 40 to 44 minutes: 33
- 45 to 59 minutes: 34
- 60 to 89 minutes: 11
- 90 or more minutes: 3
Means of transportation to work:
- Drove a car alone: 356 (72.5%)
- Carpooled: 67 (13.6%)
- Bus or trolley bus: 2 (0.4%)
- Walked: 25 (5.1%)
- Other means: 7 (1.4%)
- Worked at home: 34 (6.9%)

- Year of entry for the foreign-born population in Brighton, Vermont
- 41995 to March 2000
- 21990 to 1994
- 51985 to 1989
- 01980 to 1984
- 41975 to 1979
- 81970 to 1974
- 81965 to 1969
- 54Before 1965

First ancestries reported:
- French: 430 (31.5%)
- English: 197 (14.4%)
- United States: 156 (11.4%)
- Irish: 136 (10.0%)
- Other: 131 (9.6%)
- Scottish: 71 (5.2%)
- Italian: 60 (4.4%)
- German: 43 (3.2%)
- French Canadian: 42 (3.1%)
- Scotch-Irish: 22 (1.6%)
- Swedish: 14 (1.0%)
- Dutch: 13 (1.0%)
- Portuguese: 10 (0.7%)
- Polish: 9 (0.7%)
- Russian: 9 (0.7%)
- Swiss: 6 (0.4%)
- Greek: 4 (0.3%)
- Welsh: 4 (0.3%)
- Norwegian: 3 (0.2%)
- Lithuanian: 2 (0.1%)
- Ukrainian: 2 (0.1%)
Most common places of birth for foreign-born residents (%):
| Brighton: | 83.5% (71) |
| Vermont: | 34.0% (7,912) |
| Brighton: | 2.4% (2) |
| Vermont: | 7.5% (1,744) |
| Brighton: | 2.4% (2) |
| Vermont: | 0.7% (152) |
| Brighton: | 2.4% (2) |
| Vermont: | 7.2% (1,669) |
| Brighton: | 2.4% (2) |
| Vermont: | 0.6% (144) |
| Brighton: | 2.4% (2) |
| Vermont: | 1.6% (372) |
| Brighton: | 2.4% (2) |
| Vermont: | 2.9% (673) |
| Brighton: | 2.4% (2) |
| Vermont: | 0.5% (106) |
Place of birth for U.S.-born residents:
- This state: 768
- Other state: 403
- Northeast: 344
- Midwest: 11
- South: 29
- West: 19
69% of Brighton residents lived in the same house 5 years ago.
Out of people who lived in different houses, 50% lived in this county.
Out of people who lived in different counties, 62% lived in Vermont.
Education attainment for males 25 years and older:
- No schooling: 0
- Nursery to 4th grade: 4
- 5th and 6th grade: 13
- 7th and 8th grade: 48
- 9th grade: 18
- 10th grade: 20
- 11th grade: 10
- 12th grade, no diploma: 13
- High school graduate (or equivalency): 174
- Less than 1 year of college: 21
- Some college more than 1 year, no degree: 31
- Associate degree: 16
- Bachelor's degree: 16
- Master's degree: 13
- Professional school degree: 3
- Doctorate degree: 6

Education attainment for females 25 years and older:
- No schooling: 2
- Nursery to 4th grade: 2
- 5th and 6th grade: 6
- 7th and 8th grade: 37
- 9th grade: 9
- 10th grade: 23
- 11th grade: 13
- 12th grade, no diploma: 9
- High school graduate (or equivalency): 193
- Less than 1 year of college: 23
- Some college more than 1 year, no degree: 44
- Associate degree: 18
- Bachelor's degree: 35
- Master's degree: 20
- Professional school degree: 2
- Doctorate degree: 0


Housing units in structures:
- One, detached: 611
- One, attached: 8
- Two: 75
- 3 or 4: 66
- 5 to 9: 37
- 20 to 49: 22
- Mobile homes: 66
- Boats, RVs, vans, etc.: 6
Median worth of mobile homes: $93,100
Housing units lacking complete kitchen facilities: 5.9%

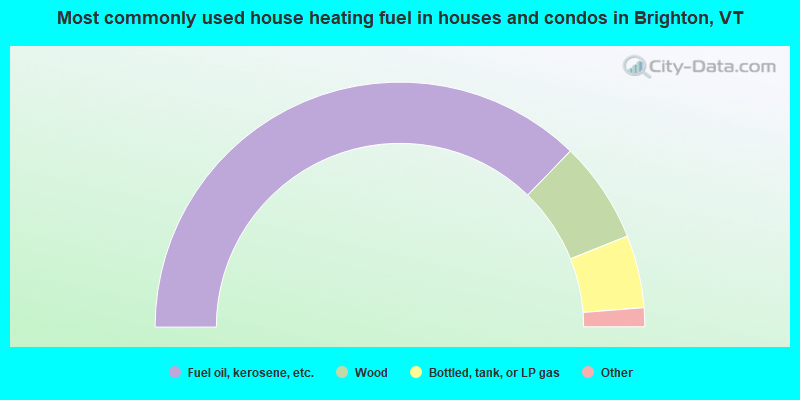
- 74.5%Fuel oil, kerosene, etc.
- 13.4%Wood
- 9.6%Bottled, tank, or LP gas
- 1.9%Electricity
- 0.5%Utility gas
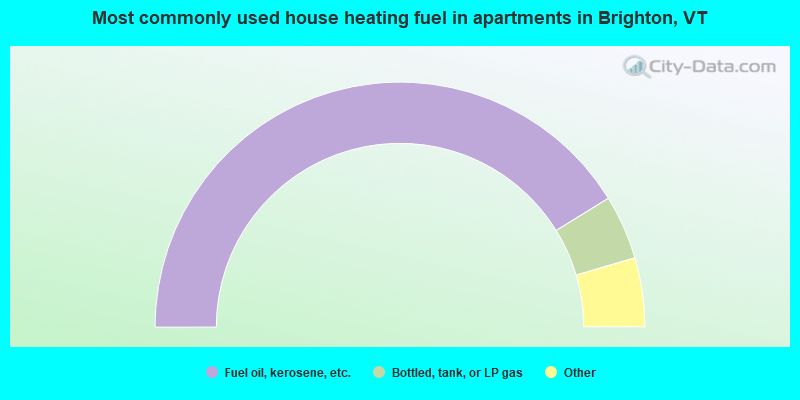
- 82.3%Fuel oil, kerosene, etc.
- 8.5%Bottled, tank, or LP gas
- 3.7%Wood
- 2.4%No fuel used
- 1.8%Electricity
- 1.2%Utility gas
Private vs. public school enrollment:
| Here: | 3.1% |
| Vermont: | 7.2% |
| Here: | 0.0% |
| Vermont: | 10.4% |
| Here: | 29.2% |
| Vermont: | 37.7% |


