Allen, New York
Submit your own pictures of this town and show them to the world
- OSM Map
- Google Map
- MSN Map
Population change since 2000: -3.0%
 |
| Males: 236 | |
| Females: 212 |
| Median resident age: | 42.8 years |
| New York median age: | 40.7 years |
Zip codes: 14735.
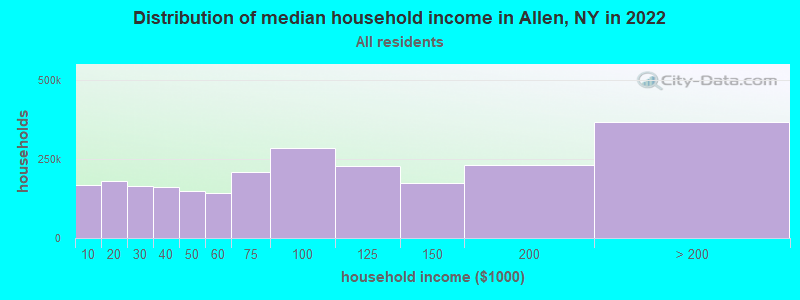
| Allen: | $48,966 |
| NY: | $79,557 |
Estimated per capita income in 2022: $26,465 (it was $13,830 in 2000)
Allen town income, earnings, and wages data
Estimated median house or condo value in 2022: $102,269 (it was $54,000 in 2000)
| Allen: | $102,269 |
| NY: | $400,400 |
Mean prices in 2022: all housing units: $130,143; detached houses: $133,956; townhouses or other attached units: $933,393; in 2-unit structures: $134,751; in 3-to-4-unit structures: $363,909; in 5-or-more-unit structures: $254,137; mobile homes: $80,414; occupied boats, rvs, vans, etc.: $180,265
Detailed information about poverty and poor residents in Allen, NY
Compare current foreclosures near Allen, NY:
| Photo | Address | Area | Beds / Baths | Price | Details |
|---|---|---|---|---|---|

|
#1
Vandermark Rd
Scio, NY 14880
|
- sq. feet
|
1 baths 3 beds |
$34,900
|
show details |

|
#2
Route 19
Fillmore, NY 14735
|
1,601 sq. feet
|
2 baths 3 beds |
show details | |

|
#3
County Road 23
Houghton, NY 14744
|
1,296 sq. feet
|
1 baths 3 beds |
show details | |

|
#4
Clark Rd
Alfred Station, NY 14803
|
2,520 sq. feet
|
2 baths 4 beds |
show details | |

|
#5
Freedom Rd
Freedom, NY 14065
|
1,749 sq. feet
|
1 baths 4 beds |
show details | |

|
#6
Osmun Rd
Farmersville Station, NY 14060
|
720 sq. feet
|
2 baths 4 beds |
show details | |

|
#7
State Route 244
Belmont, NY 14813
|
- sq. feet
|
- baths - beds |
show details | |

|
#8
State Route 244
Belmont, NY 14813
|
- sq. feet
|
- baths - beds |
show details | |

|
#9
Woodworth Ln
Nunda, NY 14517
|
- sq. feet
|
- baths - beds |
show details | |

|
#10
State Route 436
Nunda, NY 14517
|
- sq. feet
|
- baths - beds |
show details |
| Photo | Address | Area | Beds / Baths | Price | Details |
|---|---|---|---|---|---|

|
#11
Crestlane Dr
Franklinville, NY 14737
|
- sq. feet
|
- baths - beds |
show details | |

|
#12
Route 98
Farmersville Station, NY 14060
|
- sq. feet
|
- baths - beds |
show details | |

|
#13
Route 98
Farmersville Station, NY 14060
|
- sq. feet
|
- baths - beds |
show details | |

|
#14
Clark Rd
Alfred Station, NY 14803
|
- sq. feet
|
- baths - beds |
show details | |

|
Check over 1 million property listings on Foreclosure.com!
|
browse all offers | |||

- 43897.8%White alone
- 51.1%Two or more races
- 40.9%Hispanic
- 10.2%Asian alone
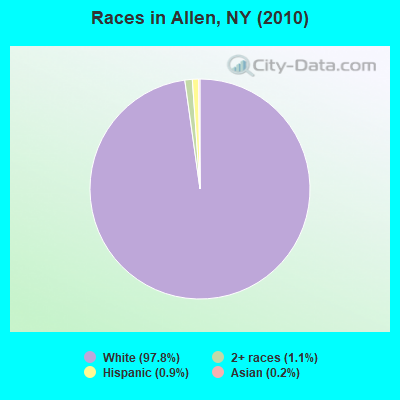
Races in Allen detailed stats: ancestries, foreign born residents, place of birth
 Recent articles from our blog. Our writers, many of them Ph.D. graduates or candidates, create easy-to-read articles on a wide variety of topics.
Ancestries: German (35.9%), United States (15.2%), English (13.9%), Irish (11.7%), Polish (7.4%), Italian (3.2%).
Current Local Time: EST time zone
Incorporated in 1823
Land area: 36.4 square miles.
Population density: 12 people per square mile (very low).
| Allen town: | 1.8% ($970) |
| New York: | 1.9% ($2,847) |
Nearest city with pop. 50,000+: Cheektowaga, NY  (51.5 miles , pop. 79,988).
Nearest city with pop. 200,000+: Buffalo, NY (54.6 miles , pop. 292,648).
Nearest city with pop. 1,000,000+: Philadelphia, PA (223.7 miles , pop. 1,517,550).
Nearest cities:
), ), ), ), )Latitude: 42.40 N, Longitude: 78.02 W
Area code commonly used in this area: 585
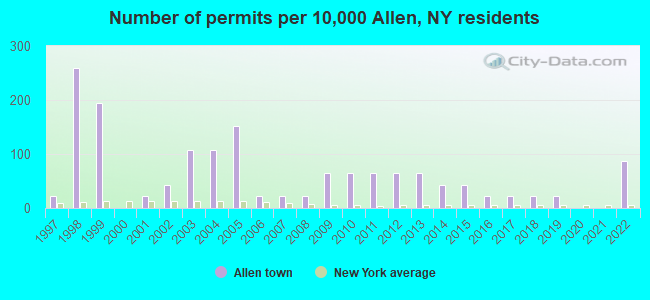
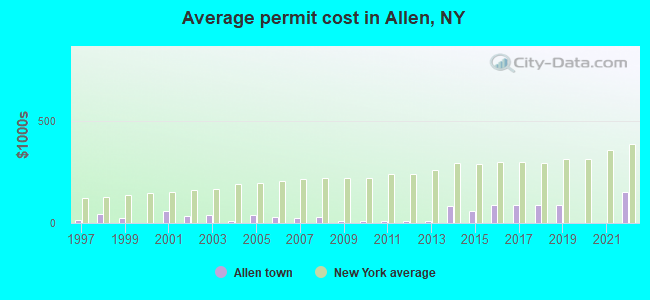
Single-family new house construction building permits:
- 2022: 4 buildings, average cost: $148,800
- 2019: 1 building, cost: $90,000
- 2018: 1 building, cost: $90,000
- 2017: 1 building, cost: $90,000
- 2016: 1 building, cost: $90,000
- 2015: 2 buildings, average cost: $60,000
- 2014: 2 buildings, average cost: $83,000
- 2013: 3 buildings, average cost: $10,400
- 2012: 3 buildings, average cost: $10,400
- 2011: 3 buildings, average cost: $10,400
- 2010: 3 buildings, average cost: $10,400
- 2009: 3 buildings, average cost: $10,400
- 2008: 1 building, cost: $30,000
- 2007: 1 building, cost: $25,000
- 2006: 1 building, cost: $30,000
- 2005: 7 buildings, average cost: $37,100
- 2004: 5 buildings, average cost: $10,500
- 2003: 5 buildings, average cost: $41,200
- 2002: 2 buildings, average cost: $35,000
- 2001: 1 building, cost: $60,000
- 1999: 9 buildings, average cost: $25,000
- 1998: 12 buildings, average cost: $45,900
- 1997: 1 building, cost: $16,000
| Here: | 4.9% |
| New York: | 4.4% |
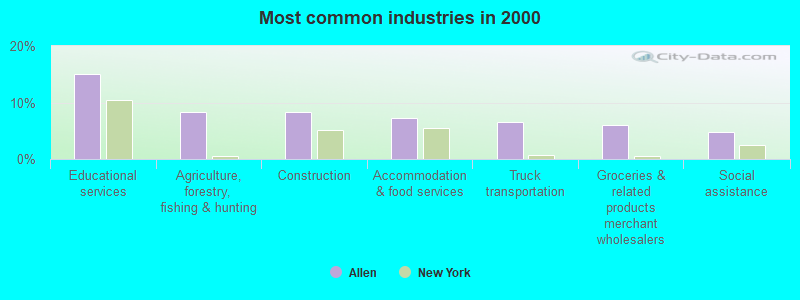
- Educational services (15.0%)
- Agriculture, forestry, fishing & hunting (8.4%)
- Construction (8.4%)
- Accommodation & food services (7.2%)
- Truck transportation (6.6%)
- Groceries & related products merchant wholesalers (6.0%)
- Social assistance (4.8%)
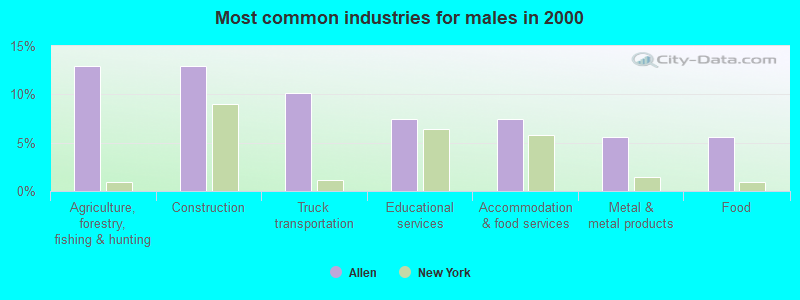
- Agriculture, forestry, fishing & hunting (13.0%)
- Construction (13.0%)
- Truck transportation (10.2%)
- Educational services (7.4%)
- Accommodation & food services (7.4%)
- Metal & metal products (5.6%)
- Food (5.6%)
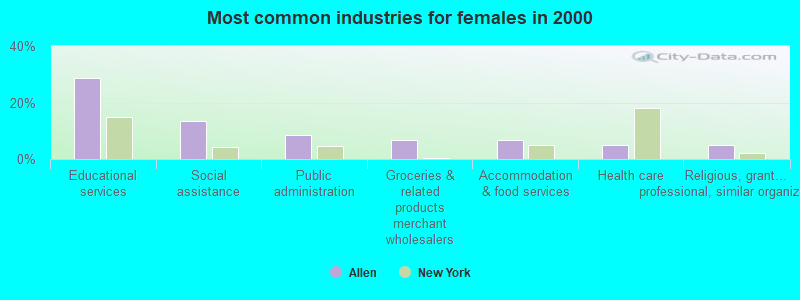
- Educational services (28.8%)
- Social assistance (13.6%)
- Public administration (8.5%)
- Groceries & related products merchant wholesalers (6.8%)
- Accommodation & food services (6.8%)
- Health care (5.1%)
- Religious, grantmaking, civic, professional, similar organizations (5.1%)
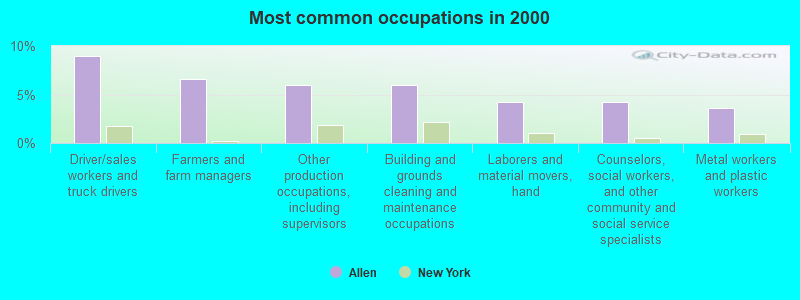
- Driver/sales workers and truck drivers (9.0%)
- Farmers and farm managers (6.6%)
- Other production occupations, including supervisors (6.0%)
- Building and grounds cleaning and maintenance occupations (6.0%)
- Laborers and material movers, hand (4.2%)
- Counselors, social workers, and other community and social service specialists (4.2%)
- Metal workers and plastic workers (3.6%)
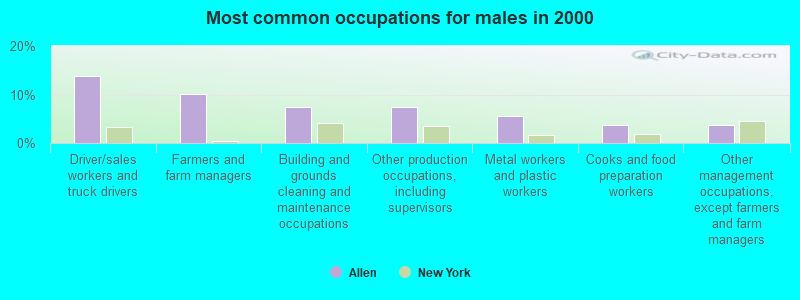
- Driver/sales workers and truck drivers (13.9%)
- Farmers and farm managers (10.2%)
- Building and grounds cleaning and maintenance occupations (7.4%)
- Other production occupations, including supervisors (7.4%)
- Metal workers and plastic workers (5.6%)
- Cooks and food preparation workers (3.7%)
- Other management occupations, except farmers and farm managers (3.7%)
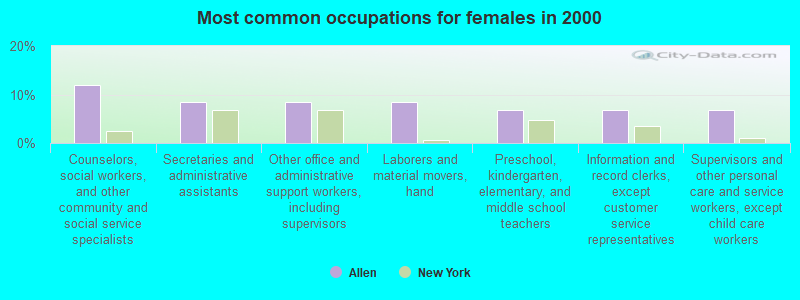
- Counselors, social workers, and other community and social service specialists (11.9%)
- Secretaries and administrative assistants (8.5%)
- Other office and administrative support workers, including supervisors (8.5%)
- Laborers and material movers, hand (8.5%)
- Preschool, kindergarten, elementary, and middle school teachers (6.8%)
- Information and record clerks, except customer service representatives (6.8%)
- Supervisors and other personal care and service workers, except child care workers (6.8%)
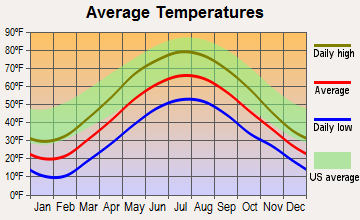
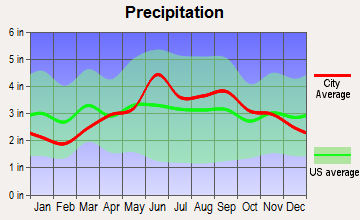
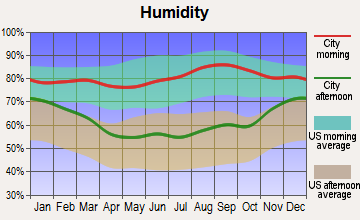
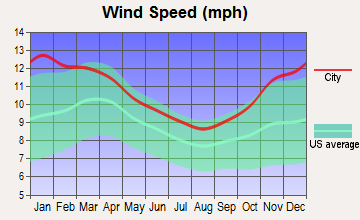
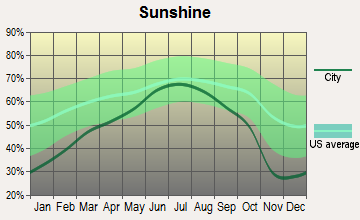
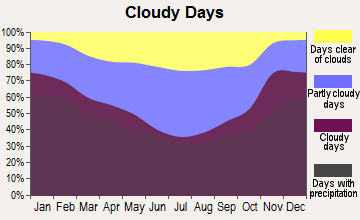
Average climate in Allen, New York
Based on data reported by over 4,000 weather stations

Tornado activity:
Allen-area historical tornado activity is near New York state average. It is 64% smaller than the overall U.S. average.
On 6/20/1969, a category F3 (max. wind speeds 158-206 mph) tornado 5.9 miles away from the Allen town center caused between $500,000 and $5,000,000 in damages.
On 7/24/1967, a category F3 tornado 23.5 miles away from the town center caused between $5000 and $50,000 in damages.
Earthquake activity:
Allen-area historical earthquake activity is significantly above New York state average. It is 66% smaller than the overall U.S. average.On 9/25/1998 at 19:52:52, a magnitude 5.2 (4.8 MB, 4.3 MS, 5.2 LG, 4.5 MW, Depth: 3.1 mi, Class: Moderate, Intensity: VI - VII) earthquake occurred 137.4 miles away from the city center
On 10/7/1983 at 10:18:46, a magnitude 5.3 (5.1 MB, 5.3 LG, 5.1 ML) earthquake occurred 214.3 miles away from Allen center
On 8/23/2011 at 17:51:04, a magnitude 5.8 (5.8 MW, Depth: 3.7 mi) earthquake occurred 310.8 miles away from the city center
On 1/31/1986 at 16:46:43, a magnitude 5.0 (5.0 MB) earthquake occurred 170.5 miles away from the city center
On 4/20/2002 at 10:50:47, a magnitude 5.3 (5.3 ML, Depth: 3.0 mi) earthquake occurred 261.5 miles away from Allen center
On 4/20/2002 at 10:50:47, a magnitude 5.2 (5.2 MB, 4.2 MS, 5.2 MW, 5.0 MW) earthquake occurred 259.7 miles away from the city center
Magnitude types: regional Lg-wave magnitude (LG), body-wave magnitude (MB), local magnitude (ML), surface-wave magnitude (MS), moment magnitude (MW)
Natural disasters:
The number of natural disasters in Allegany County (21) is greater than the US average (15).Major Disasters (Presidential) Declared: 16
Emergencies Declared: 5
Causes of natural disasters: Storms: 14, Floods: 12, Hurricanes: 2, Tornadoes: 2, Blizzard: 1, Heavy Rain: 1, Landslide: 1, Power Outage: 1, Tropical Storm: 1, Wind: 1, Winter Storm: 1, Other: 2 (Note: some incidents may be assigned to more than one category).
Colleges/universities with over 2000 students nearest to Allen:
- SUNY College of Technology at Alfred (about 16 miles; Alfred, NY; Full-time enrollment: 3,483)
- Alfred University (about 16 miles; Alfred, NY; FT enrollment: 2,411)
- SUNY College at Geneseo (about 30 miles; Geneseo, NY; FT enrollment: 5,520)
- St Bonaventure University (about 33 miles; Saint Bonaventure, NY; FT enrollment: 2,286)
- Genesee Community College (about 43 miles; Batavia, NY; FT enrollment: 4,290)
- Bryant & Stratton College-Online (about 47 miles; Orchard Park, NY; FT enrollment: 2,212)
- Rochester Institute of Technology (about 51 miles; Rochester, NY; FT enrollment: 14,177)
Points of interest:
Notable locations in Allen: State Road (A), Basswood Hill Farm (B), Evergreen Trails Campground (C). Display/hide their locations on the map
Church in Allen: Saint Pauls Church (A). Display/hide its location on the map
Cemeteries: Basswood Hill Cemetery (1), White Cemetery (2), Allen Cemetery (3). Display/hide their locations on the map
Lake: Jones Pond (A). Display/hide its location on the map
| This town: | 2.5 people |
| New York: | 2.6 people |
| This town: | 68.2% |
| Whole state: | 63.5% |
| This town: | 7.8% |
| Whole state: | 6.8% |
Likely homosexual households (counted as self-reported same-sex unmarried-partner households)
- Lesbian couples: 1.7% of all households
- Gay men: 0.0% of all households
| This town: | 18.7% |
| Whole state: | 14.6% |
| This town: | 5.2% |
| Whole state: | 7.4% |
For population 15 years and over in Allen:
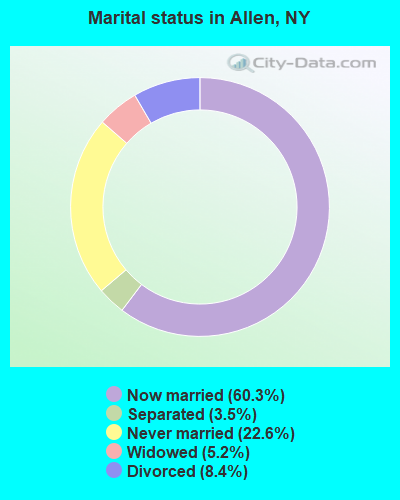
- Never married: 22.6%
- Now married: 60.3%
- Separated: 3.5%
- Widowed: 5.2%
- Divorced: 8.4%
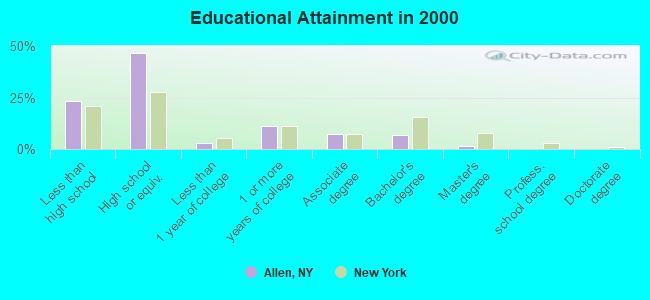
For population 25 years and over in Allen:
- High school or higher: 76.6%
- Bachelor's degree or higher: 8.2%
- Graduate or professional degree: 1.6%
- Unemployed: 10.2%
- Mean travel time to work (commute): 37.3 minutes
| Here: | 8.8 |
| New York average: | 14.2 |
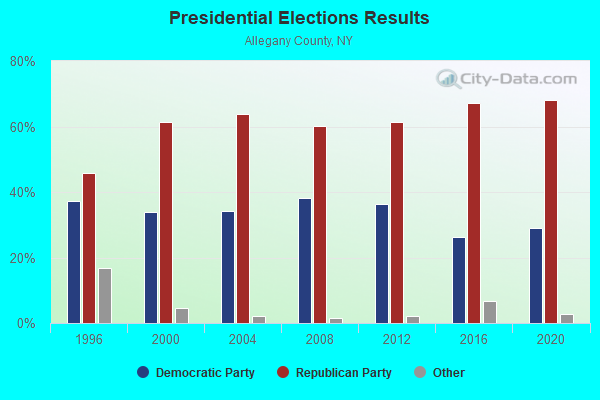
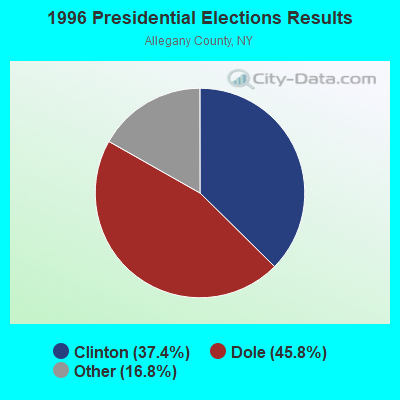

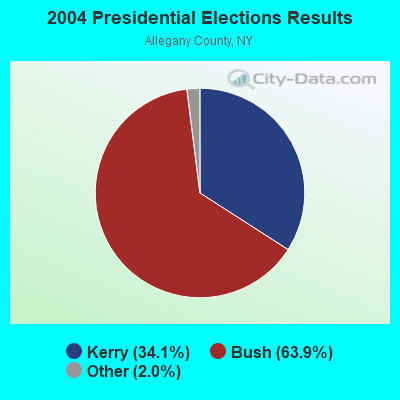
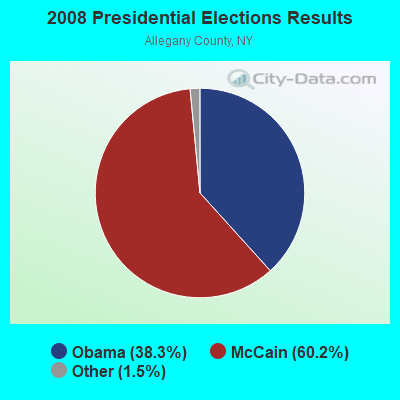
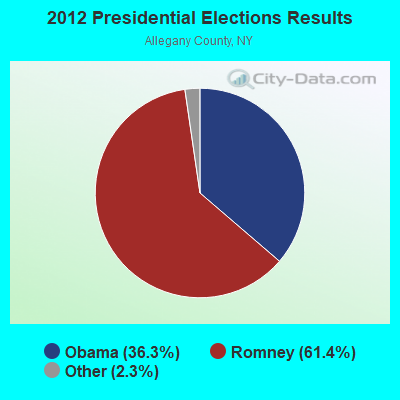
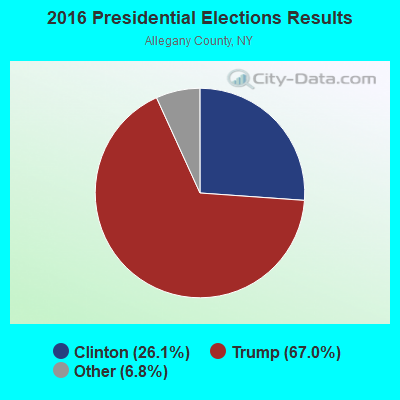
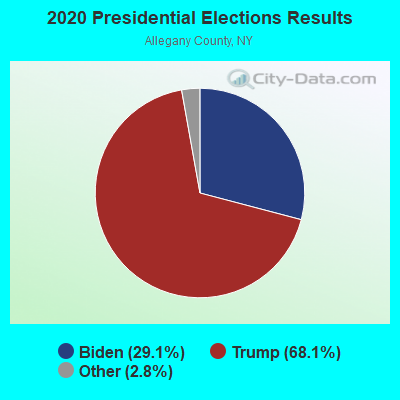
Graphs represent county-level data. Detailed 2008 Election Results
Religion statistics for Allen, NY (based on Allegany County data)
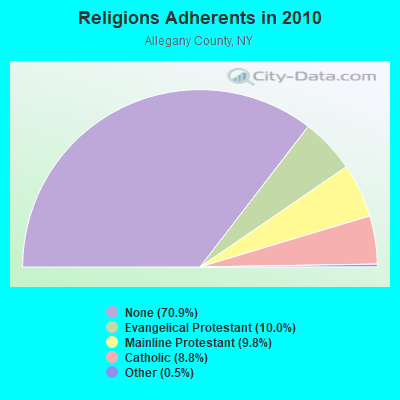
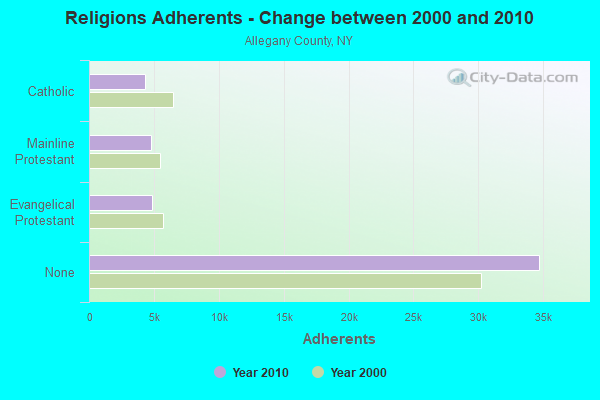
| Religion | Adherents | Congregations |
|---|---|---|
| Evangelical Protestant | 4,881 | 46 |
| Mainline Protestant | 4,798 | 39 |
| Catholic | 4,313 | 10 |
| Other | 244 | 4 |
| None | 34,710 | - |
Food Environment Statistics:
| Allegany County: | 3.03 / 10,000 pop. |
| New York: | 4.13 / 10,000 pop. |
| Allegany County: | 0.40 / 10,000 pop. |
| New York: | 0.92 / 10,000 pop. |
| Allegany County: | 5.25 / 10,000 pop. |
| State: | 1.68 / 10,000 pop. |
| Here: | 8.48 / 10,000 pop. |
| State: | 8.82 / 10,000 pop. |
| This county: | 8.8% |
| New York: | 8.2% |
| Allegany County: | 25.6% |
| New York: | 23.8% |
| This county: | 11.5% |
| State: | 15.6% |
Strongest AM radio stations in Allen:
- WHAM (1180 AM; 50 kW; ROCHESTER, NY; Owner: CITICASTERS LICENSES, L.P.)
- WWKB (1520 AM; 50 kW; BUFFALO, NY; Owner: ENTERCOM BUFFALO LICENSE, LLC)
- WHHO (1320 AM; 5 kW; HORNELL, NY; Owner: BILBAT RADIO, INC.)
- WABH (1380 AM; 10 kW; BATH, NY)
- WCJW (1140 AM; daytime; 2 kW; WARSAW, NY; Owner: LLOYD LANE, INCORPORATED)
- WLEA (1480 AM; 2 kW; HORNELL, NY; Owner: PMJ COMMUNICATIONS, INC.)
- WGR (550 AM; 5 kW; BUFFALO, NY; Owner: ENTERCOM BUFFALO LICENSE, LLC)
- WLSV (790 AM; 1 kW; WELLSVILLE, NY; Owner: DBM COMMUNICATIONS, INC.)
- WGGO (1590 AM; 5 kW; SALAMANCA, NY; Owner: CATT COMMUNICATIONS, INC.)
- WTOR (770 AM; daytime; 9 kW; YOUNGSTOWN, NY; Owner: BIRACH BROADCASTING CORPORATION)
- WNED (970 AM; 5 kW; BUFFALO, NY)
- WYSL (1040 AM; 2 kW; AVON, NY; Owner: RADIO LIVINGSTON, LTD)
- WXRL (1300 AM; 5 kW; LANCASTER, NY; Owner: DOME BROADCASTING, INC.)
Strongest FM radio stations in Allen:
- WZKZ (101.9 FM; ALFRED, NY; Owner: PEMBROOK PINES ELMIRA, LTD.)
- WNSA (107.7 FM; WETHERSFIELD TWNSHP, NY; Owner: ADELPHIA COMMUNICATIONS CORPORATION, DEBTOR-IN-POSSESSION)
- WJSL (90.3 FM; HOUGHTON, NY; Owner: WXXI PUBLIC BROADCASTING COUNCIL)
- WDNY-FM (93.9 FM; DANSVILLE, NY; Owner: MILLER MEDIA INC.)
- WTSS (102.5 FM; BUFFALO, NY; Owner: ENTERCOM BUFFALO LICENSE, LLC)
- W201CY (88.1 FM; DANSVILLE, NY; Owner: MARS HILL BROADCASTING CO., INC.)
- W246AP (97.1 FM; DANSVILLE, NY; Owner: CALVARY CHAPEL OF THE FINGER LAKES)
- W282AC (104.3 FM; DANSVILLE, NY; Owner: FAMILY LIFE MINISTRIES, INC.)
- WKPQ (105.3 FM; HORNELL, NY; Owner: BILBAT RADIO, INC.)
- WCKR (92.1 FM; HORNELL, NY; Owner: PMJ COMMUNICATIONS, INC.)
- WJQZ (103.5 FM; WELLSVILLE, NY; Owner: DBM COMMUNICATIONS, INC.)
- WCID (89.1 FM; FRIENDSHIP, NY; Owner: FAMILY LIFE MINISTRIES, INC.)
- WETD (90.7 FM; ALFRED, NY; Owner: STATE UNIVERSITY OF NEW YORK)
- WCIY (88.9 FM; CANANDAIGUA, NY; Owner: FAMILY LIFE MINISTRIES, INC.)
- WSQA (88.7 FM; HORNELL, NY; Owner: WSKG PUBLIC TELECOMMUNICATIONS COUNCIL)
- WFXF (107.3 FM; SOUTH BRISTOL TOWNSH, NY; Owner: CITICASTERS LICENSES, L.P.)
- WNVE (95.1 FM; HONEOYE FALLS, NY; Owner: CITICASTERS LICENSES, L.P.)
- W257AX (99.3 FM; HORNELL, NY; Owner: FAMILY LIFE MINISTRIES, INC.)
- WPIG (95.7 FM; OLEAN, NY; Owner: ARROW COMMUNICATIONS OF N.Y., INC.)
- WOLN (91.3 FM; OLEAN, NY; Owner: STATE UNIVERSITY OF NEW YORK)
TV broadcast stations around Allen:
- WKBW-TV (Channel 7; BUFFALO, NY; Owner: WKBW-TV LICENSE, INC.)
- WGRZ-TV (Channel 2; BUFFALO, NY; Owner: MULTIMEDIA ENTERTAINMENT, INC.)
- WNGS (Channel 67; SPRINGVILLE, NY; Owner: CAROLINE K. POWLEY D/B/A UNICORN/SPRINGVILLE)
- WNYO-TV (Channel 49; BUFFALO, NY; Owner: NEW YORK TELEVISION, INC.)
- WPXJ-TV (Channel 51; BATAVIA, NY; Owner: PAXSON BUFFALO LICENSE, INC.)
- WIVB-TV (Channel 4; BUFFALO, NY; Owner: WIVB BROADCASTING, LLC)
- W16BE (Channel 16; HORNELL, NY; Owner: WYDC, INC.)
- W62AQ (Channel 62; FILLMORE, NY; Owner: WESTERN NEW YORK PUBLIC B/CING.ASSN.)
- W65AJ (Channel 65; ANGELICA, ETC., NY; Owner: WESTERN NEW YORK PUBLIC B/CING.ASSN.)
- National Bridge Inventory (NBI) Statistics
- 6Number of bridges
- 26ft / 7.9mTotal length
- $5,122,000Total costs
- 1,895Total average daily traffic
- 159Total average daily truck traffic
- 2,069Total future (year 2038) average daily traffic
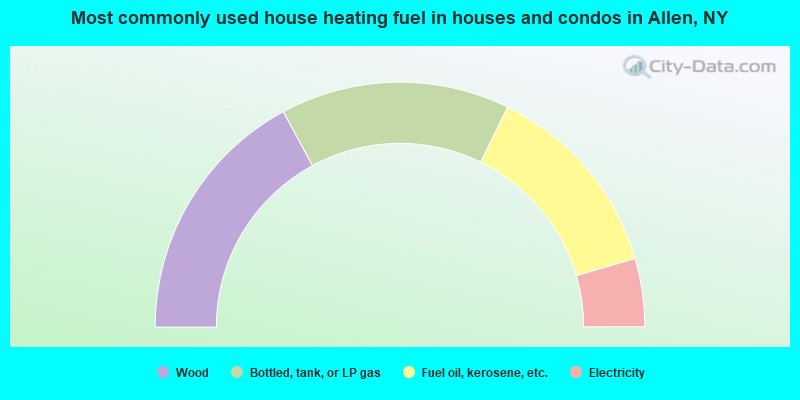
- 34.2%Wood
- 30.3%Bottled, tank, or LP gas
- 26.5%Fuel oil, kerosene, etc.
- 9.0%Electricity
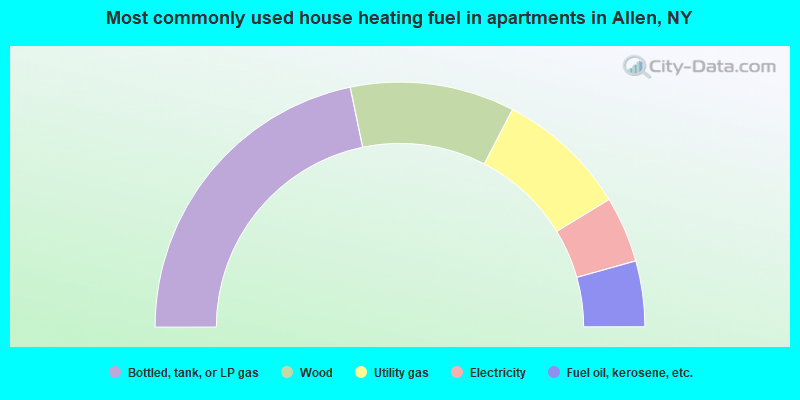
- 43.5%Bottled, tank, or LP gas
- 21.7%Wood
- 17.4%Utility gas
- 8.7%Electricity
- 8.7%Fuel oil, kerosene, etc.
Allen compared to New York state average:
- Median household income below state average.
- Median house value significantly below state average.
- Black race population percentage significantly below state average.
- Hispanic race population percentage significantly below state average.
- Foreign-born population percentage significantly below state average.
- Renting percentage significantly below state average.
- Length of stay since moving in significantly above state average.
- Number of rooms per house significantly below state average.
- House age significantly below state average.
- Number of college students below state average.
- Percentage of population with a bachelor's degree or higher significantly below state average.