Races in Allen, New York (NY) Detailed Stats
Ancestries, Foreign-born residents, place of birth
Race distribution in Allen

- 45798.9%White alone
- 20.4%Two or more races
- 20.4%American Indian alone
- 10.2%Hispanic

2000
2022
-
- 11,760,98162.0%White alone
- 2,867,58315.1%Hispanic
- 2,812,62314.8%Black alone
- 1,035,9265.5%Asian alone
- 366,1161.9%Two or more races
- 75,4990.4%Other race alone
- 52,4990.3%American Indian alone
- 5,2300.03%Native Hawaiian and Other
Pacific Islander alone

-
- 10,408,93352.9%White alone
- 3,867,29919.7%Hispanic
- 2,633,84013.4%Black alone
- 1,776,2869.0%Asian alone
- 732,6703.7%Two or more races
- 216,1101.1%Other race alone
- 35,0820.2%American Indian alone
- 6,9310.04%Native Hawaiian and Other
Pacific Islander alone

Income and house value in Allen
- Median household income in 2022
- $49,145White non-Hispanic householders
- Median 2022 house value
- $91,852White Non-Hispanic householders
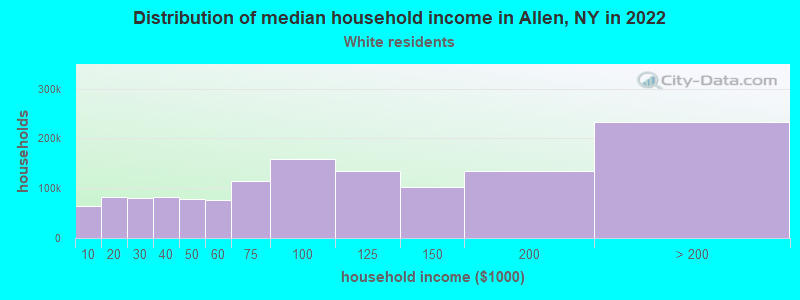
Household income for White non-Hispanic householders
Ancestries in Allen

- 16634.8%German
- 7014.7%United States
- 6413.4%English
- 5411.3%Irish
- 347.1%Polish
- 316.5%Other
- 153.1%Italian
- 122.5%Dutch
- 91.9%French
- 71.5%French Canadian
- 71.5%Scotch-Irish
- 40.8%Swedish
- 20.4%Norwegian
- 20.4%Scottish

Zip codes: 14735.