Allen, New York (NY) income map, earnings map, and wages data
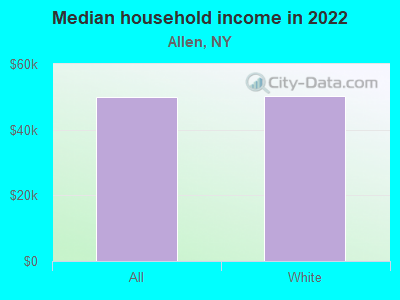
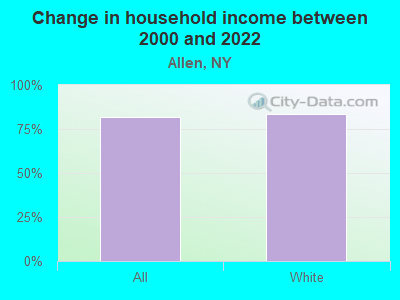
The median household income in Allen, NY in 2022 was $49,855, which was 59.6% less than the median annual income of $79,557 across the entire state of New York. Compared to the median income of $27,386 in 2000 this represents an increase of 45.1%. The per capita income in 2022 was $28,182, which means an increase of 50.9% compared to 2000 when it was $13,830.
Income statistics for all residents
Median household income in Allen, NY in 2022:| Allen: | $49,856 |
| State: | $79,557 |
Change in median household income between 2000 and 2022:| Allen, New York: | +82.0% |
| State: | +83.3% |
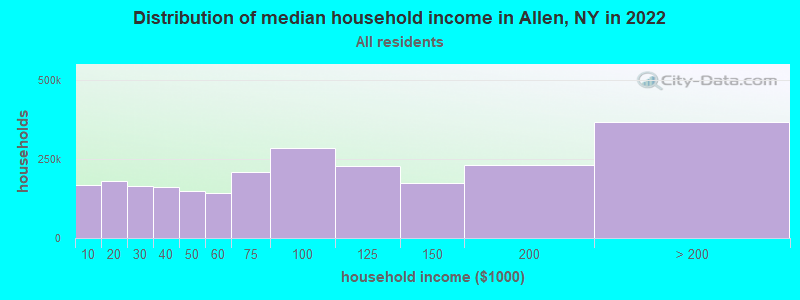
Number of households with income < $10k:| Allen: | 6.8% (166,572) |
| State: | 6.8% (527,598) |
Number of households with income $10k - 20k:| Allen: | 7.4% (181,487) |
| State: | 7.4% (574,940) |
Number of households with income $20k - 30k:| Allen: | 6.7% (163,411) |
| State: | 6.7% (517,718) |
Number of households with income $30k - 40k:| Allen: | 6.5% (159,913) |
| State: | 6.5% (506,674) |
Number of households with income $40k - 50k:| Allen: | 6.1% (148,466) |
| New York: | 6.1% (470,439) |
Number of households with income $50k - 60k:| Allen: | 5.8% (143,290) |
| New York: | 5.8% (454,042) |
Number of households with income $60k - 75k:| Allen: | 8.5% (207,497) |
| State: | 8.5% (657,508) |
Number of households with income $75k - 100k:| Allen: | 11.6% (283,965) |
| State: | 11.6% (899,824) |
Number of households with income $100k - 125k:| Allen: | 9.3% (228,428) |
| State: | 9.3% (723,825) |
Number of households with income $125k - 150k:| Allen: | 7.1% (174,343) |
| State: | 7.1% (552,420) |
Number of households with income $150k - 200k:| Allen: | 9.4% (229,483) |
| State: | 9.4% (727,051) |
Number of households with income > $200k:| Allen: | 15.0% (366,928) |
| New York: | 15.0% (1,162,269) |
Aggregate household income in Allen in 2022: $1,423,140,982
Median family income in Allen in 2022:| Allen: | $56,675 |
| State: | $99,066 |
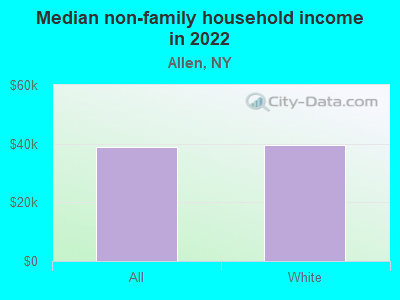
Median non-family income in Allen in 2022:| Allen: | $38,905 |
| State: | $50,181 |
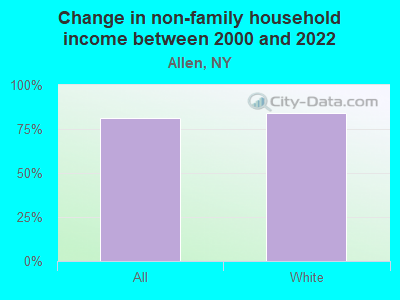
Change in median non-family income between 2000 and 2022:| Allen, New York: | +81.3% |
| State: | +85.4% |
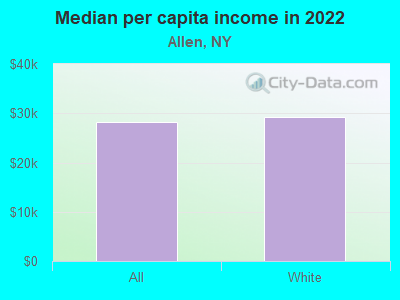
Median per capita income in Allen in 2022:| Allen: | $28,182 |
| State: | $47,421 |
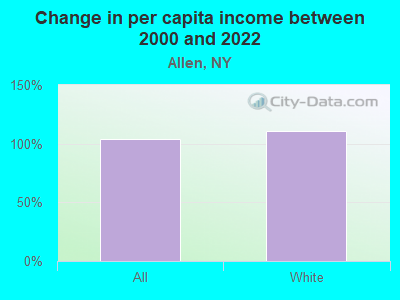
Change in median per capita income between 2000 and 2022:| Allen, New York: | +103.8% |
| New York: | +102.7% |
Income statistics for White residents
Median household income in Allen, NY in 2022:| Allen: | $50,206 |
| New York: | $89,408 |
Change in median household income between 2000 and 2022:| Allen, New York: | +83.3% |
| New York: | +85.5% |
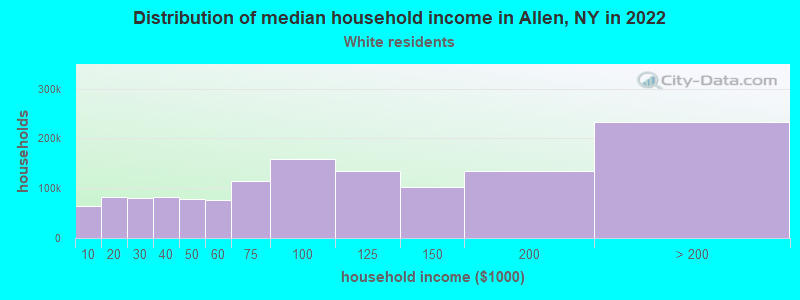
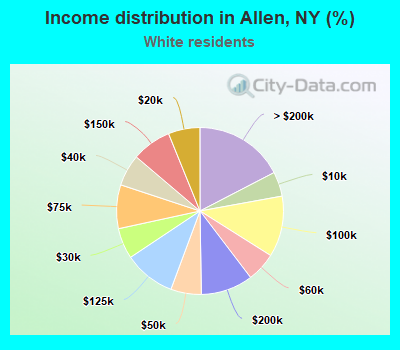
Number of households with income < $10k:| Allen: | 4.8% (63,799) |
| New York: | 4.8% (225,550) |
Number of households with income $10k - 20k:| Allen: | 6.1% (82,200) |
| State: | 6.1% (289,425) |
Number of households with income $20k - 30k:| Allen: | 6.0% (79,732) |
| New York: | 5.9% (280,254) |
Number of households with income $30k - 40k:| Allen: | 6.1% (82,101) |
| State: | 6.1% (288,263) |
Number of households with income $40k - 50k:| Allen: | 5.9% (79,281) |
| State: | 5.9% (278,079) |
Number of households with income $50k - 60k:| Allen: | 5.7% (76,324) |
| New York: | 5.7% (267,554) |
Number of households with income $60k - 75k:| Allen: | 8.5% (113,662) |
| State: | 8.4% (398,344) |
Number of households with income $75k - 100k:| Allen: | 11.8% (158,285) |
| State: | 11.8% (554,841) |
Number of households with income $100k - 125k:| Allen: | 10.0% (133,642) |
| State: | 10.0% (469,794) |
Number of households with income $125k - 150k:| Allen: | 7.7% (102,487) |
| State: | 7.6% (360,467) |
Number of households with income $150k - 200k:| Allen: | 10.1% (135,000) |
| New York: | 10.1% (477,078) |
Number of households with income > $200k:| Allen: | 17.4% (232,866) |
| State: | 17.6% (829,233) |
Aggregate household income in Allen in 2022: $963,142,677
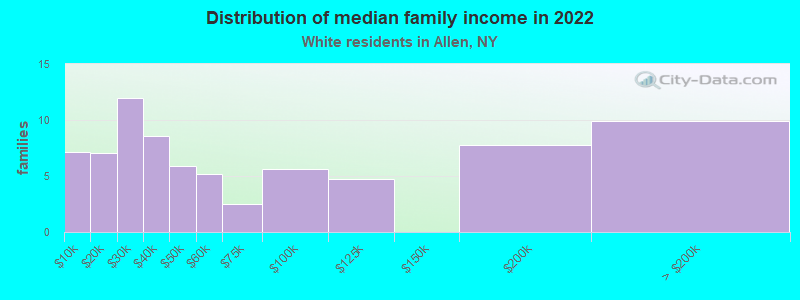
Median family income in Allen in 2022:| Allen: | $57,920 |
| New York: | $115,170 |
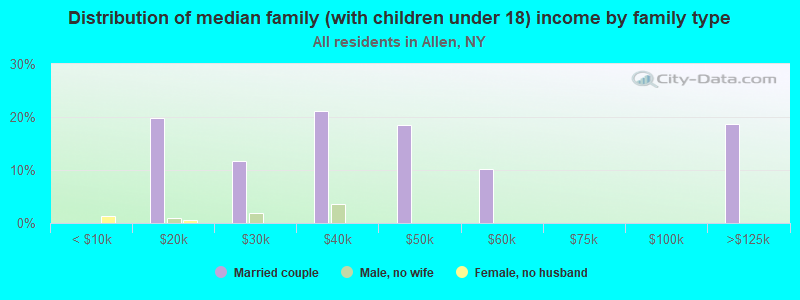
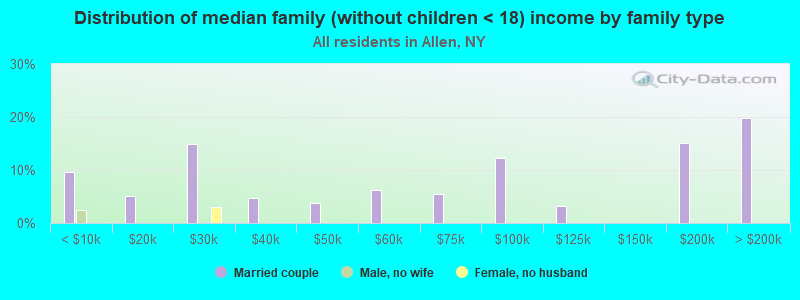
Number of families with income < $10k:| Allen: | 9.3% (7) |
| New York: | 2.5% (68,851) |
Number of families with income $10k - 20k:| Allen: | 9.2% (7) |
| State: | 3.0% (83,127) |
Number of families with income $20k - 30k:| Allen: | 15.7% (12) |
| State: | 3.5% (97,578) |
Number of families with income $30k - 40k:| Allen: | 11.2% (9) |
| State: | 4.1% (114,108) |
Number of families with income $40k - 50k:| Allen: | 7.8% (6) |
| State: | 4.7% (130,902) |
Number of families with income $50k - 60k:| Allen: | 6.8% (5) |
| New York: | 4.9% (135,118) |
Number of families with income $60k - 75k:| Allen: | 3.2% (2) |
| State: | 7.8% (216,254) |
Number of families with income $75k - 100k:| Allen: | 7.4% (6) |
| New York: | 12.4% (342,382) |
Number of families with income $100k - 125k:| Allen: | 6.2% (5) |
| State: | 11.4% (314,917) |
Number of families with income $150k - 200k:| Allen: | 10.2% (8) |
| New York: | 13.2% (365,586) |
Number of families with income > $200k:| Allen: | 13.0% (10) |
| New York: | 23.2% (642,319) |
Median non-family income in Allen in 2022:| Allen: | $39,464 |
| State: | $54,783 |
Change in median non-family income between 2000 and 2022:| Allen, New York: | +83.9% |
| New York: | +87.9% |
Median per capita income in Allen in 2022:| Allen: | $29,182 |
| State: | $57,640 |
Change in median per capita income between 2000 and 2022:| Allen, New York: | +111.0% |
| State: | +111.6% |