Bridge Statistics for Eugene, Oregon (OR)
Condition, Traffic, Stress, Structural Evaluation, Project Costs
- National Bridge Inventory (NBI) Statistics
- 226Number of bridges
- 3,402ft / 1,037mTotal length
- $104,434,000Total costs
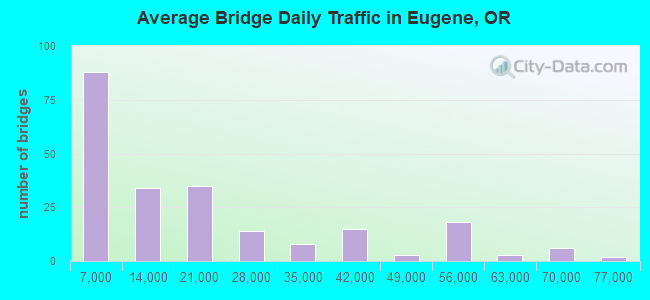
- 4,116,230Total average daily traffic
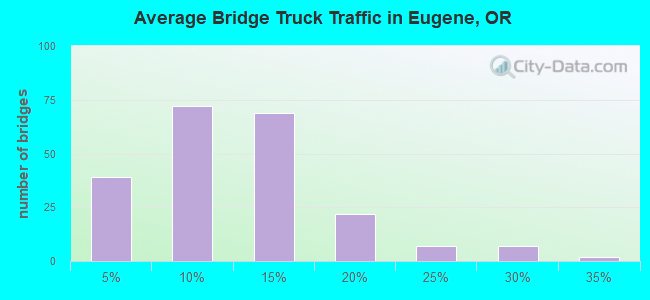
- 437,320Total average daily truck traffic
- National Bridge Inventory (NBI) Registered Bridges for Eugene
- No street view available for this location
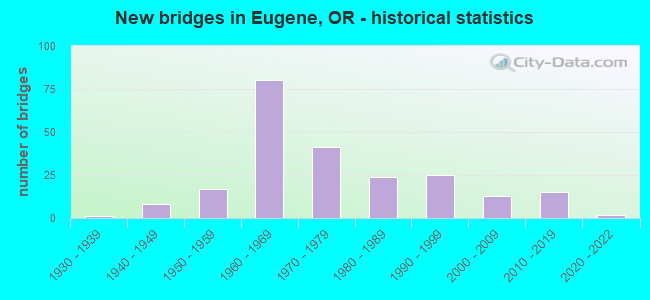
- New bridges - historical statistics
- 11930-1939
- 81940-1949
- 171950-1959
- 801960-1969
- 411970-1979
- 241980-1989
- 251990-1999
- 132000-2009
- 152010-2019
- 22020-2022
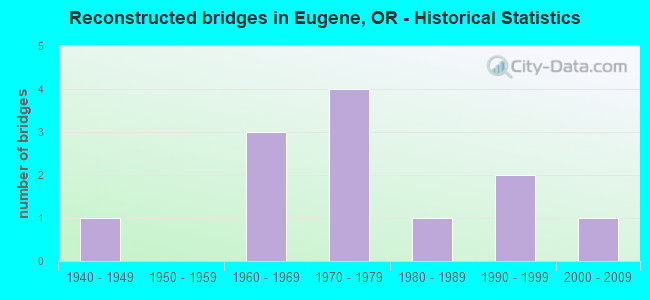
- Reconstructed bridges - Historical Statistics
- 11940-1949
- 01950-1959
- 31960-1969
- 41970-1979
- 11980-1989
- 21990-1999
- 12000-2009
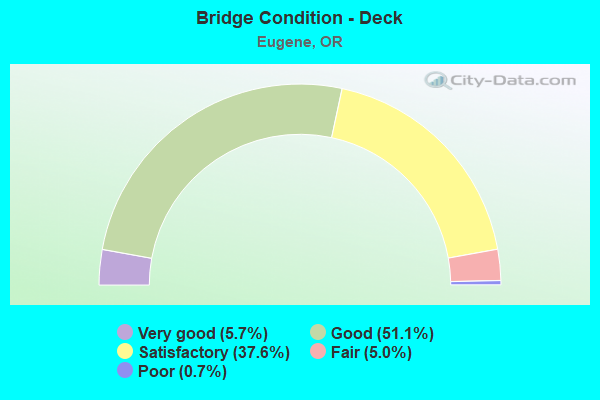
- Bridge Condition - Deck
- 5.7%Very good
- 51.1%Good
- 37.6%Satisfactory
- 5.0%Fair
- 0.7%Poor
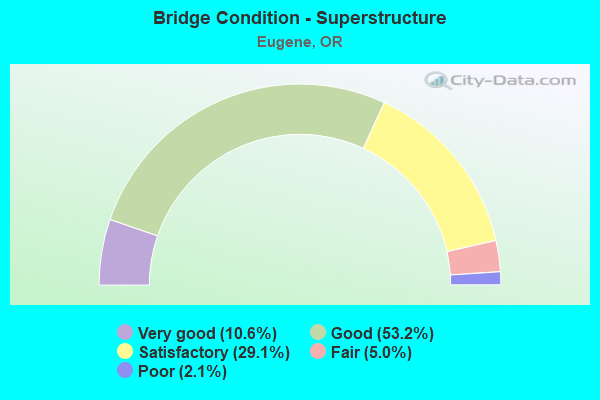
- Bridge Condition - Superstructure
- 10.6%Very good
- 53.2%Good
- 29.1%Satisfactory
- 5.0%Fair
- 2.1%Poor
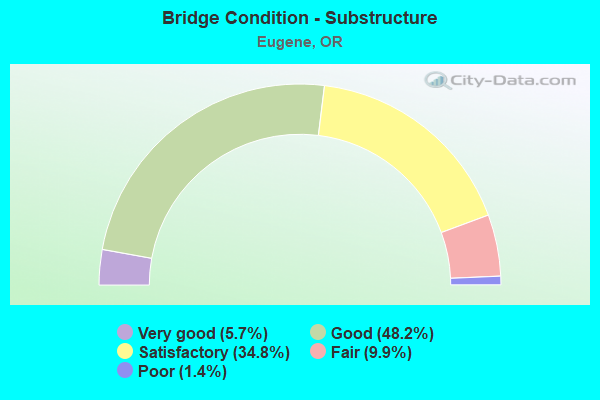
- Bridge Condition - Substructure
- 5.7%Very good
- 48.2%Good
- 34.8%Satisfactory
- 9.9%Fair
- 1.4%Poor
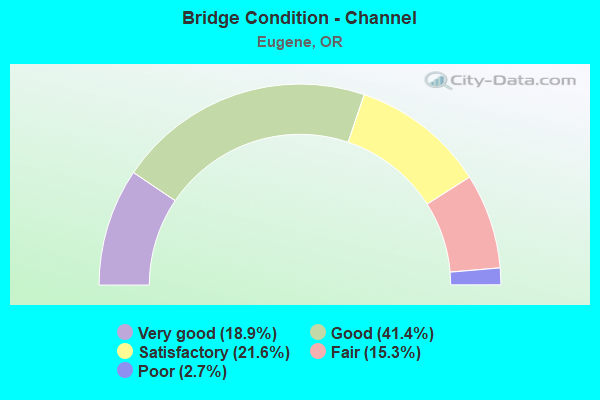
- Bridge Condition - Channel
- 18.9%Very good
- 41.4%Good
- 21.6%Satisfactory
- 15.3%Fair
- 2.7%Poor
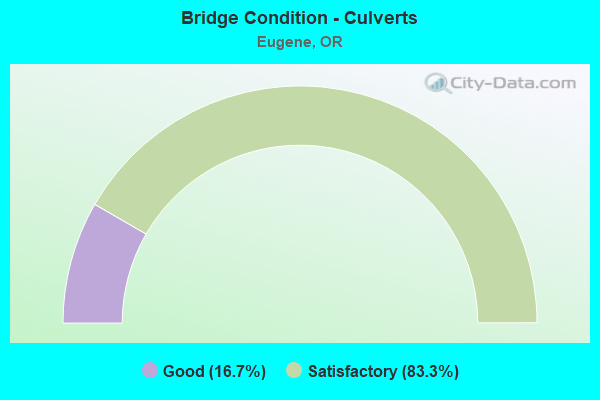
- Bridge Condition - Culverts
- 16.7%Good
- 83.3%Satisfactory