Bridge Statistics for Burnsville, West Virginia (WV)
Condition, Traffic, Stress, Structural Evaluation, Project Costs
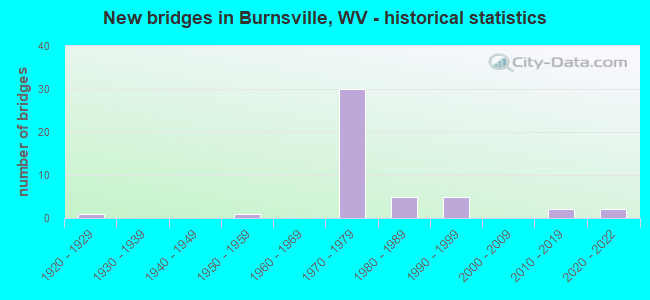
- New bridges - historical statistics
- 11920-1929
- 11950-1959
- 301970-1979
- 51980-1989
- 51990-1999
- 22010-2019
- 22020-2022
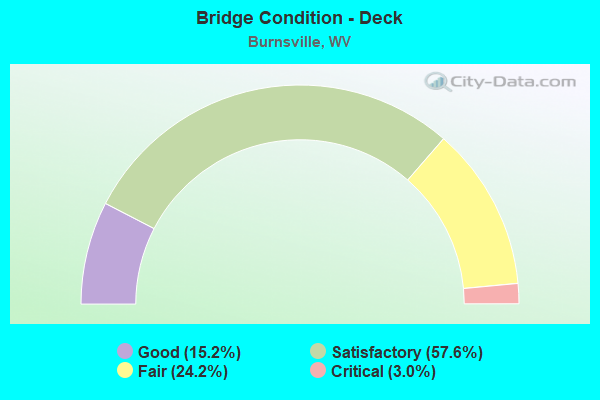
- Bridge Condition - Deck
- 15.2%Good
- 57.6%Satisfactory
- 24.2%Fair
- 3.0%Critical
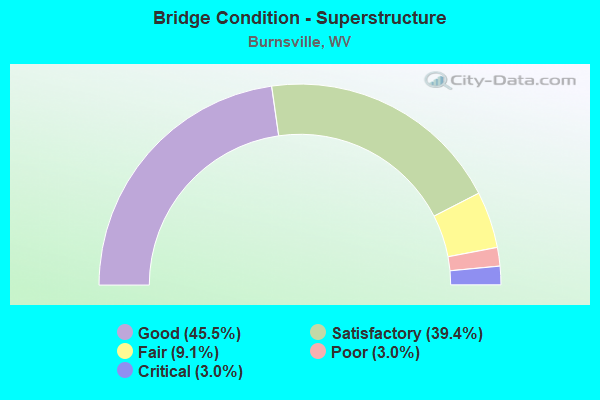
- Bridge Condition - Superstructure
- 45.5%Good
- 39.4%Satisfactory
- 9.1%Fair
- 3.0%Poor
- 3.0%Critical
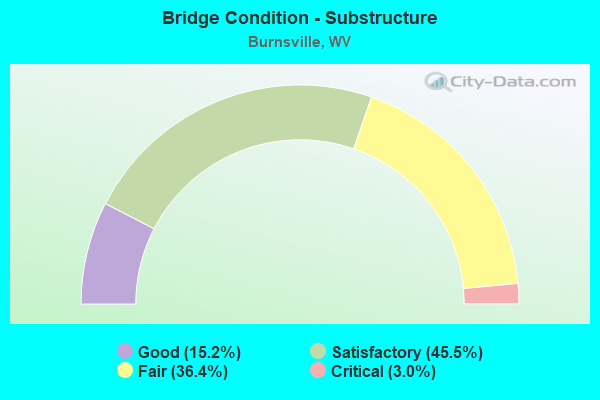
- Bridge Condition - Substructure
- 15.2%Good
- 45.5%Satisfactory
- 36.4%Fair
- 3.0%Critical
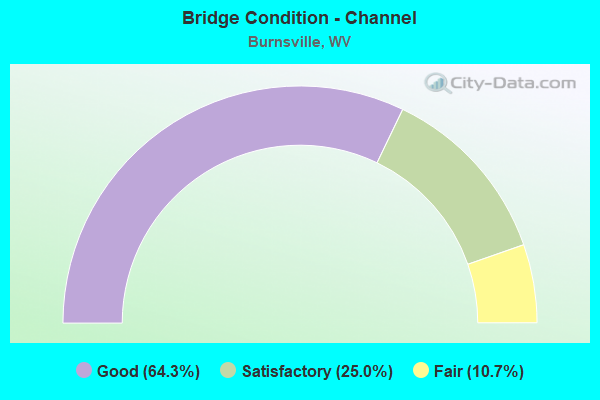
- Bridge Condition - Channel
- 64.3%Good
- 25.0%Satisfactory
- 10.7%Fair