Estimated zip code population in 2022: 27,868 Zip code population in 2010: 24,386 Zip code population in 2000: 25,001
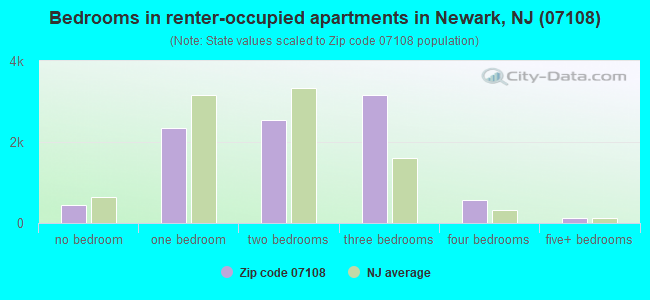
Houses and condos: 12,753 Renter-occupied apartments: 9,292
% of renters here:
83%
State:
35%
March 2022 cost of living index in zip code 07108: 118.8 (more than average, U.S. average is 100)
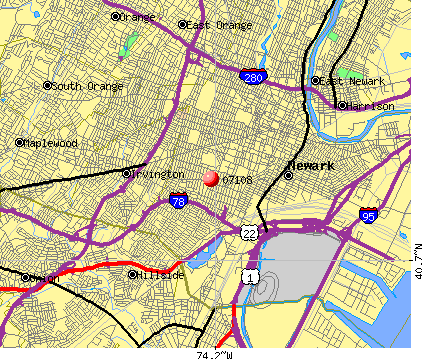
Land area: 1.4 sq. mi. Water area: 0.0 sq. mi.
Population density: 20,298 people per square mile
(very high).
OSM Map
Google Map
MSN Map
OSM Map
General Map
Google Map
MSN Map
OSM Map
Google Map
MSN Map
OSM Map
Google Map
MSN Map
Please wait while loading the map...
Real estate property taxes paid for housing units in 2022:
This zip code:
1.9% ($6,153)
New Jersey:
2.1% ($8,897)
Median real estate property taxes paid for housing units with mortgages in 2022: $6,381 (1.8%) Median real estate property taxes paid for housing units with no mortgage in 2022: $5,776 (2.3%)
Business Search- 14 Million verified businesses
Males: 12,467
(44.7%)
Females: 15,398
(55.3%)
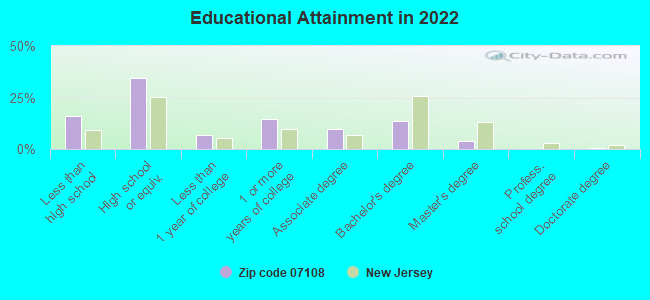
For population 25 years and over in 07108:
High school or higher: 82.4%
Bachelor's degree or higher: 17.9%
Graduate or professional degree: 4.5%
Unemployed: 10.3%
Mean travel time to work (commute): 33.9 minutes
For population 15 years and over in 07108:
Never married: 55.9%
Now married: 25.3%
Separated: 5.2%
Widowed: 5.7%
Divorced: 7.8%
Zip code 07108 compared to state average:
Median household income significantly below state average.
Unemployed percentage above state average.
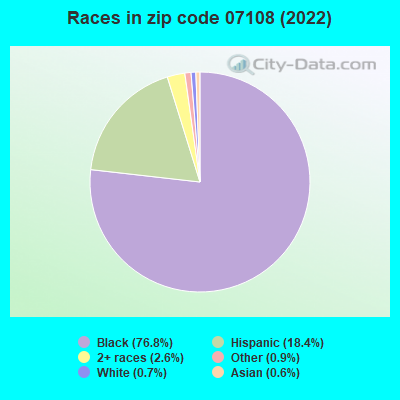
Black race population percentage significantly above state average.
Median age significantly below state average.
Renting percentage significantly above state average.
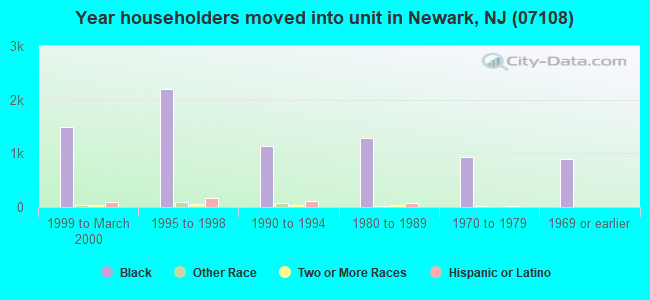
Length of stay since moving in significantly above state average.
Number of rooms per house below state average.
Percentage of population with a bachelor's degree or higher significantly below state average.
Averages for the 2020 tax year for zip code 07108, filed in 2021:
Average Adjusted Gross Income (AGI) in 2020: $31,958 (Individual Income Tax Returns)
Here:
$31,958
State:
$95,247
Salary/wage: $30,767 (reported on 86.4% of returns)
Here:
$30,767
State:
$80,635
(% of AGI for various income ranges: 1027.6% for AGIs below $25k, 3500.9% for AGIs $25k-50k, 7165.5% for AGIs $50k-75k, 11140.6% for AGIs $75k-100k, 14967.3% for AGIs $100k-200k)
Taxable interest for individuals: $235 (reported on 5.2% of returns)
This zip code:
$235
New Jersey:
$2,414
(% of AGI for various income ranges: 0.6% for AGIs below $25k, 0.6% for AGIs $25k-50k, 3.8% for AGIs $50k-75k, 7.4% for AGIs $75k-100k, 14.5% for AGIs $100k-200k)
Ordinary dividends: $455 (reported on 1.8% of returns)
Here:
$455
State:
$8,057
(% of AGI for various income ranges: 0.6% for AGIs below $25k, 0.5% for AGIs $25k-50k, 0.9% for AGIs $50k-75k, 3.2% for AGIs $75k-100k, 14.5% for AGIs $100k-200k)
Net capital gain/loss in AGI: +$1,091 (reported on 1.9% of returns)
Here:
+$1,091
State:
+$25,022
(% of AGI for various income ranges: 1.5% for AGIs $25k-50k, 7.4% for AGIs $50k-75k, 1.8% for AGIs $75k-100k, 55.5% for AGIs $100k-200k)
Profit/loss from business: +$3,063 (reported on 18.8% of returns)
Here:
+$3,063
State:
+$18,035
(% of AGI for various income ranges: 141.4% for AGIs below $25k, 38.2% for AGIs $75k-100k, 86.4% for AGIs $100k-200k)
Taxable individual retirement arrangement distribution: $8,064 (reported on 0.9% of returns)
07108:
$8,064
New Jersey:
$21,558
(% of AGI for various income ranges: 2.4% for AGIs below $25k, 6.8% for AGIs $25k-50k, 20.8% for AGIs $50k-75k, 96.8% for AGIs $75k-100k)
Total itemized deductions: $27,336 (reported on 4.7% of returns)
Here:
$27,336
State:
$32,863
(% of AGI for various income ranges: 22.2% for AGIs below $25k, 113.3% for AGIs $25k-50k, 446.7% for AGIs $50k-75k, 797.4% for AGIs $75k-100k, 1449.1% for AGIs $100k-200k)
Charity contributions: $7,064 (reported on 3.8% of returns)
Here:
$7,064
State:
$7,880
(% of AGI for various income ranges: 2.8% for AGIs below $25k, 17.1% for AGIs $25k-50k, 90.5% for AGIs $50k-75k, 176.2% for AGIs $75k-100k, 436.8% for AGIs $100k-200k)
Taxes paid: $9,732 (reported on 4.7% of returns)
07108:
$9,732
State:
$9,183
(% of AGI for various income ranges: 7.1% for AGIs below $25k, 38.7% for AGIs $25k-50k, 168.5% for AGIs $50k-75k, 266.2% for AGIs $75k-100k, 543.2% for AGIs $100k-200k)
Earned income credit: $2,691 (reported on 40.7% of returns)
Here:
$2,691
State:
$2,148
(% of AGI for various income ranges: 185.2% for AGIs below $25k, 114.5% for AGIs $25k-50k)
Percentage of individuals using paid preparers for their 2020 taxes: 93.8%
Here:
94%
State:
92%
(% for various income ranges: 93.2% for AGIs below $25k, 95.0% for AGIs $25k-50k, 93.8% for AGIs $50k-75k, 91.7% for AGIs $75k-100k, 96.7% for AGIs $100k-200k, 66.7% for AGIs over 200k)
Averages for the 2012 tax year for zip code 07108, filed in 2013:
Average Adjusted Gross Income (AGI) in 2012: $26,357 (Individual Income Tax Returns)
Here:
$26,357
State:
$79,688
Salary/wage: $26,414 (reported on 83.6% of returns)
Here:
$26,414
State:
$68,122
(% of AGI for various income ranges: 69.3% for AGIs below $25k, 90.7% for AGIs $25k-50k, 91.9% for AGIs $50k-75k, 88.8% for AGIs $75k-100k, 83.4% for AGIs $100k-200k)
Taxable interest for individuals: $387 (reported on 7.0% of returns)
This zip code:
$387
New Jersey:
$2,193
(% of AGI for various income ranges: 0.1% for AGIs $25k-50k, 0.1% for AGIs $50k-75k, 0.1% for AGIs $100k-200k)
Ordinary dividends: $796 (reported on 2.4% of returns)
Here:
$796
State:
$6,828
(% of AGI for various income ranges: 0.2% for AGIs below $25k)
Profit/loss from business: +$7,937 (reported on 18.7% of returns)
Here:
+$7,937
State:
+$19,577
(% of AGI for various income ranges: 17.6% for AGIs below $25k, 0.5% for AGIs $25k-50k, 0.8% for AGIs $50k-75k)
Taxable individual retirement arrangement distribution: $5,558 (reported on 1.2% of returns)
07108:
$5,558
New Jersey:
$18,214
(% of AGI for various income ranges: 0.2% for AGIs below $25k, 0.3% for AGIs $25k-50k, 1.2% for AGIs $75k-100k)
Total itemized deductions: $17,686 (32% of AGI, reported on 14.8% of returns)
Here:
$17,686
State:
$30,827
Here:
32.0% of AGI
State:
21.2% of AGI
(% of AGI for various income ranges: 3.6% for AGIs below $25k, 9.5% for AGIs $25k-50k, 14.3% for AGIs $50k-75k, 17.0% for AGIs $75k-100k, 17.5% for AGIs $100k-200k)
Charity contributions: $4,061 (reported on 11.9% of returns)
Here:
$4,061
State:
$3,451
(% of AGI for various income ranges: 0.5% for AGIs below $25k, 1.7% for AGIs $25k-50k, 2.6% for AGIs $50k-75k, 3.7% for AGIs $75k-100k, 3.9% for AGIs $100k-200k)
Taxes paid: $5,057 (reported on 14.8% of returns)
07108:
$5,057
State:
$15,801
(% of AGI for various income ranges: 1.0% for AGIs below $25k, 2.3% for AGIs $25k-50k, 4.2% for AGIs $50k-75k, 5.6% for AGIs $75k-100k, 6.3% for AGIs $100k-200k)
Earned income credit: $2,814 (reported on 49.4% of returns)
Here:
$2,814
State:
$2,182
(% of AGI for various income ranges: 15.3% for AGIs below $25k, 1.9% for AGIs $25k-50k)
Percentage of individuals using paid preparers for their 2012 taxes: 66.6%
Here:
67%
State:
65%
(% for various income ranges: 65.9% for AGIs below $25k, 66.0% for AGIs $25k-50k, 69.9% for AGIs $50k-75k, 73.1% for AGIs $75k-100k, 78.6% for AGIs $100k-200k)
Averages for the 2004 tax year for zip code 07108, filed in 2005:
Average Adjusted Gross Income (AGI) in 2004: $24,588 (Individual Income Tax Returns)
Here:
$24,588
State:
$64,921
Salary/wage: $24,940 (reported on 90.2% of returns)
Here:
$24,940
State:
$57,755
(% of AGI for various income ranges: 81.0% for AGIs below $10k, 86.6% for AGIs $10k-25k, 96.5% for AGIs $25k-50k, 93.2% for AGIs $50k-75k, 90.2% for AGIs $75k-100k, 77.2% for AGIs over 100k)
Taxable interest for individuals: $374 (reported on 13.0% of returns)
This zip code:
$374
New Jersey:
$2,068
(% of AGI for various income ranges: 0.5% for AGIs below $10k, 0.3% for AGIs $10k-25k, 0.2% for AGIs $25k-50k, 0.1% for AGIs $50k-75k, 0.1% for AGIs $75k-100k, 0.2% for AGIs over 100k)
Taxable dividends: $455 (reported on 3.7% of returns)
Here:
$455
State:
$3,959
(% of AGI for various income ranges: 0.2% for AGIs below $10k, 0.1% for AGIs $10k-25k, 0.1% for AGIs $25k-50k, 0.1% for AGIs $50k-75k, 0.1% for AGIs $75k-100k, 0.0% for AGIs over 100k)
Net capital gain/loss: +$3,441 (reported on 1.7% of returns)
Here:
+$3,441
State:
+$13,591
(% of AGI for various income ranges: -0.0% for AGIs $10k-25k, 0.1% for AGIs $25k-50k, 0.6% for AGIs $50k-75k, 1.4% for AGIs $75k-100k)
Profit/loss from business: +$4,676 (reported on 9.1% of returns)
Here:
+$4,676
State:
+$17,520
(% of AGI for various income ranges: 13.6% for AGIs below $10k, 4.2% for AGIs $10k-25k, -0.1% for AGIs $25k-50k, -0.1% for AGIs $50k-75k, 0.7% for AGIs $75k-100k)
IRA payment deduction: $1,595 (reported on 0.4% of returns)
07108:
$1,595
New Jersey:
$3,270
Total itemized deductions: $15,618 (34% of AGI, reported on 17.2% of returns)
Here:
$15,618
State:
$23,924
Here:
33.9% of AGI
State:
21.1% of AGI
(% of AGI for various income ranges: 4.8% for AGIs below $10k, 5.1% for AGIs $10k-25k, 10.8% for AGIs $25k-50k, 16.4% for AGIs $50k-75k, 19.3% for AGIs $75k-100k, 18.7% for AGIs over 100k)
Charity contributions deductions: $3,875 (8% of AGI, reported on 15.4% of returns)
Here:
$3,875
State:
$3,242
Here:
8.2% of AGI
State:
2.7% of AGI
(% of AGI for various income ranges: 0.6% for AGIs below $10k, 1.0% for AGIs $10k-25k, 2.3% for AGIs $25k-50k, 3.9% for AGIs $50k-75k, 5.0% for AGIs $75k-100k, 4.0% for AGIs over 100k)
Total tax: $2,616 (reported on 51.1% of returns)
07108:
$2,616
State:
$12,321
(% of AGI for various income ranges: 2.5% for AGIs below $10k, 2.4% for AGIs $10k-25k, 4.5% for AGIs $25k-50k, 8.7% for AGIs $50k-75k, 10.5% for AGIs $75k-100k, 14.4% for AGIs over 100k)
Earned income credit: $2,080 (reported on 46.8% of returns)
Here:
$2,080
State:
$1,711
Percentage of individuals using paid preparers for their 2004 taxes: 72.5%
Here:
72%
State:
65%
(% for various income ranges: 69.1% for AGIs below $10k, 75.5% for AGIs $10k-25k, 71.4% for AGIs $25k-50k, 71.8% for AGIs $50k-75k, 73.8% for AGIs $75k-100k, 76.8% for AGIs over 100k)
Likely homosexual households (counted as self-reported same-sex unmarried-partner households)
Lesbian couples: 0.0% of all households
Gay men: 0.0% of all households
Household received Food Stamps/SNAP in the past 12 months: 4,184 Household did not receive Food Stamps/SNAP in the past 12 months: 7,588
Women who had a birth in the past 12 months: 307 (115 now married, 185 unmarried) Women who did not have a birth in the past 12 months: 7,716 (1,730 now married, 6,017 unmarried)
Housing units in zip code 07108 with a mortgage: 1,246 (87 second mortgage, 82 both second mortgage and home equity loan) Houses without a mortgage: 9
Median monthly owner costs for units with a mortgage: $2,499 Median monthly owner costs for units without a mortgage: $939
Residents with income below the poverty level in 2022:
This zip code:
34.5%
Whole state:
9.7%
Residents with income below 50% of the poverty level in 2022:
This zip code:
16.4%
Whole state:
5.2%
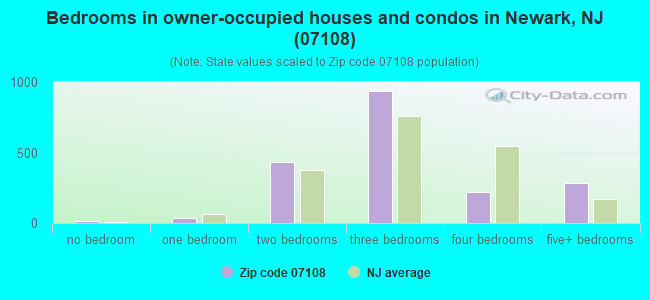
Median number of rooms in houses and condos:
Here:
5.9
State:
6.8
Median number of rooms in apartments:
Here:
4.3
State:
3.9
Notable locations in this zip code not listed on our city pages
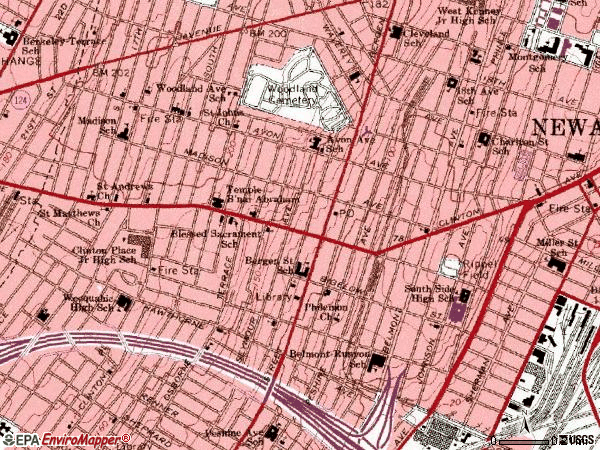
Notable locations in zip code 07108: Madison Area Branch Newark Public Library (A), Clinton Branch Newark Public Library (B), Newark Fire Department Engine 17 (C), Newark Fire Department Engine 12 (D). Display/hide their locations on the map
Churches in zip code 07108 include: Blessed Sacrament Church (A), New Dawn Baptist Church (B), Pleasant Grove Baptist Church (C), Trinity United Methodist Church (D), Saint Andrews Church (E), Saint John's Lutheran Church (F), Saint Mathews Church (G), Temple B'nai Abraham (H). Display/hide their locations on the map
In group quarters: 78 (-1 institutionalized population)
Size of family households: 2,333 2-persons, 1,636 3-persons, 1,101 4-persons, 681 5-persons, 420 6-persons, 152 7-or-more-persons
Size of nonfamily households: 4,571 1-person, 454 2-persons, 44 3-persons
1,976 married couples with children.
5,370 single-parent households (944 men, 4,426 women).
71.7% of residents of 07108 zip code speak English at home.
15.4% of residents speak Spanish at home (60% very well, 15% well, 20% not well, 4% not at all).
3.7% of residents speak other Indo-European language at home (59% very well, 11% well, 30% not well).
0.2% of residents speak Asian or Pacific Island language at home (21% very well, 60% well, 19% not well).
8.6% of residents speak other language at home (85% very well, 7% well, 7% not well, 1% not at all).
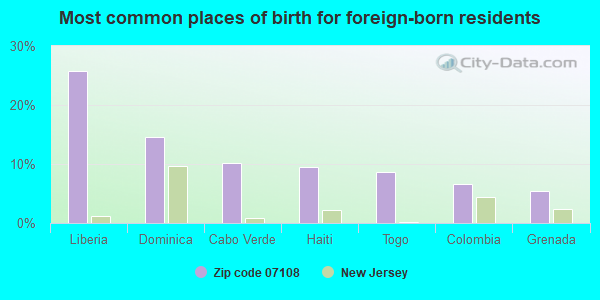
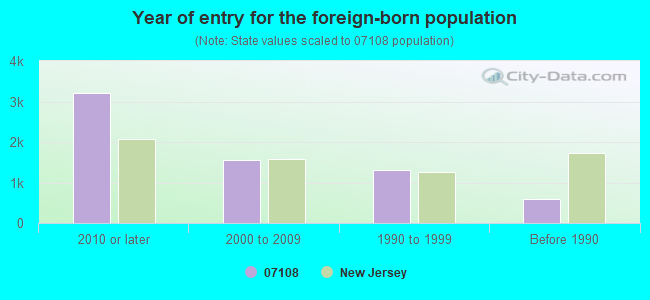
Foreign born population: 5,397 (19.4%) (42.8% of them are naturalized citizens)
Major facilities with environmental interests located in this zip code:
NEWARK CITY BD OF ED MALCOLM X SHABAZZ HIGH SCHOOL (80 JOHNSON AVE in NEWARK, NJ)
AIR SYNTHETIC MINOR (AIRS/AFS) (National Center for Education Statistics) - STATE ID-050 CRITERIA AND HAZARDOUS AIR POLLUTANT INVENTORY (Inventory of air pollution sources) STATE MASTER (New Jersey environmental info) - NJEMS-014250, STATE CLEANUP SITE, NJEMS-05584, AIR PROGRAM (Resource Conservation and Recovery Act (tracking hazardous waste)) Business SIC classification: ELEMENTARY AND SECONDARY SCHOOLS Alternative names: NEWARK BD. ED./MALCOM X SCHOOL, NEWARK BOARD OF ED MALCOLM X SHABAZZ HIGH S
NEWARK CITY BD OF ED UNIV HIGH SCHOOL (55 CLINTON PL in NEWARK, NJ)
(National Center for Education Statistics) - STATE ID-057 STATE MASTER (New Jersey environmental info) - NJEMS-014256, STATE CLEANUP SITE (Resource Conservation and Recovery Act (tracking hazardous waste)) Alternative names: UNIVERSITY HIGH SCHOOL
NEWARK CITY BD OF ED 18TH AVENUE SCHOOL (229 18TH AVE in NEWARK, NJ)
(National Center for Education Statistics) - STATE ID-380 STATE MASTER (New Jersey environmental info) - NJEMS-014219, STATE CLEANUP SITE (Resource Conservation and Recovery Act (tracking hazardous waste)) Alternative names: NEWARK PUBLIC SCHOOLS EIGHTEENTH AVE SCH
NEWARK CITY BD OF ED AVON AVENUE SCHOOL (219 AVON AVE in NEWARK, NJ)
(National Center for Education Statistics) - STATE ID-220 STATE MASTER (New Jersey environmental info) - NJEMS-014197, STATE CLEANUP SITE (Resource Conservation and Recovery Act (tracking hazardous waste)) Alternative names: NEWARK PUBLIC SCHOOLS AVON AVENUE SCHOOL
NEWARK CITY BD OF ED CLINTON AVENUE ELEMENTARY SCHOOL (534 CLINTON AVE in NEWARK, NJ)
(National Center for Education Statistics) - STATE ID-353 STATE MASTER (New Jersey environmental info) - NJEMS-014216, STATE CLEANUP SITE (Resource Conservation and Recovery Act (tracking hazardous waste)) Alternative names: CLINTON AVENUE ELEMENTARY SCHL, NEWARK PUBLIC SCHOOLS CLINTON AVENUE SCH
NEWARK CITY BD OF ED BERGEN STREET SCHOOL (695 BERGEN ST in NEWARK, NJ)
(National Center for Education Statistics) - STATE ID-230 STATE MASTER (New Jersey environmental info) - NJEMS-014201, STATE CLEANUP SITE Small Quantity Generators, between 100 kg and 1000 kg of hazardous waste/month (Resource Conservation and Recovery Act (tracking hazardous waste)) - notification Organizations: NEWARK PUBLIC SCHOOLS (CONTACT/OWNER)
Alternative names: NEWARK PUBLIC SCH WILLIAM BROWN ACADEMY
NEWARK CITY BD OF ED BELMONT RUNYON ARTS HIGH SCHOOL (68 WEST RUNYON STREET in NEWARK, NJ)
STATE MASTER (New Jersey environmental info) - NJEMS-014200, STATE CLEANUP SITE (Resource Conservation and Recovery Act (tracking hazardous waste)) Organizations: NJDOT Alternative names: NEWARK PUBLIC SCHOOLS BELMONT RUNYON SCH
EXXON SERVICE STATION #32561 (1 ELIZABETH AVE in NEWARK, NJ)
STATE MASTER (New Jersey environmental info) - NJEMS-008628, STATE CLEANUP SITE, NJEMS-38472600000, EPCRA, NJEMS-84893500000, NJEMS-B0516, AIR PROGRAM, NJEMS-00000009187, EPCRA (Resource Conservation and Recovery Act (tracking hazardous waste)) Business SIC classification: GASOLINE SERVICE STATIONS Organizations: EXXON MOBIL CORP, EXXON CO USA (CONTACT/OPERATOR)
, EXXON MOBIL CORP USA (CONTACT/OWNER)
Alternative names: EXXON CO USA 32561
AMERICAN FINISHING & SPRAY CO (123-135 NEW JERSEY RAILROAD AVENUE in NEWARK, NJ)
AIR SYNTHETIC MINOR (AIRS/AFS) COMPLIANCE ACTIVITY (Tracking inspections of insecticide, fungicide, and rodenticide, and toxic substances) CRITERIA AND HAZARDOUS AIR POLLUTANT INVENTORY (Inventory of air pollution sources) STATE MASTER (New Jersey environmental info) - NJEMS-06208, AIR PROGRAM (Resource Conservation and Recovery Act (tracking hazardous waste)) Business SIC classification: ELECTROPLATING, PLATING, POLISHING, ANODIZING, AND COLORING; AIR AND GAS COMPRESSORS Organizations: AMERICAN FINISHING & SPRAY CO INC Alternative names: AMERICAN FINISHING SPRAY CO
FEDERAL BUSINESS CENTERS (231 JOHNSON AVE SUITE 312 in NEWARK, NJ)
STATE MASTER (New Jersey environmental info) - NJEMS-0789, MINERAL EXPLORATION, NJEMS-10126W, DRINKING WATER PROGRAM (Resource Conservation and Recovery Act (tracking hazardous waste)) Organizations: CENTER REALTY, SOS FLEXIBLE WAREHOUSING INC, EWR LLC CROZIER FINE ARTS Alternative names: FEDERAL BUSINESS CTRS
ANTI HYDRO INTERNATIONAL INC BADGER TECHNOLOGY DIV (265-77 BADGER AVE. in NEWARK, NJ)
STATE MASTER (New Jersey environmental info) - NJEMS-06204, AIR PROGRAM (Resource Conservation and Recovery Act (tracking hazardous waste)) TRI REPORTER (Tracking of toxic chemicals releasing facilities) Business SIC classification: PREFABRICATED WOOD BUILDINGS AND COMPONENTS; PAINTS, VARNISHES, LACQUERS, ENAMELS, AND ALLIED PRODUCTS Organizations: ANTI HYDRO CO INC Alternative names: ANTI HYDRO CO INCORPORATED
AVON SHEET METAL & ROOFING CO (210 BADGER AVENUE #224 in NEWARK, NJ)
STATE MASTER (New Jersey environmental info) - NJEMS-024659, STATE CLEANUP SITE (Resource Conservation and Recovery Act (tracking hazardous waste))
BIGELOW AUTO BODY ZEKE INC (798 BERGEN STREET #800 in NEWARK, NJ)
STATE MASTER (New Jersey environmental info) - NJEMS-52923700000, EPCRA, NJEMS-G0587, AIR PROGRAM (Resource Conservation and Recovery Act (tracking hazardous waste)) Business SIC classification: MOTOR VEHICLES AND PASSENGER CAR BODIES; TOP, BODY, AND UPHOLSTERY REPAIR SHOPS AND PAINT SHOPS Alternative names: BIGELOW AUTO ZEKE INC
Housing units lacking complete plumbing facilities: 3.0% Housing units lacking complete kitchen facilities: 4.8%
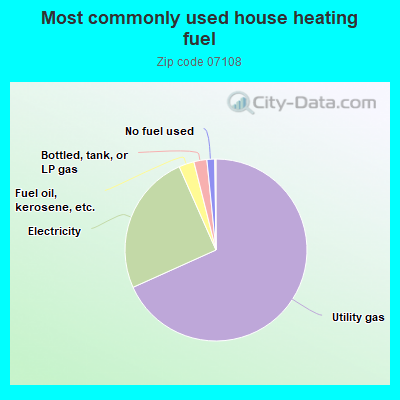
68.2%Utility gas
25.1%Electricity
2.7%Fuel oil, kerosene, etc.
2.3%Bottled, tank, or LP gas
1.4%No fuel used
Population in 1990: 29,730.
Place of birth for U.S.-born residents:
This state: 16,006
Northeast: 3,223
Midwest: 164
South: 1,854
West: 137
59% of the 07108 zip code residents lived in the same house 5 years ago. Out of people who lived in different houses, 85% lived in this county. Out of people who lived in different counties, 50% lived in New Jersey.
89% of the 07108 zip code residents lived in the same house 1 year ago. Out of people who lived in different houses, 54% moved from this county. Out of people who lived in different houses, 6% moved from different county within same state. Out of people who lived in different houses, 31% moved from different state. Out of people who lived in different houses, 11% moved from abroad.
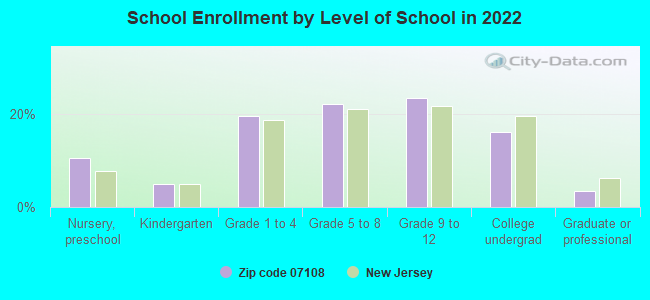
Private vs. public school enrollment:
Students in private schools in grades 1 to 8 (elementary and middle school): 289
Here:
8.2%
New Jersey:
12.3%
Students in private schools in grades 9 to 12 (high school): 94
Here:
4.8%
New Jersey:
13.1%
Students in private undergraduate colleges: 296
Here:
22.0%
New Jersey:
33.2%
Occupation by median earnings in the past 12 months ($)
104,757Computer and mathematical occupations
67,472Management occupations
63,523Installation, maintenance, and repair occupations
58,467Arts, design, entertainment, sports, and media occupations
46,488Community and social service occupations
41,725Life, physical, and social science occupations
Top industries in this zip code by the number of employees in 2005:
Health Care and Social Assistance: Child Day Care Services (100-249 employees: 1 establishment, 20-49 employees: 1 establishment, 10-19 employees: 5 establishments, 5-9 employees: 5 establishments)
Other Services (except Public Administration): Religious Organizations (20-49: 1, 10-19: 1, 5-9: 6, 1-4: 9)
Real Estate and Rental and Leasing: Lessors of Residential Buildings and Dwellings (20-49: 1, 10-19: 2, 5-9: 3, 1-4: 10)
Wholesale Trade: Women's, Children's, and Infants' Clothing and Accessories Merchant Wholesalers (50-99: 1)
Health Care and Social Assistance: Other Residential Care Facilities (20-49: 2, 1-4: 1)
Other Services (except Public Administration): Other Similar Organizations (except Business, Professional, Labor, and Political Organizations) (20-49: 1, 5-9: 2, 1-4: 1)
People in group quarters in 2010:
695 people in other noninstitutional facilities
55 people in workers' group living quarters and job corps centers
33 people in emergency and transitional shelters (with sleeping facilities) for people experiencing homelessness
22 people in residential treatment centers for adults
18 people in mental (psychiatric) hospitals and psychiatric units in other hospitals
People in group quarters in 2000:
154 people in other noninstitutional group quarters
27 people in other group homes
23 people in homes or halfway houses for drug/alcohol abuse
18 people in homes for the mentally ill
8 people in other nonhousehold living situations
Fatal accident statistics in 2013:
Fatal accident count: 3
Vehicles involved in fatal accidents: 5
Fatal accidents caused by drunken drivers: 2
Fatalities: 3
Persons involved in fatal accidents: 9
Pedestrians involved in fatal accidents: 1
Fatal accident statistics in 2011:
Fatal accident count: 1
Vehicles involved in fatal accidents: 4
Fatal accidents caused by drunken drivers: 1
Fatalities: 1
Persons involved in fatal accidents: 5
Pedestrians involved in fatal accidents: 1
Home Mortgage Disclosure Act Aggregated Statistics For Year 2009 (Based on 9 full and 16 partial tracts)
A) FHA, FSA/RHS & VA Home Purchase Loans
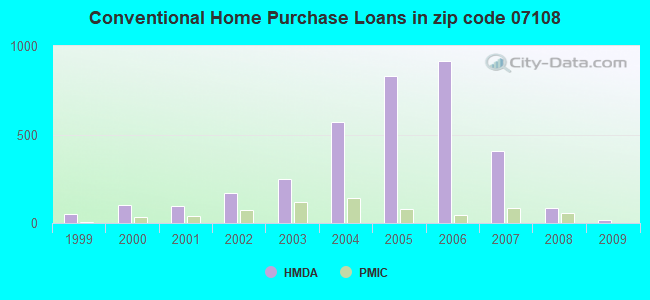
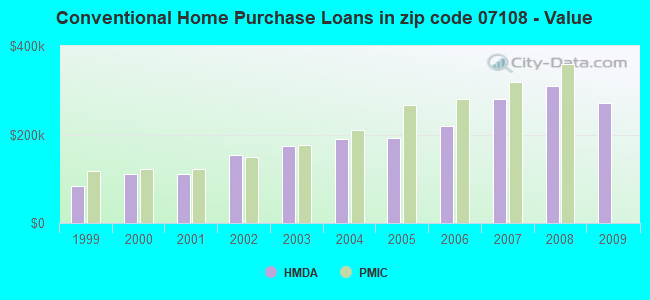
B) Conventional Home Purchase Loans
C) Refinancings
D) Home Improvement Loans
E) Loans on Dwellings For 5+ Families
F) Non-occupant Loans on < 5 Family Dwellings (A B C & D)
G) Loans On Manufactured Home Dwelling (A B C & D)
Number
Average Value
Number
Average Value
Number
Average Value
Number
Average Value
Number
Average Value
Number
Average Value
Number
Average Value
LOANS ORIGINATED
82
$240,956
16
$270,152
139
$264,346
6
$35,275
4
$1,605,360
20
$211,462
2
$173,540
APPLICATIONS APPROVED, NOT ACCEPTED
14
$228,344
6
$214,353
35
$225,569
2
$264,675
3
$453,033
7
$251,291
0
$0
APPLICATIONS DENIED
55
$243,487
26
$266,706
170
$237,440
31
$61,426
3
$252,020
19
$196,833
0
$0
APPLICATIONS WITHDRAWN
35
$252,214
7
$271,037
68
$235,634
1
$26,590
0
$0
5
$233,956
1
$212,680
FILES CLOSED FOR INCOMPLETENESS
22
$263,890
4
$231,240
27
$283,983
0
$0
0
$0
6
$219,437
0
$0
Aggregated Statistics For Year 2008 (Based on 9 full and 16 partial tracts)
A) FHA, FSA/RHS & VA Home Purchase Loans
B) Conventional Home Purchase Loans
C) Refinancings
D) Home Improvement Loans
E) Loans on Dwellings For 5+ Families
F) Non-occupant Loans on < 5 Family Dwellings (A B C & D)
G) Loans On Manufactured Home Dwelling (A B C & D)
Number
Average Value
Number
Average Value
Number
Average Value
Number
Average Value
Number
Average Value
Number
Average Value
Number
Average Value
LOANS ORIGINATED
79
$303,376
85
$308,718
170
$229,501
34
$71,284
30
$1,554,976
32
$238,541
0
$0
APPLICATIONS APPROVED, NOT ACCEPTED
3
$372,237
18
$288,356
57
$222,918
7
$80,650
0
$0
19
$237,398
0
$0
APPLICATIONS DENIED
50
$352,739
124
$331,577
270
$239,948
84
$78,091
4
$375,390
55
$251,374
3
$280,857
APPLICATIONS WITHDRAWN
35
$299,106
33
$339,834
76
$242,469
3
$56,210
1
$361,510
5
$279,176
0
$0
FILES CLOSED FOR INCOMPLETENESS
11
$365,949
25
$346,511
33
$289,312
6
$112,012
0
$0
8
$239,229
0
$0
Aggregated Statistics For Year 2007 (Based on 9 full and 16 partial tracts)
A) FHA, FSA/RHS & VA Home Purchase Loans
B) Conventional Home Purchase Loans
C) Refinancings
D) Home Improvement Loans
E) Loans on Dwellings For 5+ Families
F) Non-occupant Loans on < 5 Family Dwellings (A B C & D)
G) Loans On Manufactured Home Dwelling (A B C & D)
Number
Average Value
Number
Average Value
Number
Average Value
Number
Average Value
Number
Average Value
Number
Average Value
Number
Average Value
LOANS ORIGINATED
35
$318,189
408
$279,197
432
$238,415
63
$106,920
12
$543,082
183
$256,309
0
$0
APPLICATIONS APPROVED, NOT ACCEPTED
4
$434,485
141
$282,415
132
$237,876
24
$128,185
5
$964,322
68
$264,952
0
$0
APPLICATIONS DENIED
31
$344,091
499
$293,510
626
$249,463
141
$82,007
13
$263,008
253
$254,805
2
$77,395
APPLICATIONS WITHDRAWN
17
$267,429
110
$296,683
193
$239,321
13
$61,595
12
$478,456
68
$277,438
0
$0
FILES CLOSED FOR INCOMPLETENESS
0
$0
43
$279,074
69
$238,544
2
$95,950
0
$0
11
$290,827
0
$0
Aggregated Statistics For Year 2006 (Based on 9 full and 16 partial tracts)
A) FHA, FSA/RHS & VA Home Purchase Loans
B) Conventional Home Purchase Loans
C) Refinancings
D) Home Improvement Loans
E) Loans on Dwellings For 5+ Families
F) Non-occupant Loans on < 5 Family Dwellings (A B C & D)
G) Loans On Manufactured Home Dwelling (A B C & D)
Number
Average Value
Number
Average Value
Number
Average Value
Number
Average Value
Number
Average Value
Number
Average Value
Number
Average Value
LOANS ORIGINATED
19
$316,499
917
$218,497
677
$218,518
76
$109,132
39
$1,532,194
327
$205,208
0
$0
APPLICATIONS APPROVED, NOT ACCEPTED
9
$384,124
240
$205,730
168
$198,590
26
$133,847
3
$422,550
77
$194,136
0
$0
APPLICATIONS DENIED
9
$327,044
636
$224,913
608
$218,252
143
$76,868
3
$358,670
245
$222,259
1
$136,810
APPLICATIONS WITHDRAWN
15
$312,402
283
$211,747
297
$214,559
18
$79,984
6
$311,495
109
$222,830
3
$284,000
FILES CLOSED FOR INCOMPLETENESS
1
$201,000
61
$191,514
111
$233,831
1
$479,590
3
$311,527
28
$208,558
1
$7,000
Aggregated Statistics For Year 2005 (Based on 9 full and 16 partial tracts)
A) FHA, FSA/RHS & VA Home Purchase Loans
B) Conventional Home Purchase Loans
C) Refinancings
D) Home Improvement Loans
E) Loans on Dwellings For 5+ Families
F) Non-occupant Loans on < 5 Family Dwellings (A B C & D)
G) Loans On Manufactured Home Dwelling (A B C & D)
Number
Average Value
Number
Average Value
Number
Average Value
Number
Average Value
Number
Average Value
Number
Average Value
Number
Average Value
LOANS ORIGINATED
43
$271,503
830
$191,895
699
$202,669
91
$96,187
23
$606,989
435
$193,609
0
$0
APPLICATIONS APPROVED, NOT ACCEPTED
2
$250,905
157
$212,048
162
$174,535
24
$60,870
5
$464,528
96
$193,034
0
$0
APPLICATIONS DENIED
15
$268,180
421
$186,211
555
$182,668
113
$84,087
10
$382,106
171
$189,971
4
$232,725
APPLICATIONS WITHDRAWN
13
$308,449
351
$193,221
413
$177,082
36
$160,216
5
$495,314
132
$205,403
0
$0
FILES CLOSED FOR INCOMPLETENESS
1
$337,010
46
$184,226
82
$187,672
1
$14,280
0
$0
8
$204,300
0
$0
Aggregated Statistics For Year 2004 (Based on 9 full and 16 partial tracts)
A) FHA, FSA/RHS & VA Home Purchase Loans
B) Conventional Home Purchase Loans
C) Refinancings
D) Home Improvement Loans
E) Loans on Dwellings For 5+ Families
F) Non-occupant Loans on < 5 Family Dwellings (A B C & D)
G) Loans On Manufactured Home Dwelling (A B C & D)
Number
Average Value
Number
Average Value
Number
Average Value
Number
Average Value
Number
Average Value
Number
Average Value
Number
Average Value
LOANS ORIGINATED
88
$248,021
569
$190,375
531
$160,618
70
$88,660
32
$646,557
321
$167,076
1
$105,280
APPLICATIONS APPROVED, NOT ACCEPTED
22
$264,300
200
$200,918
113
$145,468
19
$62,575
2
$146,610
102
$184,356
2
$29,390
APPLICATIONS DENIED
39
$277,982
271
$206,915
392
$151,736
130
$44,780
8
$174,434
141
$174,619
1
$71,400
APPLICATIONS WITHDRAWN
27
$248,381
170
$197,220
219
$144,866
19
$98,265
5
$257,184
96
$172,305
0
$0
FILES CLOSED FOR INCOMPLETENESS
6
$221,407
40
$174,636
38
$136,944
7
$122,799
2
$149,305
10
$174,763
0
$0
Aggregated Statistics For Year 2003 (Based on 9 full and 16 partial tracts)
A) FHA, FSA/RHS & VA Home Purchase Loans
B) Conventional Home Purchase Loans
C) Refinancings
D) Home Improvement Loans
E) Loans on Dwellings For 5+ Families
F) Non-occupant Loans on < 5 Family Dwellings (A B C & D)
Number
Average Value
Number
Average Value
Number
Average Value
Number
Average Value
Number
Average Value
Number
Average Value
LOANS ORIGINATED
110
$210,215
247
$174,772
443
$142,500
37
$31,617
7
$629,853
171
$193,067
APPLICATIONS APPROVED, NOT ACCEPTED
9
$109,081
68
$152,470
164
$112,454
21
$35,798
3
$238,573
50
$134,229
APPLICATIONS DENIED
32
$220,122
130
$184,965
436
$124,656
86
$22,041
15
$2,114,337
100
$142,190
APPLICATIONS WITHDRAWN
25
$234,173
73
$187,550
213
$129,140
24
$31,777
4
$419,870
38
$150,966
FILES CLOSED FOR INCOMPLETENESS
8
$207,914
17
$171,039
24
$135,208
1
$220,860
1
$142,800
8
$162,816
Aggregated Statistics For Year 2002 (Based on 9 full and 14 partial tracts)
A) FHA, FSA/RHS & VA Home Purchase Loans
B) Conventional Home Purchase Loans
C) Refinancings
D) Home Improvement Loans
E) Loans on Dwellings For 5+ Families
F) Non-occupant Loans on < 5 Family Dwellings (A B C & D)
Number
Average Value
Number
Average Value
Number
Average Value
Number
Average Value
Number
Average Value
Number
Average Value
LOANS ORIGINATED
63
$173,055
169
$153,451
258
$102,085
47
$26,950
11
$163,815
102
$104,845
APPLICATIONS APPROVED, NOT ACCEPTED
10
$138,431
48
$120,468
109
$88,891
34
$17,753
3
$116,603
34
$102,426
APPLICATIONS DENIED
20
$168,976
82
$120,602
324
$93,919
80
$31,248
5
$125,134
61
$95,652
APPLICATIONS WITHDRAWN
15
$180,899
46
$144,897
159
$106,444
13
$39,208
1
$57,120
22
$100,529
FILES CLOSED FOR INCOMPLETENESS
3
$204,450
8
$145,252
26
$94,216
1
$54,000
0
$0
2
$89,620
Aggregated Statistics For Year 2001 (Based on 9 full and 14 partial tracts)
A) FHA, FSA/RHS & VA Home Purchase Loans
B) Conventional Home Purchase Loans
C) Refinancings
D) Home Improvement Loans
E) Loans on Dwellings For 5+ Families
F) Non-occupant Loans on < 5 Family Dwellings (A B C & D)
Number
Average Value
Number
Average Value
Number
Average Value
Number
Average Value
Number
Average Value
Number
Average Value
LOANS ORIGINATED
54
$128,845
95
$111,277
207
$90,597
54
$28,829
10
$358,643
72
$91,231
APPLICATIONS APPROVED, NOT ACCEPTED
12
$130,717
38
$104,246
85
$83,922
20
$23,865
6
$275,923
26
$88,807
APPLICATIONS DENIED
25
$127,266
110
$109,505
287
$83,944
127
$24,035
2
$90,145
74
$91,171
APPLICATIONS WITHDRAWN
10
$144,284
24
$115,590
126
$84,341
20
$19,022
0
$0
15
$80,205
FILES CLOSED FOR INCOMPLETENESS
3
$124,030
5
$105,662
38
$86,393
1
$30,000
0
$0
1
$10,000
Aggregated Statistics For Year 2000 (Based on 9 full and 14 partial tracts)
A) FHA, FSA/RHS & VA Home Purchase Loans
B) Conventional Home Purchase Loans
C) Refinancings
D) Home Improvement Loans
E) Loans on Dwellings For 5+ Families
F) Non-occupant Loans on < 5 Family Dwellings (A B C & D)
Number
Average Value
Number
Average Value
Number
Average Value
Number
Average Value
Number
Average Value
Number
Average Value
LOANS ORIGINATED
52
$119,396
104
$111,217
149
$79,908
38
$21,726
12
$355,571
51
$85,428
APPLICATIONS APPROVED, NOT ACCEPTED
8
$110,469
30
$101,068
55
$78,235
37
$19,524
1
$189,300
9
$84,184
APPLICATIONS DENIED
16
$112,516
97
$90,841
283
$80,168
111
$21,335
8
$511,924
57
$90,009
APPLICATIONS WITHDRAWN
15
$115,457
47
$87,079
95
$86,143
13
$29,101
0
$0
22
$61,681
FILES CLOSED FOR INCOMPLETENESS
2
$134,505
6
$80,213
92
$94,689
1
$8,380
0
$0
10
$149,928
Aggregated Statistics For Year 1999 (Based on 6 full and 10 partial tracts)
A) FHA, FSA/RHS & VA Home Purchase Loans
B) Conventional Home Purchase Loans
C) Refinancings
D) Home Improvement Loans
E) Loans on Dwellings For 5+ Families
F) Non-occupant Loans on < 5 Family Dwellings (A B C & D)
2006 - 2018 National Fire Incident Reporting System (NFIRS) incidents
Based on the data from the years 2006 - 2018 the average number of fire incidents per year is 87. The highest number of fire incidents - 167 took place in 2017, and the least - 17 in 2006. The data has a rising trend.
When looking into fire subcategories, the most reports belonged to: Structure Fires (57.4%), and Outside Fires (26.3%).
Fire incident types reported to NFIRS in Zip Code 07108


 Nearest zip codes: 07103, 07112, 07102, 07111, 07106, 07018.


 Based on the data from the years 2006 - 2018 the average number of fire incidents per year is 87. The highest number of fire incidents - 167 took place in 2017, and the least - 17 in 2006. The data has a rising trend.
 When looking into fire subcategories, the most reports belonged to: Structure Fires (57.4%), and Outside Fires (26.3%).