Estimated zip code population in 2022: 36,587 Zip code population in 2010: 31,298 Zip code population in 2000: 33,970
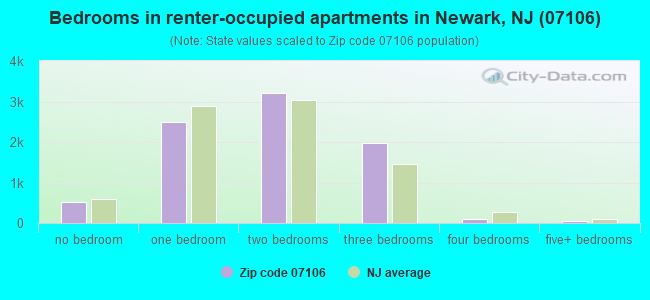
Houses and condos: 14,004 Renter-occupied apartments: 8,374
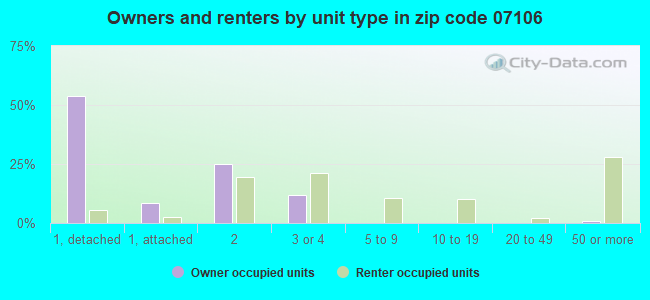
% of renters here:
65%
State:
35%
March 2022 cost of living index in zip code 07106: 114.4 (more than average, U.S. average is 100)
Land area: 1.4 sq. mi. Water area: 0.0 sq. mi.
Population density: 25,679 people per square mile
(very high).
OSM Map
Google Map
MSN Map
OSM Map
General Map
Google Map
MSN Map
OSM Map
Google Map
MSN Map
OSM Map
Google Map
MSN Map
Please wait while loading the map...
Real estate property taxes paid for housing units in 2022:
This zip code:
2.0% ($6,145)
New Jersey:
2.1% ($8,897)
Median real estate property taxes paid for housing units with mortgages in 2022: $6,263 (2.0%) Median real estate property taxes paid for housing units with no mortgage in 2022: $5,851 (2.2%)
Averages for the 2020 tax year for zip code 07106, filed in 2021:
Average Adjusted Gross Income (AGI) in 2020: $38,361 (Individual Income Tax Returns)
Here:
$38,361
State:
$95,247
Salary/wage: $36,736 (reported on 86.4% of returns)
Here:
$36,736
State:
$80,635
(% of AGI for various income ranges: 1112.8% for AGIs below $25k, 3648.7% for AGIs $25k-50k, 6931.7% for AGIs $50k-75k, 10551.8% for AGIs $75k-100k, 16947.8% for AGIs $100k-200k)
Taxable interest for individuals: $377 (reported on 8.7% of returns)
This zip code:
$377
New Jersey:
$2,414
(% of AGI for various income ranges: 2.3% for AGIs below $25k, 2.3% for AGIs $25k-50k, 5.4% for AGIs $50k-75k, 14.4% for AGIs $75k-100k, 23.1% for AGIs $100k-200k)
Ordinary dividends: $824 (reported on 3.8% of returns)
Here:
$824
State:
$8,057
(% of AGI for various income ranges: 1.1% for AGIs below $25k, 1.5% for AGIs $25k-50k, 3.4% for AGIs $50k-75k, 22.6% for AGIs $75k-100k, 36.4% for AGIs $100k-200k)
Net capital gain/loss in AGI: +$3,846 (reported on 3.6% of returns)
Here:
+$3,846
State:
+$25,022
(% of AGI for various income ranges: 0.8% for AGIs below $25k, 1.5% for AGIs $25k-50k, 11.8% for AGIs $50k-75k, 34.7% for AGIs $75k-100k, 360.2% for AGIs $100k-200k)
Profit/loss from business: +$2,704 (reported on 17.1% of returns)
Here:
+$2,704
State:
+$18,035
(% of AGI for various income ranges: 120.7% for AGIs below $25k, 45.1% for AGIs $50k-75k, 59.4% for AGIs $75k-100k, 21.8% for AGIs $100k-200k)
Taxable individual retirement arrangement distribution: $10,143 (reported on 2.0% of returns)
07106:
$10,143
New Jersey:
$21,558
(% of AGI for various income ranges: 11.2% for AGIs below $25k, 10.4% for AGIs $25k-50k, 33.4% for AGIs $50k-75k, 105.8% for AGIs $75k-100k, 172.9% for AGIs $100k-200k)
Total itemized deductions: $24,759 (reported on 7.2% of returns)
Here:
$24,759
State:
$32,863
(% of AGI for various income ranges: 34.9% for AGIs below $25k, 141.5% for AGIs $25k-50k, 408.0% for AGIs $50k-75k, 815.2% for AGIs $75k-100k, 1446.9% for AGIs $100k-200k)
Charity contributions: $7,037 (reported on 6.0% of returns)
Here:
$7,037
State:
$7,880
(% of AGI for various income ranges: 4.7% for AGIs below $25k, 28.7% for AGIs $25k-50k, 94.8% for AGIs $50k-75k, 206.7% for AGIs $75k-100k, 451.3% for AGIs $100k-200k)
Taxes paid: $8,352 (reported on 7.2% of returns)
07106:
$8,352
State:
$9,183
(% of AGI for various income ranges: 9.9% for AGIs below $25k, 40.9% for AGIs $25k-50k, 136.2% for AGIs $50k-75k, 304.4% for AGIs $75k-100k, 516.4% for AGIs $100k-200k)
Earned income credit: $2,399 (reported on 30.3% of returns)
Here:
$2,399
State:
$2,148
(% of AGI for various income ranges: 145.7% for AGIs below $25k, 92.1% for AGIs $25k-50k, 1.0% for AGIs $50k-75k)
Percentage of individuals using paid preparers for their 2020 taxes: 92.5%
Here:
93%
State:
92%
(% for various income ranges: 92.1% for AGIs below $25k, 93.9% for AGIs $25k-50k, 92.4% for AGIs $50k-75k, 90.5% for AGIs $75k-100k, 90.3% for AGIs $100k-200k, 80.0% for AGIs over 200k)
Averages for the 2012 tax year for zip code 07106, filed in 2013:
Average Adjusted Gross Income (AGI) in 2012: $33,401 (Individual Income Tax Returns)
Here:
$33,401
State:
$79,688
Salary/wage: $32,903 (reported on 86.3% of returns)
Here:
$32,903
State:
$68,122
(% of AGI for various income ranges: 72.4% for AGIs below $25k, 90.5% for AGIs $25k-50k, 88.5% for AGIs $50k-75k, 87.5% for AGIs $75k-100k, 84.8% for AGIs $100k-200k, 55.9% for AGIs over 200k)
Taxable interest for individuals: $368 (reported on 13.5% of returns)
This zip code:
$368
New Jersey:
$2,193
(% of AGI for various income ranges: 0.2% for AGIs below $25k, 0.2% for AGIs $25k-50k, 0.1% for AGIs $50k-75k, 0.1% for AGIs $75k-100k, 0.1% for AGIs $100k-200k)
Ordinary dividends: $937 (reported on 4.5% of returns)
Here:
$937
State:
$6,828
(% of AGI for various income ranges: 0.2% for AGIs $50k-75k, 0.3% for AGIs $75k-100k)
Net capital gain/loss in AGI: +$563 (reported on 2.0% of returns)
Here:
+$563
State:
+$15,358
(% of AGI for various income ranges: 0.3% for AGIs $100k-200k)
Profit/loss from business: +$6,080 (reported on 14.6% of returns)
Here:
+$6,080
State:
+$19,577
(% of AGI for various income ranges: 12.8% for AGIs below $25k, 0.4% for AGIs $50k-75k, 0.2% for AGIs $75k-100k, 0.3% for AGIs $100k-200k)
Taxable individual retirement arrangement distribution: $10,026 (reported on 2.6% of returns)
07106:
$10,026
New Jersey:
$18,214
(% of AGI for various income ranges: 0.7% for AGIs below $25k, 0.5% for AGIs $25k-50k, 1.0% for AGIs $50k-75k, 0.9% for AGIs $75k-100k, 1.2% for AGIs $100k-200k)
Total itemized deductions: $18,192 (30% of AGI, reported on 23.4% of returns)
Here:
$18,192
State:
$30,827
Here:
29.9% of AGI
State:
21.2% of AGI
(% of AGI for various income ranges: 6.0% for AGIs below $25k, 11.1% for AGIs $25k-50k, 15.2% for AGIs $50k-75k, 17.9% for AGIs $75k-100k, 17.0% for AGIs $100k-200k, 15.0% for AGIs over 200k)
Charity contributions: $3,866 (reported on 19.0% of returns)
Here:
$3,866
State:
$3,451
(% of AGI for various income ranges: 0.7% for AGIs below $25k, 1.9% for AGIs $25k-50k, 2.7% for AGIs $50k-75k, 3.2% for AGIs $75k-100k, 3.6% for AGIs $100k-200k)
Taxes paid: $5,361 (reported on 23.3% of returns)
07106:
$5,361
State:
$15,801
(% of AGI for various income ranges: 1.4% for AGIs below $25k, 2.5% for AGIs $25k-50k, 4.4% for AGIs $50k-75k, 6.2% for AGIs $75k-100k, 6.4% for AGIs $100k-200k, 6.3% for AGIs over 200k)
Earned income credit: $2,454 (reported on 35.4% of returns)
Here:
$2,454
State:
$2,182
(% of AGI for various income ranges: 11.1% for AGIs below $25k, 1.4% for AGIs $25k-50k)
Percentage of individuals using paid preparers for their 2012 taxes: 68.8%
Here:
69%
State:
65%
(% for various income ranges: 68.4% for AGIs below $25k, 68.3% for AGIs $25k-50k, 70.0% for AGIs $50k-75k, 71.0% for AGIs $75k-100k, 73.9% for AGIs $100k-200k)
Averages for the 2004 tax year for zip code 07106, filed in 2005:
Average Adjusted Gross Income (AGI) in 2004: $29,937 (Individual Income Tax Returns)
Here:
$29,937
State:
$64,921
Salary/wage: $30,138 (reported on 91.7% of returns)
Here:
$30,138
State:
$57,755
(% of AGI for various income ranges: 82.6% for AGIs below $10k, 88.6% for AGIs $10k-25k, 96.2% for AGIs $25k-50k, 93.1% for AGIs $50k-75k, 91.7% for AGIs $75k-100k, 84.8% for AGIs over 100k)
Taxable interest for individuals: $536 (reported on 22.6% of returns)
This zip code:
$536
New Jersey:
$2,068
(% of AGI for various income ranges: 0.9% for AGIs below $10k, 0.4% for AGIs $10k-25k, 0.3% for AGIs $25k-50k, 0.5% for AGIs $50k-75k, 0.3% for AGIs $75k-100k, 0.3% for AGIs over 100k)
Taxable dividends: $620 (reported on 6.3% of returns)
Here:
$620
State:
$3,959
(% of AGI for various income ranges: 0.2% for AGIs below $10k, 0.1% for AGIs $10k-25k, 0.1% for AGIs $25k-50k, 0.1% for AGIs $50k-75k, 0.3% for AGIs $75k-100k, 0.2% for AGIs over 100k)
Net capital gain/loss: +$2,690 (reported on 3.7% of returns)
Here:
+$2,690
State:
+$13,591
(% of AGI for various income ranges: 0.1% for AGIs below $10k, -0.0% for AGIs $10k-25k, 0.2% for AGIs $25k-50k, 0.4% for AGIs $50k-75k, 0.1% for AGIs $75k-100k, 2.2% for AGIs over 100k)
Profit/loss from business: +$3,635 (reported on 9.6% of returns)
Here:
+$3,635
State:
+$17,520
(% of AGI for various income ranges: 11.9% for AGIs below $10k, 3.8% for AGIs $10k-25k, 0.3% for AGIs $25k-50k, 0.1% for AGIs $50k-75k, -0.2% for AGIs $75k-100k, -0.4% for AGIs over 100k)
IRA payment deduction: $2,634 (reported on 1.0% of returns)
07106:
$2,634
New Jersey:
$3,270
(% of AGI for various income ranges: 0.1% for AGIs $10k-25k, 0.1% for AGIs $25k-50k, 0.1% for AGIs $50k-75k, 0.1% for AGIs $75k-100k)
Total itemized deductions: $15,715 (31% of AGI, reported on 27.9% of returns)
Here:
$15,715
State:
$23,924
Here:
30.8% of AGI
State:
21.1% of AGI
(% of AGI for various income ranges: 6.0% for AGIs below $10k, 8.3% for AGIs $10k-25k, 13.9% for AGIs $25k-50k, 19.1% for AGIs $50k-75k, 19.9% for AGIs $75k-100k, 17.8% for AGIs over 100k)
Charity contributions deductions: $3,687 (7% of AGI, reported on 25.2% of returns)
Here:
$3,687
State:
$3,242
Here:
7.0% of AGI
State:
2.7% of AGI
(% of AGI for various income ranges: 0.5% for AGIs below $10k, 1.3% for AGIs $10k-25k, 2.9% for AGIs $25k-50k, 4.2% for AGIs $50k-75k, 4.7% for AGIs $75k-100k, 4.1% for AGIs over 100k)
Total tax: $3,239 (reported on 60.5% of returns)
07106:
$3,239
State:
$12,321
(% of AGI for various income ranges: 2.7% for AGIs below $10k, 2.4% for AGIs $10k-25k, 5.0% for AGIs $25k-50k, 8.7% for AGIs $50k-75k, 10.2% for AGIs $75k-100k, 14.4% for AGIs over 100k)
Earned income credit: $1,875 (reported on 33.9% of returns)
Here:
$1,875
State:
$1,711
Percentage of individuals using paid preparers for their 2004 taxes: 72.7%
Here:
73%
State:
65%
(% for various income ranges: 68.3% for AGIs below $10k, 76.5% for AGIs $10k-25k, 72.4% for AGIs $25k-50k, 70.8% for AGIs $50k-75k, 70.3% for AGIs $75k-100k, 73.6% for AGIs over 100k)
Likely homosexual households (counted as self-reported same-sex unmarried-partner households)
Lesbian couples: 0.1% of all households
Gay men: 0.0% of all households
Household received Food Stamps/SNAP in the past 12 months: 2,364 Household did not receive Food Stamps/SNAP in the past 12 months: 10,749
Women who had a birth in the past 12 months: 827 (542 now married, 280 unmarried) Women who did not have a birth in the past 12 months: 7,712 (1,746 now married, 5,996 unmarried)
Housing units in zip code 07106 with a mortgage: 3,168 (235 second mortgage, 35 home equity loan, 172 both second mortgage and home equity loan) Houses without a mortgage: 24
Median monthly owner costs for units with a mortgage: $2,272 Median monthly owner costs for units without a mortgage: $926
Residents with income below the poverty level in 2022:
This zip code:
20.3%
Whole state:
9.7%
Residents with income below 50% of the poverty level in 2022:
This zip code:
7.1%
Whole state:
5.2%
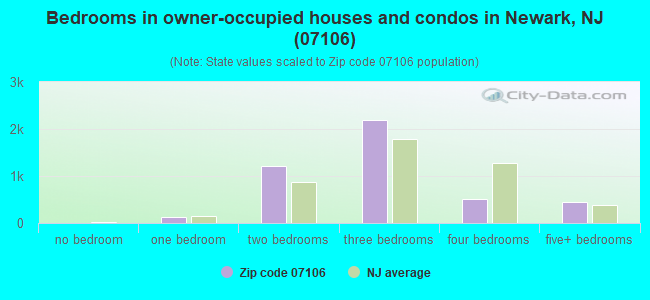
Median number of rooms in houses and condos:
Here:
6.2
State:
6.8
Median number of rooms in apartments:
Here:
4.1
State:
3.9
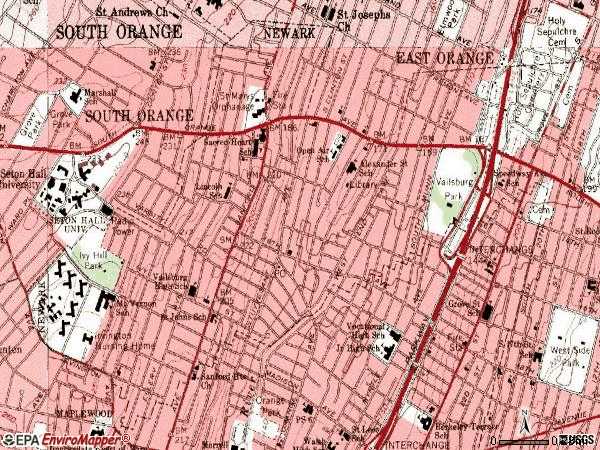
Notable locations in this zip code not listed on our city pages
Notable locations in zip code 07106: Vailsburg Branch Newark Public Library (A), Saint Marys Orphanage (B), Newark Fire Department Engine 26 (C). Display/hide their locations on the map
Churches in zip code 07106 include: Sacred Heart Church (A), Shekinah Glory Christian Church (B), Sanford Heights Church (C). Display/hide their locations on the map
3,009 married couples with children.
3,959 single-parent households (584 men, 3,375 women).
65.9% of residents of 07106 zip code speak English at home.
9.1% of residents speak Spanish at home (56% very well, 17% well, 20% not well, 7% not at all).
17.1% of residents speak other Indo-European language at home (42% very well, 26% well, 26% not well, 7% not at all).
0.9% of residents speak Asian or Pacific Island language at home (47% very well, 34% well, 19% not well).
6.9% of residents speak other language at home (86% very well, 12% well, 2% not well).
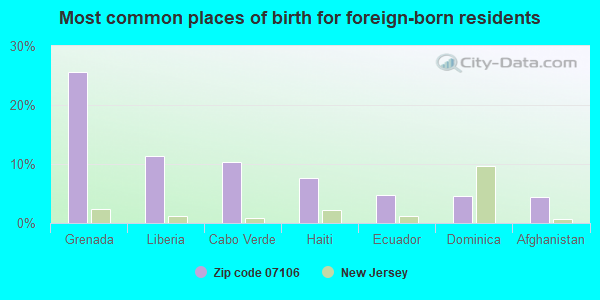
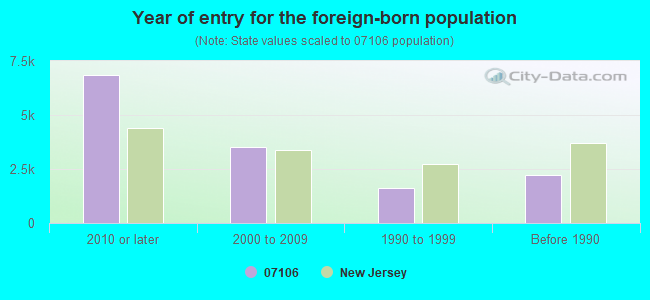
Foreign born population: 12,871 (35.2%) (52.0% of them are naturalized citizens)
Major facilities with environmental interests located in this zip code:
NEWARK CITY BD OF ED BOYLAN STREET SCHOOL (15 BOYLAN ST in NEWARK, NJ)
ENFORCEMENT/COMPLIANCE ACTIVITY (Integrated Compliance Information System) COMPLIANCE ACTIVITY (Tracking inspections of insecticide, fungicide, and rodenticide, and toxic substances) (National Center for Education Statistics) - STATE ID-240 STATE MASTER (New Jersey environmental info) - NJEMS-014202, STATE CLEANUP SITE, NJEMS-08119, AIR PROGRAM Small Quantity Generators, between 100 kg and 1000 kg of hazardous waste/month (Resource Conservation and Recovery Act (tracking hazardous waste)) - notification Organizations: NEWARK PUBLIC SCHOOLS (CONTACT/OWNER)
Alternative names: BOYLAN EARLY CHILD CARE CTR, BOYLAN EARLY CHILDHOOD CENTER, NEWARK PUBLIC SCHOOLS BOYLAN STREET SCH
NEWARK CITY BD OF ED ALEXANDER STREET SCHOOL (43 ALEXANDER ST in NEWARK, NJ)
(National Center for Education Statistics) - STATE ID-180 STATE MASTER (New Jersey environmental info) - NJEMS-3570-180-13, PESTICIDES - APPLICATION, NJEMS-014193, STATE CLEANUP SITE, NJEMS-05395, AIR PROGRAM Small Quantity Generators, between 100 kg and 1000 kg of hazardous waste/month (Resource Conservation and Recovery Act (tracking hazardous waste)) - notification Business SIC classification: ELEMENTARY AND SECONDARY SCHOOLS Organizations: NEWARK PUBLIC SCHOOLS (CONTACT/OWNER)
Alternative names: ALEXANDER STREET ELEM SCHOOL, NEWARK PUBLIC SCHOOLS ALEXANDER ST SCH
NEWARK CITY BD OF ED LINCOLN SCHOOL (87 RICHELIEU TER in NEWARK, NJ)
(National Center for Education Statistics) - STATE ID-490 STATE MASTER (New Jersey environmental info) - NJEMS-014231, STATE CLEANUP SITE, NJEMS-06731, AIR PROGRAM Small Quantity Generators, between 100 kg and 1000 kg of hazardous waste/month (Resource Conservation and Recovery Act (tracking hazardous waste)) - notification Organizations: NEWARK PUBLIC SCHOOLS (CONTACT/OWNER)
Alternative names: NEWARK PUBLIC SCHOOLS LINCOLN SCHOOL
NEWARK CITY BD OF ED SPEEDWAY ELEMENTARY SCHOOL (26 SPEEDWAY AVE in NEWARK, NJ)
(National Center for Education Statistics) - STATE ID-690 STATE MASTER (New Jersey environmental info) - NJEMS-014253, STATE CLEANUP SITE, NJEMS-08121, AIR PROGRAM Small Quantity Generators, between 100 kg and 1000 kg of hazardous waste/month (Resource Conservation and Recovery Act (tracking hazardous waste)) - notification Organizations: NEWARK PUBLIC SCHOOLS (CONTACT/OWNER)
Alternative names: NEWARK PUBLIC SCHOOLS SPEEDWAY AVE SCH, SPEEDWAY AVENUE ELEM SCHOOL
PABST BREWING CO (400 GROVE ST in NEWARK, NJ)
STATE MASTER (New Jersey environmental info) - NJEMS-009393, STATE CLEANUP SITE, NJEMS-016125, NJEMS-NJD002447449, HAZARDOUS WASTE PROGRAM HAZARDOUS WASTE BIENNIAL REPORTER (Resource Conservation and Recovery Act (tracking hazardous waste)) Small Quantity Generators, between 100 kg and 1000 kg of hazardous waste/month (Resource Conservation and Recovery Act (tracking hazardous waste)) TRANSPORTER (Resource Conservation and Recovery Act (tracking hazardous waste)) Organizations: PABST BREWING CO - ATTN :YEORYIOS APPALLAS, NEW WEST DEVELOPERS, PABST BREWING CO INC (CONTACT/OWNER)
FEDERAL BUSINESS CENTERS STORAGE WAREHOUSES (320 ELIZABETH AVENUE in NEWARK, NJ)
STATE MASTER (New Jersey environmental info) - NJEMS-00000007486, EPCRA, NJEMS-015734, STATE CLEANUP SITE, NJEMS-81371700000, EPCRA, NJEMS-NJR000034488, HAZARDOUS WASTE PROGRAM, NJEMS-NRG000000191, (Resource Conservation and Recovery Act (tracking hazardous waste)) Business SIC classification: TRUCKING, EXCEPT LOCAL; CHEMICALS AND ALLIED PRODUCTS Organizations: JPM IMPORTS INC, DEVICO AUGUST, FEDERAL STORAGE WAREHOUSES INC (CONTACT/OWNER)
Alternative names: FEDERAL STORAGE WAREHOUSES
NEWARK CITY BD OF ED MOUNT VERNON SCHOOL (142 MT VERNON PL in NEWARK, NJ)
STATE MASTER (New Jersey environmental info) - NJEMS-014241, STATE CLEANUP SITE (Resource Conservation and Recovery Act (tracking hazardous waste)) Alternative names: NEWARK PUBLIC SCHOOLS MOUNT VERNON SCH
GETTY SERVICE STATION #00664 (953 18TH AVE in NEWARK, NJ)
STATE MASTER (New Jersey environmental info) - NJEMS-001720, STATE CLEANUP SITE (Resource Conservation and Recovery Act (tracking hazardous waste)) Organizations: GETTY PROPERTIES CORP, GETTY PETROLEUM MARKETING INC (CONTACT/OWNER)
Alternative names: GETTY PETROLEUM CORP
EXXON SERVICE STATION #32233 (1129 S ORANGE AVE in NEWARK, NJ)
STATE MASTER (New Jersey environmental info) - NJEMS-024386, STATE CLEANUP SITE, NJEMS-08009, AIR PROGRAM, NJEMS-00000037995, EPCRA (Resource Conservation and Recovery Act (tracking hazardous waste)) Business SIC classification: GASOLINE SERVICE STATIONS; GENERAL AUTOMOTIVE REPAIR SHOPS Organizations: EXXON MOBIL CORP, EXXON CO USA (CONTACT/OWNER)
Alternative names: EXXON CO USA 32233
CHOIS CLEANER (190 EASTERN PKWY in NEWARK, NJ)
STATE MASTER (New Jersey environmental info) - NJEMS-89770000000, EPCRA, NJEMS-L9178, AIR PROGRAM (Resource Conservation and Recovery Act (tracking hazardous waste)) Business SIC classification: DRYCLEANING PLANTS, EXCEPT RUG CLEANING Organizations: CHOIS CLEANERS Alternative names: ONE HOUR MARTINIZING
1 HOUR MARTINIZING CLEANERS (903 18TH AVE in NEWARK, NJ)
STATE MASTER (New Jersey environmental info) - NJEMS-L9018, AIR PROGRAM Conditionally Exempt Small Quantity Generators, less than 100 kg/month of hazardous waste (Resource Conservation and Recovery Act (tracking hazardous waste)) - notification Business SIC classification: DRYCLEANING PLANTS, EXCEPT RUG CLEANING Organizations: MR KIM (CONTACT/OWNER)
Alternative names: ONE HOUR MARTINIZING
NEWARK CITY FIRE DEPT HDQTRS (1010 18TH AVE in NEWARK, NJ)
STATE MASTER (New Jersey environmental info) - NJEMS-015151, STATE CLEANUP SITE Conditionally Exempt Small Quantity Generators, less than 100 kg/month of hazardous waste (Resource Conservation and Recovery Act (tracking hazardous waste)) - notification Organizations: CITY OF NEWARK (CONTACT/OWNER)
, NEWARK CITY DIVISION OF MOTORS (CONTACT/OWNER)
Alternative names: NEWARK CITY OF FIRE HEADQUARTERS
Housing units lacking complete plumbing facilities: 0.9% Housing units lacking complete kitchen facilities: 1.9%
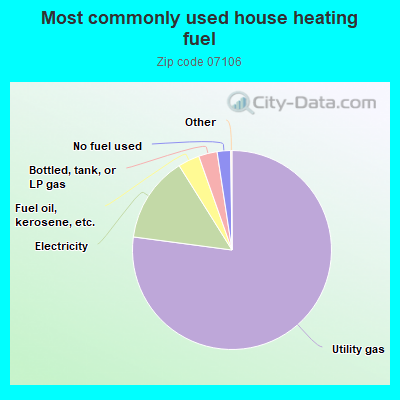
77.1%Utility gas
14.0%Electricity
3.5%Fuel oil, kerosene, etc.
3.0%Bottled, tank, or LP gas
2.2%No fuel used
Population in 1990: 35,013.
Place of birth for U.S.-born residents:
This state: 17,747
Northeast: 2,685
South: 2,245
West: 147
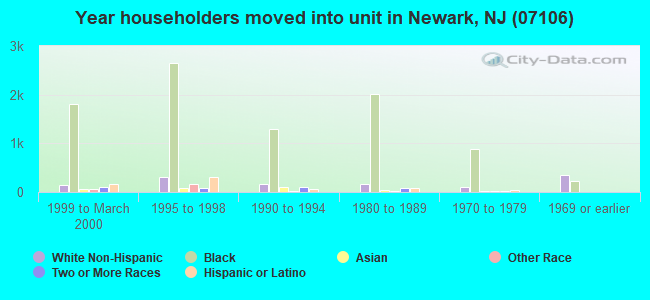
63% of the 07106 zip code residents lived in the same house 5 years ago. Out of people who lived in different houses, 81% lived in this county. Out of people who lived in different counties, 50% lived in New Jersey.
94% of the 07106 zip code residents lived in the same house 1 year ago. Out of people who lived in different houses, 39% moved from this county. Out of people who lived in different houses, 16% moved from different county within same state. Out of people who lived in different houses, 28% moved from different state. Out of people who lived in different houses, 24% moved from abroad.
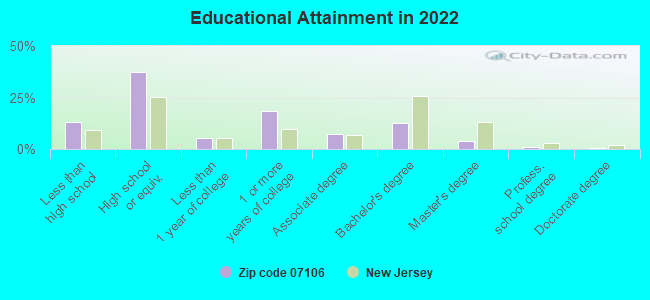
Private vs. public school enrollment:
Students in private schools in grades 1 to 8 (elementary and middle school): 94
Here:
2.4%
New Jersey:
12.3%
Students in private schools in grades 9 to 12 (high school): 50
Here:
2.8%
New Jersey:
13.1%
Students in private undergraduate colleges: 404
Here:
22.4%
New Jersey:
33.2%
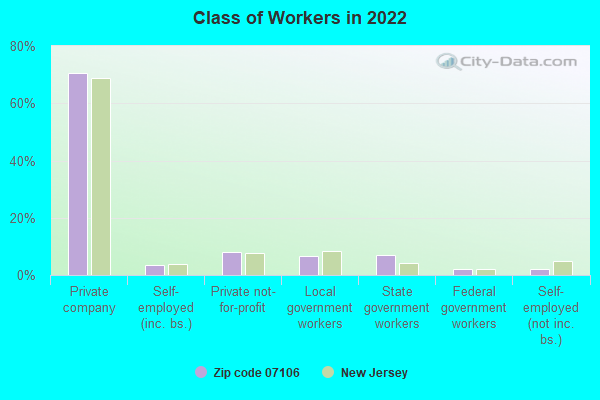
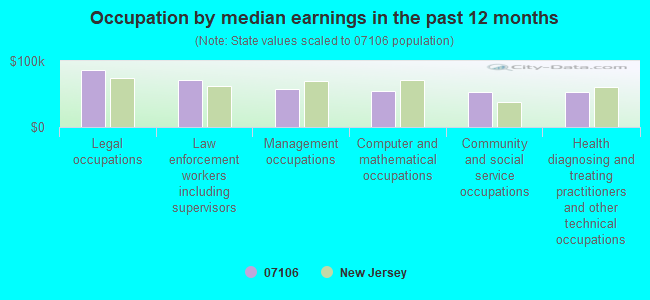
Occupation by median earnings in the past 12 months ($)
86,637Legal occupations
71,096Law enforcement workers including supervisors
57,357Management occupations
54,239Computer and mathematical occupations
53,051Community and social service occupations
52,627Health diagnosing and treating practitioners and other technical occupations
Top industries in this zip code by the number of employees in 2005:
Health Care and Social Assistance: Other Individual and Family Services (100-249 employees: 1 establishment, 1-4 employees: 1 establishment)
Health Care and Social Assistance: Child Day Care Services (20-49: 3, 10-19: 3, 5-9: 2, 1-4: 1)
Other Services (except Public Administration): Religious Organizations (20-49: 2, 10-19: 1, 5-9: 2)
Real Estate and Rental and Leasing: Lessors of Residential Buildings and Dwellings (50-99: 1, 1-4: 1)
Accommodation and Food Services: Limited-Service Restaurants (20-49: 1, 1-4: 11)
Finance and Insurance: Savings Institutions (10-19: 3)
Health Care and Social Assistance: Offices of Physicians (except Mental Health Specialists) (20-49: 1, 1-4: 4)
Arts, Entertainment, and Recreation: Fitness and Recreational Sports Centers (10-19: 2, 5-9: 1)
People in group quarters in 2000:
17 people in religious group quarters
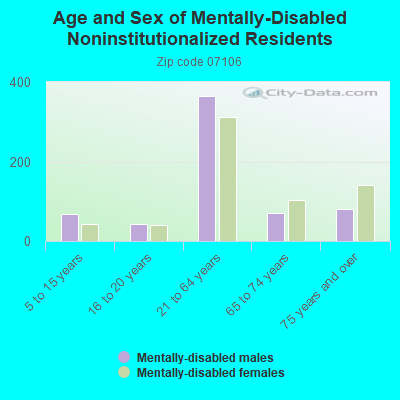
12 people in homes for the mentally ill
5 people in other noninstitutional group quarters
Fatal accident statistics in 2014:
Fatal accident count: 1
Vehicles involved in fatal accidents: 1
Fatal accidents caused by drunken drivers: 0
Fatalities: 1
Persons involved in fatal accidents: 1
Pedestrians involved in fatal accidents: 1
Fatal accident statistics in 2011:
Fatal accident count: 2
Vehicles involved in fatal accidents: 4
Fatal accidents caused by drunken drivers: 3
Fatalities: 2
Persons involved in fatal accidents: 6
Pedestrians involved in fatal accidents: 0
Home Mortgage Disclosure Act Aggregated Statistics For Year 2009 (Based on 14 full and 2 partial tracts)
A) FHA, FSA/RHS & VA Home Purchase Loans
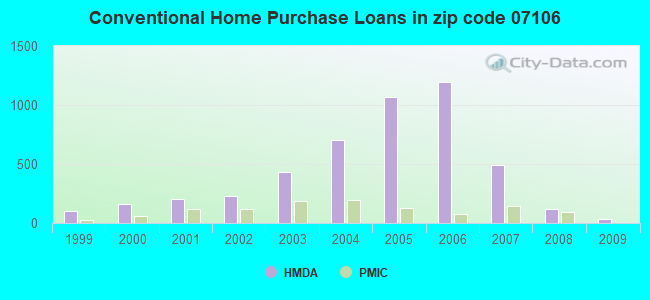
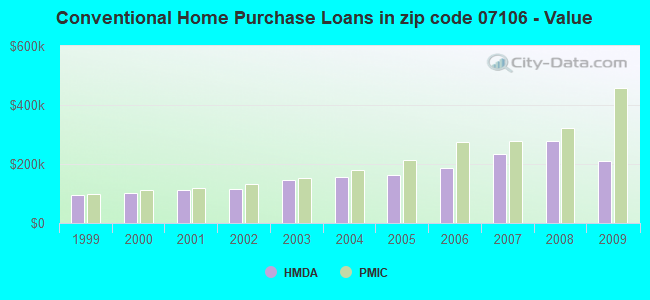
B) Conventional Home Purchase Loans
C) Refinancings
D) Home Improvement Loans
E) Loans on Dwellings For 5+ Families
F) Non-occupant Loans on < 5 Family Dwellings (A B C & D)
G) Loans On Manufactured Home Dwelling (A B C & D)
Number
Average Value
Number
Average Value
Number
Average Value
Number
Average Value
Number
Average Value
Number
Average Value
Number
Average Value
LOANS ORIGINATED
113
$216,664
34
$211,732
435
$228,509
31
$64,448
2
$23,120,755
32
$182,612
2
$171,415
APPLICATIONS APPROVED, NOT ACCEPTED
14
$177,757
4
$173,160
65
$219,129
8
$18,709
0
$0
8
$235,329
0
$0
APPLICATIONS DENIED
81
$227,284
54
$162,131
373
$203,323
75
$49,173
4
$607,802
49
$174,986
0
$0
APPLICATIONS WITHDRAWN
34
$223,794
20
$177,156
191
$211,746
12
$24,509
2
$261,815
21
$169,590
0
$0
FILES CLOSED FOR INCOMPLETENESS
37
$241,054
2
$249,025
88
$226,068
4
$99,380
0
$0
10
$202,891
0
$0
Aggregated Statistics For Year 2008 (Based on 14 full and 2 partial tracts)
A) FHA, FSA/RHS & VA Home Purchase Loans
B) Conventional Home Purchase Loans
C) Refinancings
D) Home Improvement Loans
E) Loans on Dwellings For 5+ Families
F) Non-occupant Loans on < 5 Family Dwellings (A B C & D)
G) Loans On Manufactured Home Dwelling (A B C & D)
Number
Average Value
Number
Average Value
Number
Average Value
Number
Average Value
Number
Average Value
Number
Average Value
Number
Average Value
LOANS ORIGINATED
115
$269,225
122
$278,283
527
$209,532
90
$65,634
6
$1,619,895
57
$231,261
0
$0
APPLICATIONS APPROVED, NOT ACCEPTED
10
$239,919
41
$263,524
164
$194,466
41
$29,284
2
$205,415
40
$189,205
0
$0
APPLICATIONS DENIED
53
$255,226
172
$257,409
669
$214,129
230
$62,632
12
$281,287
116
$206,787
4
$142,160
APPLICATIONS WITHDRAWN
31
$288,559
49
$265,233
196
$226,616
22
$141,254
2
$261,975
27
$234,731
0
$0
FILES CLOSED FOR INCOMPLETENESS
14
$278,671
22
$315,127
64
$215,320
4
$9,448
0
$0
13
$275,202
0
$0
Aggregated Statistics For Year 2007 (Based on 14 full and 2 partial tracts)
A) FHA, FSA/RHS & VA Home Purchase Loans
B) Conventional Home Purchase Loans
C) Refinancings
D) Home Improvement Loans
E) Loans on Dwellings For 5+ Families
F) Non-occupant Loans on < 5 Family Dwellings (A B C & D)
G) Loans On Manufactured Home Dwelling (A B C & D)
Number
Average Value
Number
Average Value
Number
Average Value
Number
Average Value
Number
Average Value
Number
Average Value
Number
Average Value
LOANS ORIGINATED
59
$276,235
489
$234,768
1,115
$198,982
162
$77,030
20
$567,376
204
$215,296
0
$0
APPLICATIONS APPROVED, NOT ACCEPTED
4
$243,340
205
$232,821
278
$192,908
62
$55,235
0
$0
68
$225,835
0
$0
APPLICATIONS DENIED
49
$261,556
611
$256,626
1,153
$222,228
278
$80,986
10
$636,539
263
$241,056
2
$53,005
APPLICATIONS WITHDRAWN
21
$293,210
179
$246,858
444
$207,635
51
$104,525
2
$2,092,860
81
$240,259
0
$0
FILES CLOSED FOR INCOMPLETENESS
6
$279,318
56
$241,077
202
$230,773
0
$0
0
$0
23
$227,883
0
$0
Aggregated Statistics For Year 2006 (Based on 14 full and 2 partial tracts)
A) FHA, FSA/RHS & VA Home Purchase Loans
B) Conventional Home Purchase Loans
C) Refinancings
D) Home Improvement Loans
E) Loans on Dwellings For 5+ Families
F) Non-occupant Loans on < 5 Family Dwellings (A B C & D)
G) Loans On Manufactured Home Dwelling (A B C & D)
Number
Average Value
Number
Average Value
Number
Average Value
Number
Average Value
Number
Average Value
Number
Average Value
Number
Average Value
LOANS ORIGINATED
52
$244,926
1,194
$187,639
1,692
$190,927
199
$81,528
15
$435,625
467
$207,440
2
$14,455
APPLICATIONS APPROVED, NOT ACCEPTED
10
$296,696
243
$185,570
349
$171,454
64
$37,452
2
$286,875
90
$211,628
2
$109,170
APPLICATIONS DENIED
23
$263,707
818
$203,092
1,183
$194,143
267
$71,886
10
$680,481
338
$212,357
8
$192,658
APPLICATIONS WITHDRAWN
18
$273,146
507
$195,520
763
$183,533
57
$127,388
6
$574,913
184
$200,628
10
$155,541
FILES CLOSED FOR INCOMPLETENESS
8
$292,326
143
$213,688
192
$212,934
8
$138,689
0
$0
68
$233,650
4
$211,062
Aggregated Statistics For Year 2005 (Based on 14 full and 2 partial tracts)
A) FHA, FSA/RHS & VA Home Purchase Loans
B) Conventional Home Purchase Loans
C) Refinancings
D) Home Improvement Loans
E) Loans on Dwellings For 5+ Families
F) Non-occupant Loans on < 5 Family Dwellings (A B C & D)
G) Loans On Manufactured Home Dwelling (A B C & D)
Number
Average Value
Number
Average Value
Number
Average Value
Number
Average Value
Number
Average Value
Number
Average Value
Number
Average Value
LOANS ORIGINATED
80
$224,869
1,064
$162,540
1,657
$174,703
229
$74,311
33
$824,531
522
$182,380
0
$0
APPLICATIONS APPROVED, NOT ACCEPTED
25
$215,399
207
$174,441
345
$153,318
73
$59,276
4
$290,362
96
$175,770
0
$0
APPLICATIONS DENIED
12
$223,868
443
$175,774
1,141
$163,487
352
$62,465
10
$271,949
219
$194,670
4
$143,050
APPLICATIONS WITHDRAWN
26
$207,580
393
$170,593
1,052
$166,027
88
$144,750
6
$248,693
213
$171,276
0
$0
FILES CLOSED FOR INCOMPLETENESS
4
$173,408
103
$161,055
140
$174,835
10
$67,679
0
$0
33
$170,264
0
$0
Aggregated Statistics For Year 2004 (Based on 14 full and 2 partial tracts)
A) FHA, FSA/RHS & VA Home Purchase Loans
B) Conventional Home Purchase Loans
C) Refinancings
D) Home Improvement Loans
E) Loans on Dwellings For 5+ Families
F) Non-occupant Loans on < 5 Family Dwellings (A B C & D)
G) Loans On Manufactured Home Dwelling (A B C & D)
Number
Average Value
Number
Average Value
Number
Average Value
Number
Average Value
Number
Average Value
Number
Average Value
Number
Average Value
LOANS ORIGINATED
152
$184,983
706
$156,176
1,175
$144,113
201
$78,566
23
$508,391
353
$160,377
2
$109,570
APPLICATIONS APPROVED, NOT ACCEPTED
30
$193,177
230
$169,719
295
$143,285
66
$35,834
2
$144,435
127
$156,431
0
$0
APPLICATIONS DENIED
39
$211,722
277
$167,549
1,050
$137,583
305
$50,615
10
$213,965
223
$158,362
2
$67,735
APPLICATIONS WITHDRAWN
63
$181,067
154
$162,957
703
$144,001
63
$93,597
8
$149,394
114
$174,654
0
$0
FILES CLOSED FOR INCOMPLETENESS
10
$202,069
71
$134,775
79
$142,930
2
$14,600
0
$0
24
$145,148
0
$0
Aggregated Statistics For Year 2003 (Based on 14 full and 2 partial tracts)
A) FHA, FSA/RHS & VA Home Purchase Loans
B) Conventional Home Purchase Loans
C) Refinancings
D) Home Improvement Loans
E) Loans on Dwellings For 5+ Families
F) Non-occupant Loans on < 5 Family Dwellings (A B C & D)
Number
Average Value
Number
Average Value
Number
Average Value
Number
Average Value
Number
Average Value
Number
Average Value
LOANS ORIGINATED
205
$157,803
436
$144,627
1,443
$123,495
116
$28,926
24
$578,418
266
$134,069
APPLICATIONS APPROVED, NOT ACCEPTED
31
$164,748
161
$137,969
425
$123,239
60
$28,474
4
$152,732
105
$127,580
APPLICATIONS DENIED
58
$171,080
198
$141,500
1,253
$119,129
168
$27,330
2
$457,755
137
$127,730
APPLICATIONS WITHDRAWN
57
$171,019
123
$148,240
689
$131,536
35
$38,258
8
$331,776
86
$147,524
FILES CLOSED FOR INCOMPLETENESS
10
$164,581
8
$96,742
97
$112,190
4
$44,725
0
$0
6
$103,308
Aggregated Statistics For Year 2002 (Based on 10 full and 2 partial tracts)
A) FHA, FSA/RHS & VA Home Purchase Loans
B) Conventional Home Purchase Loans
C) Refinancings
D) Home Improvement Loans
E) Loans on Dwellings For 5+ Families
F) Non-occupant Loans on < 5 Family Dwellings (A B C & D)
Number
Average Value
Number
Average Value
Number
Average Value
Number
Average Value
Number
Average Value
Number
Average Value
LOANS ORIGINATED
147
$135,977
227
$116,148
694
$114,117
130
$28,592
8
$372,068
121
$113,577
APPLICATIONS APPROVED, NOT ACCEPTED
14
$150,290
65
$117,556
269
$103,854
65
$24,607
2
$133,475
38
$107,734
APPLICATIONS DENIED
41
$141,560
126
$118,046
731
$98,703
198
$18,888
6
$173,848
72
$94,275
APPLICATIONS WITHDRAWN
24
$158,862
55
$112,585
442
$116,574
25
$35,114
0
$0
26
$100,608
FILES CLOSED FOR INCOMPLETENESS
2
$101,600
22
$118,821
73
$105,352
0
$0
0
$0
6
$124,762
Aggregated Statistics For Year 2001 (Based on 10 full and 2 partial tracts)
A) FHA, FSA/RHS & VA Home Purchase Loans
B) Conventional Home Purchase Loans
C) Refinancings
D) Home Improvement Loans
E) Loans on Dwellings For 5+ Families
F) Non-occupant Loans on < 5 Family Dwellings (A B C & D)
Number
Average Value
Number
Average Value
Number
Average Value
Number
Average Value
Number
Average Value
Number
Average Value
LOANS ORIGINATED
175
$129,450
205
$111,315
482
$103,147
112
$14,733
12
$153,415
104
$102,633
APPLICATIONS APPROVED, NOT ACCEPTED
20
$107,108
57
$107,398
195
$97,017
68
$31,874
0
$0
31
$108,679
APPLICATIONS DENIED
41
$139,416
113
$101,637
566
$84,490
243
$22,434
2
$149,415
51
$101,476
APPLICATIONS WITHDRAWN
31
$126,628
64
$110,694
332
$101,103
60
$20,504
4
$196,410
29
$126,845
FILES CLOSED FOR INCOMPLETENESS
6
$103,788
26
$81,644
117
$106,259
2
$29,885
0
$0
8
$74,434
Aggregated Statistics For Year 2000 (Based on 10 full and 2 partial tracts)
A) FHA, FSA/RHS & VA Home Purchase Loans
B) Conventional Home Purchase Loans
C) Refinancings
D) Home Improvement Loans
E) Loans on Dwellings For 5+ Families
F) Non-occupant Loans on < 5 Family Dwellings (A B C & D)
Number
Average Value
Number
Average Value
Number
Average Value
Number
Average Value
Number
Average Value
Number
Average Value
LOANS ORIGINATED
169
$118,200
164
$100,185
260
$85,391
126
$20,386
18
$304,832
48
$83,443
APPLICATIONS APPROVED, NOT ACCEPTED
12
$112,250
43
$98,420
173
$94,413
121
$20,963
0
$0
19
$100,113
APPLICATIONS DENIED
27
$125,522
173
$103,485
606
$83,386
231
$24,444
12
$248,090
66
$126,551
APPLICATIONS WITHDRAWN
30
$109,214
78
$97,413
241
$83,799
25
$19,963
0
$0
23
$84,602
FILES CLOSED FOR INCOMPLETENESS
6
$100,512
24
$100,437
127
$101,845
4
$33,320
0
$0
10
$87,745
Aggregated Statistics For Year 1999 (Based on 5 full and 2 partial tracts)
A) FHA, FSA/RHS & VA Home Purchase Loans
B) Conventional Home Purchase Loans
C) Refinancings
D) Home Improvement Loans
E) Loans on Dwellings For 5+ Families
F) Non-occupant Loans on < 5 Family Dwellings (A B C & D)
2003 - 2018 National Fire Incident Reporting System (NFIRS) incidents
Based on the data from the years 2003 - 2018 the average number of fire incidents per year is 432. The highest number of fire incidents - 1,415 took place in 2004, and the least - 98 in 2017. The data has a declining trend.
When looking into fire subcategories, the most reports belonged to: Structure Fires (49.0%), and Outside Fires (26.4%).
Fire incident types reported to NFIRS in Zip Code 07106


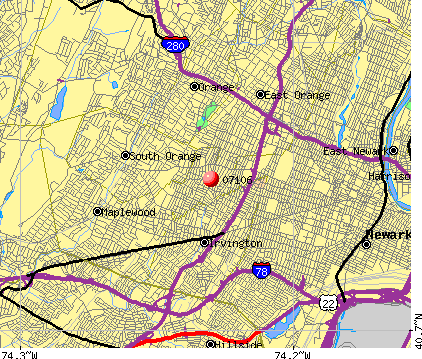 Nearest zip codes: 07111, 07018, 07050, 07079, 07103, 07108.


 Based on the data from the years 2003 - 2018 the average number of fire incidents per year is 432. The highest number of fire incidents - 1,415 took place in 2004, and the least - 98 in 2017. The data has a declining trend.
 When looking into fire subcategories, the most reports belonged to: Structure Fires (49.0%), and Outside Fires (26.4%).