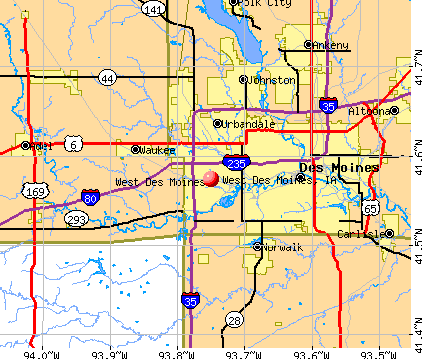
West Des Moines, Iowa
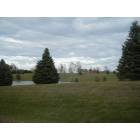
West Des Moines: Barn in the distance Oct. 01

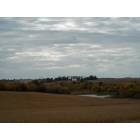
West Des Moines: Pond and rolling hills Oct. 01
West Des Moines: Pond and rolling hills Oct. 01
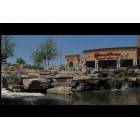
West Des Moines: Jordan Creek Town Center

West Des Moines: City Hall

West Des Moines: River with an old train bridge Oct. 01

West Des Moines: Aquatic Center

West Des Moines: Monument Sign
- add
your
Submit your own pictures of this city and show them to the world
- OSM Map
- General Map
- Google Map
- MSN Map
Population change since 2000: +52.4%
| Males: 32,897 | |
| Females: 37,844 |
| Median resident age: | 34.8 years |
| Iowa median age: | 38.9 years |
| West Des Moines: | $85,731 |
| IA: | $69,588 |
Estimated per capita income in 2022: $57,291 (it was $31,405 in 2000)
West Des Moines city income, earnings, and wages data
Estimated median house or condo value in 2022: $296,200 (it was $137,800 in 2000)
| West Des Moines: | $296,200 |
| IA: | $194,600 |
Mean prices in 2022: all housing units: $333,643; detached houses: $378,602; townhouses or other attached units: $226,180; in 2-unit structures: $261,943; in 3-to-4-unit structures: $94,589; in 5-or-more-unit structures: $162,477; mobile homes: $32,010
Median gross rent in 2022: $1,211.
West Des Moines, IA residents, houses, and apartments details
(6.1% for White Non-Hispanic residents, 15.4% for Black residents, 12.8% for Hispanic or Latino residents, 10.5% for American Indian residents, 9.3% for other race residents, 15.1% for two or more races residents)
Detailed information about poverty and poor residents in West Des Moines, IA


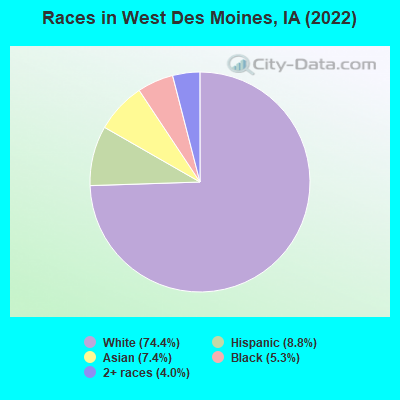
- 55,03574.4%White alone
- 6,5178.8%Hispanic
- 5,4937.4%Asian alone
- 3,8915.3%Black alone
- 2,9804.0%Two or more races
- 350.05%Other race alone
- 140.02%American Indian alone
Races in West Des Moines detailed stats: ancestries, foreign born residents, place of birth
According to our research of Iowa and other state lists, there were 59 registered sex offenders living in West Des Moines, Iowa as of May 31, 2024.
The ratio of all residents to sex offenders in West Des Moines is 1,078 to 1.
The ratio of registered sex offenders to all residents in this city is lower than the state average.
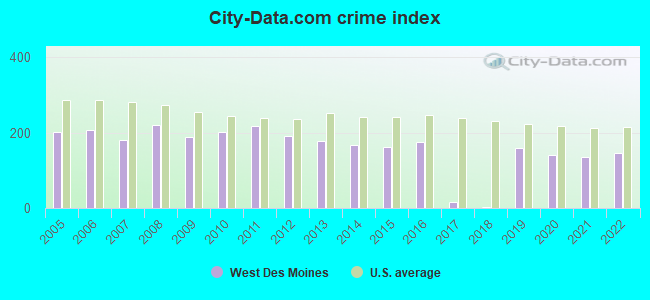
The City-Data.com crime index weighs serious crimes and violent crimes more heavily. Higher means more crime, U.S. average is 246.1. It adjusts for the number of visitors and daily workers commuting into cities.
- means the value is smaller than the state average.- means the value is about the same as the state average.
- means the value is bigger than the state average.
Crime rate in West Des Moines detailed stats: murders, rapes, robberies, assaults, burglaries, thefts, arson
Full-time law enforcement employees in 2021, including police officers: 101 (89 officers - 80 male; 9 female).
| Officers per 1,000 residents here: | 1.26 |
| Iowa average: | 1.76 |
 Recent articles from our blog. Our writers, many of them Ph.D. graduates or candidates, create easy-to-read articles on a wide variety of topics.

 | Moving to Des Moines/West Des Moines (1 reply) |
| Land purchased on cascade in west des moines by edgewater (2 replies) |
| Train noise in West Des Moines? (4 replies) |
| Retired and moving out of NJ , thinking of Ankeny (19 replies) |
| West Des Moines Dahls to Close (43 replies) |
| Nintendo Tecmo Bowl tournament @ Keg Stand in west Des Moines. 4/30/2016 (1 reply) |
Latest news from West Des Moines, IA collected exclusively by city-data.com from local newspapers, TV, and radio stations
Ancestries: German (19.8%), American (7.3%), Irish (6.2%), English (5.7%), Norwegian (5.4%), European (4.4%).
Current Local Time: CST time zone
Incorporated on 11/16/1893
Elevation: 820 feet
Land area: 26.8 square miles.
Population density: 2,641 people per square mile (average).
7,577 residents are foreign born (5.3% Asia, 2.1% Latin America, 1.7% Africa, 1.5% Europe).
| This city: | 10.9% |
| Iowa: | 5.6% |
Median real estate property taxes paid for housing units with mortgages in 2022: $4,493 (1.5%)
Median real estate property taxes paid for housing units with no mortgage in 2022: $4,627 (1.6%)
Nearest city with pop. 50,000+: Des Moines, IA  (6.8 miles , pop. 198,682).
Nearest city with pop. 200,000+: Omaha, NE (119.3 miles , pop. 390,007).
Nearest city with pop. 1,000,000+: Chicago, IL (314.0 miles , pop. 2,896,016).
Nearest cities:
), Latitude: 41.57 N, Longitude: 93.75 W
Daytime population change due to commuting: +14,883 (+20.1%)
Workers who live and work in this city: 19,639 (45.4%)
Area code commonly used in this area: 515
Property values in West Des Moines, IA

West Des Moines, Iowa accommodation & food services, waste management - Economy and Business Data
Single-family new house construction building permits:
- 2022: 443 buildings, average cost: $319,300
- 2021: 420 buildings, average cost: $319,200
- 2020: 438 buildings, average cost: $294,600
- 2019: 226 buildings, average cost: $327,600
- 2018: 293 buildings, average cost: $357,400
- 2017: 339 buildings, average cost: $315,400
- 2016: 249 buildings, average cost: $330,500
- 2015: 229 buildings, average cost: $306,900
- 2014: 241 buildings, average cost: $264,100
- 2013: 495 buildings, average cost: $237,500
- 2012: 298 buildings, average cost: $249,400
- 2011: 249 buildings, average cost: $231,700
- 2010: 255 buildings, average cost: $212,700
- 2009: 177 buildings, average cost: $226,400
- 2008: 199 buildings, average cost: $210,600
- 2007: 233 buildings, average cost: $223,900
- 2006: 148 buildings, average cost: $204,600
- 2005: 275 buildings, average cost: $171,700
- 2004: 394 buildings, average cost: $153,600
- 2003: 215 buildings, average cost: $209,800
- 2002: 318 buildings, average cost: $174,000
- 2001: 256 buildings, average cost: $186,000
- 2000: 301 buildings, average cost: $183,400
- 1999: 552 buildings, average cost: $146,700
- 1998: 577 buildings, average cost: $151,200
- 1997: 332 buildings, average cost: $167,600
| Here: | 2.1% |
| Iowa: | 2.7% |
Population change in the 1990s: +14,087 (+43.6%).
- Finance & insurance (19.5%)
- Professional, scientific, technical services (9.2%)
- Health care (8.4%)
- Educational services (6.8%)
- Accommodation & food services (4.5%)
- Public administration (4.1%)
- Construction (3.9%)
- Finance & insurance (16.7%)
- Professional, scientific, technical services (10.7%)
- Construction (6.9%)
- Public administration (5.2%)
- Accommodation & food services (4.9%)
- Health care (4.7%)
- Educational services (3.7%)
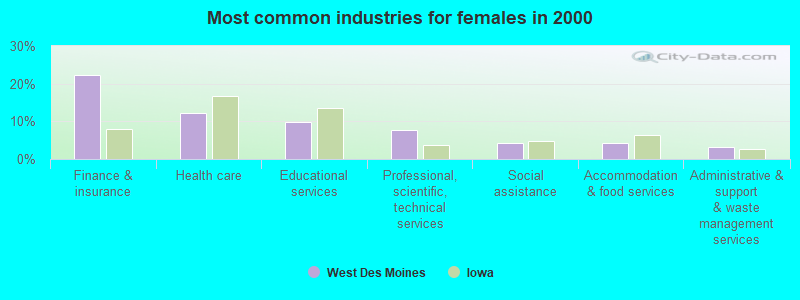
- Finance & insurance (22.4%)
- Health care (12.2%)
- Educational services (9.9%)
- Professional, scientific, technical services (7.6%)
- Social assistance (4.3%)
- Accommodation & food services (4.1%)
- Administrative & support & waste management services (3.2%)
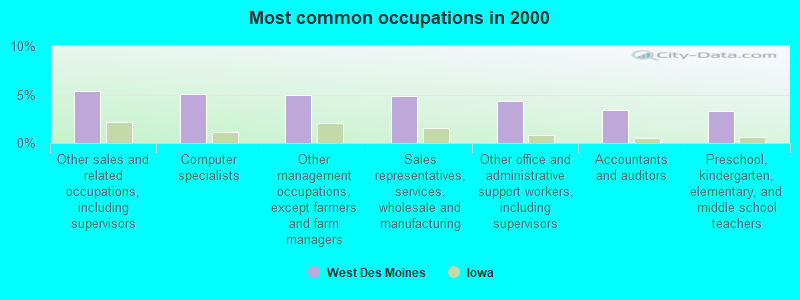
- Other sales and related occupations, including supervisors (5.4%)
- Computer specialists (5.1%)
- Other management occupations, except farmers and farm managers (4.9%)
- Sales representatives, services, wholesale and manufacturing (4.9%)
- Other office and administrative support workers, including supervisors (4.4%)
- Accountants and auditors (3.4%)
- Preschool, kindergarten, elementary, and middle school teachers (3.3%)
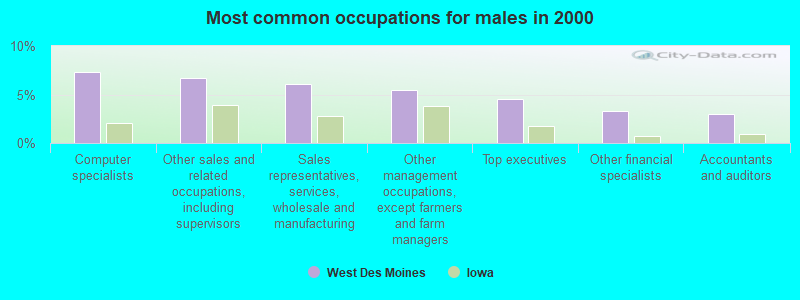
- Computer specialists (7.3%)
- Other sales and related occupations, including supervisors (6.7%)
- Sales representatives, services, wholesale and manufacturing (6.1%)
- Other management occupations, except farmers and farm managers (5.5%)
- Top executives (4.5%)
- Other financial specialists (3.3%)
- Accountants and auditors (3.0%)
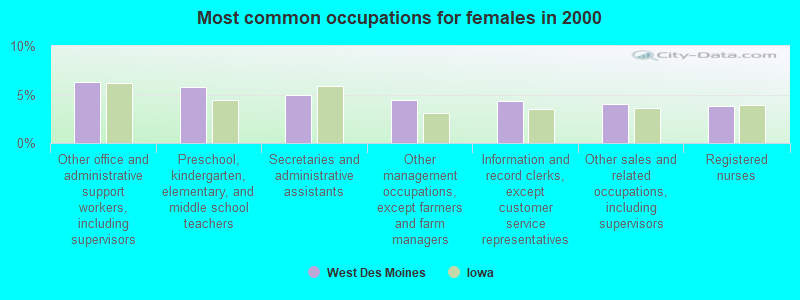
- Other office and administrative support workers, including supervisors (6.3%)
- Preschool, kindergarten, elementary, and middle school teachers (5.8%)
- Secretaries and administrative assistants (5.0%)
- Other management occupations, except farmers and farm managers (4.4%)
- Information and record clerks, except customer service representatives (4.4%)
- Other sales and related occupations, including supervisors (4.0%)
- Registered nurses (3.8%)
Average climate in West Des Moines, Iowa
Based on data reported by over 4,000 weather stations


|
|


(lower is better)
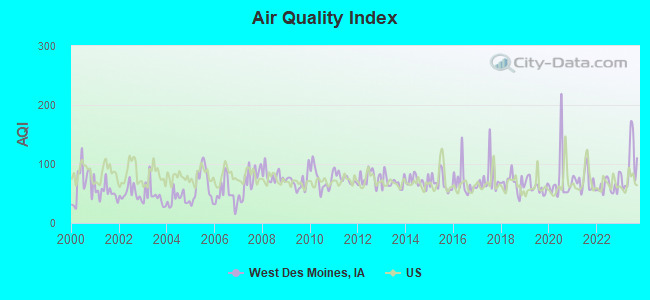
Air Quality Index (AQI) level in 2023 was 97.4. This is worse than average.
| City: | 97.4 |
| U.S.: | 72.6 |
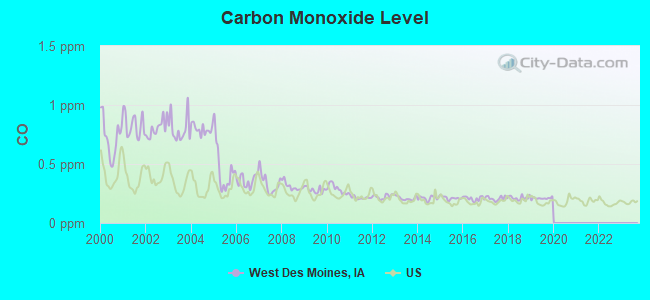
Carbon Monoxide (CO) [ppm] level in 2019 was 0.209. This is better than average. Closest monitor was 5.7 miles away from the city center.
| City: | 0.209 |
| U.S.: | 0.251 |
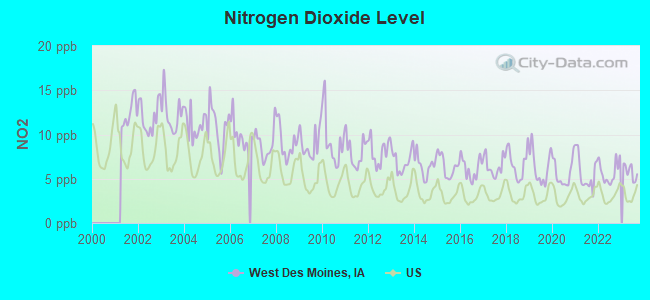
Nitrogen Dioxide (NO2) [ppb] level in 2023 was 5.78. This is about average. Closest monitor was 3.5 miles away from the city center.
| City: | 5.78 |
| U.S.: | 5.11 |
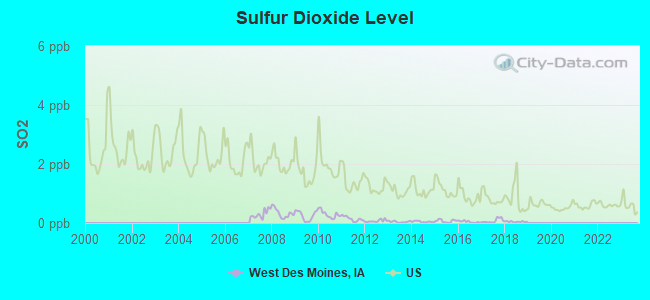
Sulfur Dioxide (SO2) [ppb] level in 2018 was 0.0417. This is significantly better than average. Closest monitor was 3.5 miles away from the city center.
| City: | 0.0417 |
| U.S.: | 1.5147 |
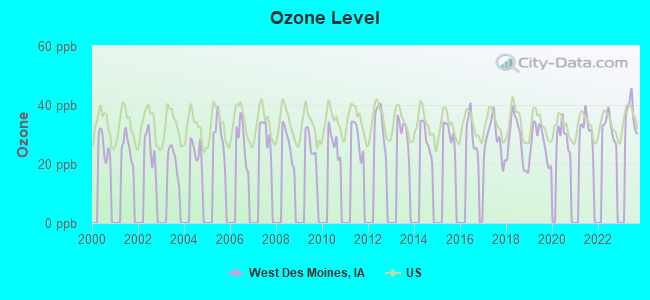
Ozone [ppb] level in 2023 was 36.8. This is about average. Closest monitor was 5.9 miles away from the city center.
| City: | 36.8 |
| U.S.: | 33.3 |
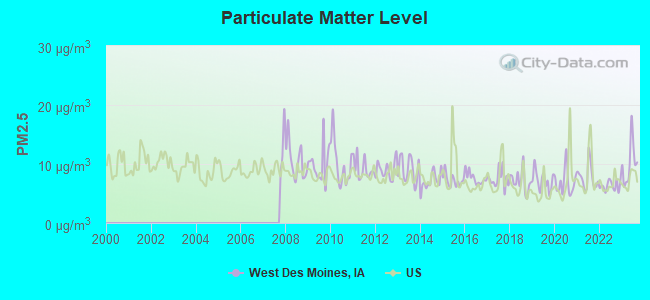
Particulate Matter (PM2.5) [µg/m3] level in 2023 was 10.1. This is worse than average. Closest monitor was 2.1 miles away from the city center.
| City: | 10.1 |
| U.S.: | 8.1 |
Tornado activity:
West Des Moines-area historical tornado activity is near Iowa state average. It is 106% greater than the overall U.S. average.
On 6/13/1976, a category F5 (max. wind speeds 261-318 mph) tornado 25.4 miles away from the West Des Moines city center injured 9 people and caused between $5,000,000 and $50,000,000 in damages.
On 6/18/1974, a category F4 (max. wind speeds 207-260 mph) tornado 12.0 miles away from the city center killed 2 people and injured 50 people and caused between $5,000,000 and $50,000,000 in damages.
Earthquake activity:
West Des Moines-area historical earthquake activity is significantly above Iowa state average. It is 222% greater than the overall U.S. average.On 9/3/2016 at 12:02:44, a magnitude 5.8 (5.8 MW, Depth: 3.5 mi, Class: Moderate, Intensity: VI - VII) earthquake occurred 394.9 miles away from West Des Moines center
On 4/18/2008 at 09:36:59, a magnitude 5.4 (5.1 MB, 4.8 MS, 5.4 MW, 5.2 MW) earthquake occurred 378.2 miles away from West Des Moines center
On 11/6/2011 at 03:53:10, a magnitude 5.7 (5.7 MW, Depth: 3.2 mi) earthquake occurred 448.5 miles away from the city center
On 4/18/2008 at 09:36:59, a magnitude 5.2 (5.2 MW, Depth: 8.9 mi) earthquake occurred 378.2 miles away from West Des Moines center
On 6/10/1987 at 23:48:54, a magnitude 5.1 (4.9 MB, 4.4 MS, 4.6 MS, 5.1 LG) earthquake occurred 363.6 miles away from the city center
On 7/9/1975 at 14:54:15, a magnitude 4.6 (4.6 MB, Class: Light, Intensity: IV - V) earthquake occurred 305.6 miles away from West Des Moines center
Magnitude types: regional Lg-wave magnitude (LG), body-wave magnitude (MB), surface-wave magnitude (MS), moment magnitude (MW)
Natural disasters:
The number of natural disasters in Polk County (17) is near the US average (15).Major Disasters (Presidential) Declared: 13
Emergencies Declared: 1
Causes of natural disasters: Floods: 12, Storms: 10, Tornadoes: 5, Heavy Rain: 1, Hurricane: 1, Snow: 1, Wind: 1, Winter Storm: 1, Other: 1 (Note: some incidents may be assigned to more than one category).

Main business address for: WEST BANCORPORATION INC (STATE COMMERCIAL BANKS), PACE HEALTH MANAGEMENT SYSTEMS INC (SERVICES-PREPACKAGED SOFTWARE), FBL FINANCIAL GROUP INC (LIFE INSURANCE), FCStone Group, Inc. ([6221]).
Hospitals in West Des Moines:
Nursing Homes in West Des Moines:
- ARBOR SPRINGS OF WEST DES MOINES L L C (7951 E P TRUE PARKWAY)
- EDGEWATER A WESLEY ACTIVE LIFE COMMUNITY LLC (9225 CASCADE)
- FOUNTAIN WEST HEALTH CENTER (1501 OFFICE PARK ROAD)
- MANORCARE HEALTH SERVICES -WEST DES MOINES (5010 GRAND RIDGE DRIVE)
- VALLEY JUNCTION NURSING AND REHAB CENTER (1211 VINE STREET)
Dialysis Facilities in West Des Moines:
Home Health Centers in West Des Moines:
College/University in West Des Moines:
Colleges/universities with over 2000 students nearest to West Des Moines:
- Drake University (about 6 miles; Des Moines, IA; Full-time enrollment: 3,768)
- Des Moines Area Community College (about 12 miles; Ankeny, IA; FT enrollment: 15,337)
- Iowa State University (about 32 miles; Ames, IA; FT enrollment: 28,662)
- Iowa Central Community College (about 68 miles; Fort Dodge, IA; FT enrollment: 4,682)
- Indian Hills Community College (about 80 miles; Ottumwa, IA; FT enrollment: 4,034)
- University of Northern Iowa (about 93 miles; Cedar Falls, IA; FT enrollment: 10,816)
- Hawkeye Community College (about 94 miles; Waterloo, IA; FT enrollment: 7,160)
Public high schools in West Des Moines:
- VALLEY SOUTHWOODS (Students: 655, Location: 625 S 35TH ST, Grades: 9)
- WALNUT CREEK CAMPUS (Students: 197, Location: 1020 8TH STREET, Grades: 9-12)
- VALLEY HIGH SCHOOL (Location: 3650 WOODLAND AVE, Grades: 10-12)
Private high schools in West Des Moines:
- DOWLING CATHOLIC HIGH SCHOOL (Students: 1,406, Location: 1400 BUFFALO RD, Grades: 9-12)
- IOWA CHRISTIAN ACADEMY (Students: 283, Location: 2501 VINE ST, Grades: PK-12)
Biggest public elementary/middle schools in West Des Moines:
- JORDAN CREEK ELEMENTARY SCHOOL (Students: 767, Location: 4105 FULLER RD, Grades: PK-6)
- WESTRIDGE ELEMENTARY (Students: 725, Location: 5500 E P TRUE PARKWAY, Grades: PK-6)
- STILWELL JUNIOR HIGH SCHOOL (Students: 711, Location: 1601 VINE ST, Grades: 7-8)
- BROOKVIEW ELEMENTARY (Students: 605, Location: 8000 E.P. TRUE PARKWAY, Grades: KG-5)
- HILLSIDE ELEMENTARY SCHOOL (Students: 574, Location: 713 8TH ST, Grades: KG-6)
- CROSSROADS PARK ELEMENTARY SCHOOL (Students: 529, Location: 1050 50TH ST, Grades: KG-6)
- FAIRMEADOWS ELEMENTARY SCHOOL (Students: 470, Location: 807 23RD ST, Grades: KG-6)
- WESTERN HILLS ELEMENTARY SCHOOL (Students: 392, Location: 600 39TH ST, Grades: PK-6)
- MAPLE GROVE ELEMENTARY (Location: 1455 98TH ST, Grades: PK-5)
- WOODLAND HILLS (Location: 1120 SOUTH 95TH STREET, Grades: PK-5)
Private elementary/middle schools in West Des Moines:
- ST FRANCIS OF ASSISI SCHOOL (Students: 669, Location: 7075 ASHWORTH RD, Grades: KG-8)
- SACRED HEART SCHOOL (Students: 499, Location: 1601 GRAND AVE, Grades: KG-8)
- SAYRE MONTESSORI SCHOOL (Students: 23, Location: 1700 28TH ST, Grades: PK-2)
Library in West Des Moines:
- WEST DES MOINES PUBLIC LIBRARY (Operating income: $2,237,928; Location: 4000 GEORGE M. MILLS CIVIC PARKWAY; 145,488 books; 8,126 audio materials; 9,152 video materials; 9 local licensed databases; 25 state licensed databases; 2 other licensed databases; 309 print serial subscriptions; 30 electronic serial subscriptions)
User-submitted facts and corrections:
- Private High School - Dowling Catholic 1400 Buffalo Rd West Des Moines, IA www.dowlingcatholic.org
Points of interest:
Notable locations in West Des Moines: Commerce (A), Glen Oaks Country Club (B), Des Moines Golf and Country Club (C), Willow Creek Golf Course (D), West Des Moines Fire Department Station 22 (E), West Des Moines Fire Department Station 17 (F), West Des Moines Fire Department Station 18 (G), West Des Moines Fire Department Station 21 (H), Jordan House (I), West Des Moines Police Department (J), West Des Moines Library (K), City of West Des Moines Emergency Medical Services Station 17 (L), City of West Des Moines Emergency Medical Services Station 21 (M), City of West Des Moines Emergency Medical Services Station 18 (N), Clive Fire Department Station 2 (O), West Des Moines City Hall (P), West Des Moines Fire Department Station 22 (Q). Display/hide their locations on the map
Shopping Centers: Valley West Mall (1), Westown Shopping Center (2). Display/hide their locations on the map
Main business address in West Des Moines include: WEST BANCORPORATION INC (A), PACE HEALTH MANAGEMENT SYSTEMS INC (B), FBL FINANCIAL GROUP INC (C), FCStone Group, Inc. (D). Display/hide their locations on the map
Churches in West Des Moines include: Saint Mark Lutheran Church (A), Grace West Church (B), Saint Francis of Assisi Church (C), West Des Moines Christian Church (D), Covenant Presbyterian Church (E), West Des Moines Calvary Baptist Church (F), Beautiful Savior Lutheran Church (G), Commerce Community Church (H), Point of Grace Church (I). Display/hide their locations on the map
Cemeteries: Resthaven Cemetery (1), Jordan Cemetery (2). Display/hide their locations on the map
Creek: Jordan Creek (A). Display/hide its location on the map
Parks in West Des Moines include: Beh Glen Park (1), Fairmeadows Park (2), Jordan Creek Park (3), Southwood Park (4), Kiwanis Park (5), Florer Park (6), Meadow View Park (7), Jaycee Park (8), Crossroads Park (9). Display/hide their locations on the map
Tourist attractions: Bennett School (Museums; 2001 Fuller Road) (1), Jordan House Museum (2001 Fuller Road) (2), Family Fun Center (Amusement & Theme Parks; 313 Grand Avenue) (3), Checker Flag Lightning (Amusement & Theme Parks; Jordan Creek Mall) (4), Over The Moon Inflatables (Arcades & Amusements; 729 42nd Street) (5). Display/hide their approximate locations on the map
Hotels: Studio Plus - Des Moines West (2701 Westown Pkwy) (1), Holiday Inn West Des Moines (1800 50th Street) (2), Holiday Inn (1800 50th St) (3), Wingate Inn (7225 Vista Drive) (4), Marriott West Des Moines (1250 Jordan Creek Parkway) (5), Residence Inn (160 Jordan Creek Parkway) (6), Hawthorn Suites Ltd.- West Des Moines (6905 Lake Dr) (7), Candlewood Suites (7625 Office Plaza Dr North) (8), Holiday Inn Des Moines-West-I-80 & I-35- (1800 50th St) (9). Display/hide their approximate locations on the map
Court: United States Government - Federal Bureau Of Investigation- Des Moines Resident Ag (3737 Woodland Avenue Suite 601) (1). Display/hide its approximate location on the map
Birthplace of: Jared Clauss - 2005 NFL player (Tennessee Titans, born: Apr 7, 1981), Peter Hedges - Novelist.
Drinking water stations with addresses in West Des Moines and their reported violations in the past:
KUM & GO 498 (Serves MO, Population served: 1,600, Groundwater):Past health violations:EGAN CREST (Serves ND, Population served: 36, Groundwater):Past monitoring violations:
- MCL, Monthly (TCR) - In OCT-2010, Contaminant: Coliform. Follow-up actions: St Public Notif requested (NOV-03-2010), St Violation/Reminder Notice (NOV-03-2010), St Public Notif received (NOV-16-2010), St Compliance achieved (AUG-12-2011)
- 4 routine major monitoring violations
- One minor monitoring violation
- One regular monitoring violation
Past health violations:Past monitoring violations:
- MCL, Monthly (TCR) - Between JUL-2013 and SEP-2013, Contaminant: Coliform. Follow-up actions: St Public Notif requested (SEP-26-2013), St Violation/Reminder Notice (SEP-26-2013), St Public Notif received (SEP-30-2013), St Compliance achieved (MAR-06-2014)
- 3 routine major monitoring violations
| This city: | 2.3 people |
| Iowa: | 2.4 people |
| This city: | 58.4% |
| Whole state: | 64.7% |
| This city: | 6.9% |
| Whole state: | 6.7% |
Likely homosexual households (counted as self-reported same-sex unmarried-partner households)
- Lesbian couples: 0.3% of all households
- Gay men: 0.3% of all households
People in group quarters in West Des Moines in 2010:
- 262 people in nursing facilities/skilled-nursing facilities
- 8 people in group homes intended for adults
- 3 people in other noninstitutional facilities
People in group quarters in West Des Moines in 2000:
- 214 people in nursing homes
- 30 people in other nonhousehold living situations
- 24 people in other noninstitutional group quarters
- 14 people in other group homes
- 8 people in homes for the mentally retarded
- 6 people in hospitals/wards and hospices for chronically ill
- 6 people in hospices or homes for chronically ill
- 3 people in religious group quarters
Banks with most branches in West Des Moines (2011 data):
- West Bank: Grand Avenue Branch, Mobile Branch, at 1601 22nd Street. Info updated 2006/11/03: Bank assets: $1,256.9 mil, Deposits: $959.3 mil, local headquarters, positive income, Commercial Lending Specialization, 12 total offices, Holding Company: West Bancorporation, Inc.
- Midwest Heritage Bank, FSB: South 52st Street Branch, Midwest Heritage Bank, Fsb, 74th Street Branch. Info updated 2011/07/21: Bank assets: $154.4 mil, Deposits: $128.8 mil, local headquarters, positive income, 9 total offices
- Two Rivers Bank & Trust: Two Rivers Bank And Trust Branch at 4500 Westown Parkway, branch established on 2009/07/01; 4320 Westown Parkway Branch at 4320 Westown Parkway Ste 100, branch established on 2008/05/02. Info updated 2010/07/26: Bank assets: $668.0 mil, Deposits: $455.8 mil, headquarters in Burlington, IA, positive income, Commercial Lending Specialization, 12 total offices, Holding Company: Two Rivers Financial Group, Inc.
- Liberty Bank, F.S.B.: Liberty Bank, F.S.b. at 6139 Ashworth Road, branch established on 1972/01/06; Mills Civic Branch at 5070 Mills Civic Parkway, branch established on 2004/12/27. Info updated 2011/07/21: Bank assets: $934.1 mil, Deposits: $843.6 mil, local headquarters, negative income in the last year, Commercial Lending Specialization, 27 total offices
- Bank of the West: Civic at 4885 Mills Civic Parkway, branch established on 1993/11/29; Jordan Creek at 7465 Ashworth Rd, branch established on 1992/03/01. Info updated 2009/11/16: Bank assets: $62,408.3 mil, Deposits: $43,995.2 mil, headquarters in San Francisco, CA, positive income, 647 total offices, Holding Company: Bnp Paribas
- U.S. Bank National Association: Des Moines Westown Branch at 3738 Westown Parkway, branch established on 1980/10/13; Des Moines Ep True Branch at 225 50th Street, branch established on 1994/10/24. Info updated 2012/01/30: Bank assets: $330,470.8 mil, Deposits: $236,091.5 mil, headquarters in Cincinnati, OH, positive income, 3121 total offices, Holding Company: U.S. Bancorp
- First Bank: Fifth Street Branch at 301 Fifth Street, branch established on 1972/03/06; at 5625 Mills Civic Parkway, branch established on 1901/07/08. Info updated 2009/10/13: Bank assets: $93.4 mil, Deposits: $84.1 mil, local headquarters, positive income, Commercial Lending Specialization, 3 total offices, Holding Company: Fnb Holding Company
- Great Southern Bank: Jordan Creek Office at 6260 Mills Civic Parkway, branch established on 2007/09/04; Westown Parkway Branch at 3900 Westown Parkway, branch established on 1997/09/08. Info updated 2012/02/03: Bank assets: $3,788.7 mil, Deposits: $2,986.3 mil, headquarters in Reeds Spring, MO, positive income, Commercial Lending Specialization, 109 total offices, Holding Company: Great Southern Bancorp, Inc.
- MetaBank: West Des Moines, S 68th Street Branch at 270 S 68th St, branch established on 2006/10/15; Westtown Branch at 3448 Westtown Parkway, branch established on 1997/03/01. Info updated 2011/07/21: Bank assets: $1,358.3 mil, Deposits: $1,225.7 mil, headquarters in Storm Lake, IA, positive income, Mortgage Lending Specialization, 12 total offices
- 13 other banks with 13 local branches
For population 15 years and over in West Des Moines:
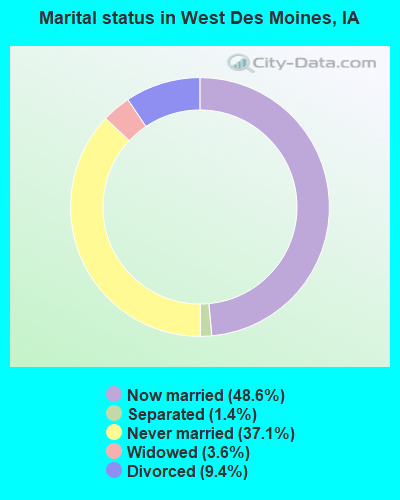
- Never married: 37.1%
- Now married: 48.6%
- Separated: 1.4%
- Widowed: 3.6%
- Divorced: 9.4%
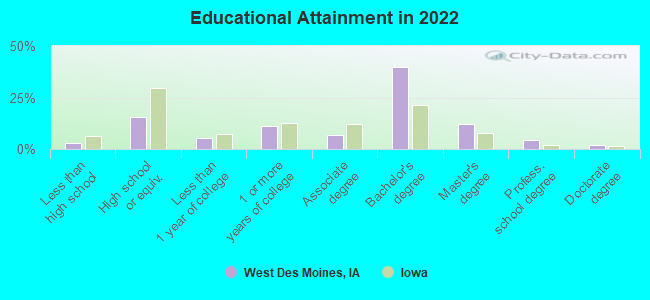
For population 25 years and over in West Des Moines:
- High school or higher: 96.9%
- Bachelor's degree or higher: 58.3%
- Graduate or professional degree: 18.6%
- Unemployed: 1.7%
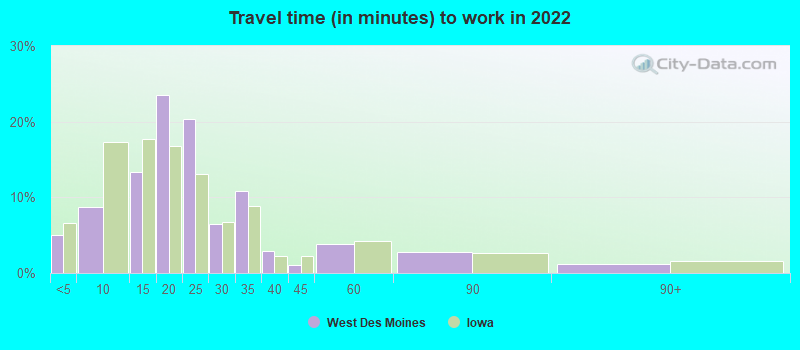
- Mean travel time to work (commute): 15.1 minutes
| Here: | 9.3 |
| Iowa average: | 10.5 |
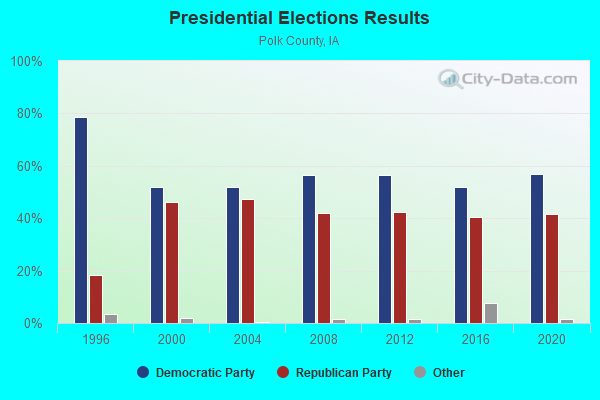
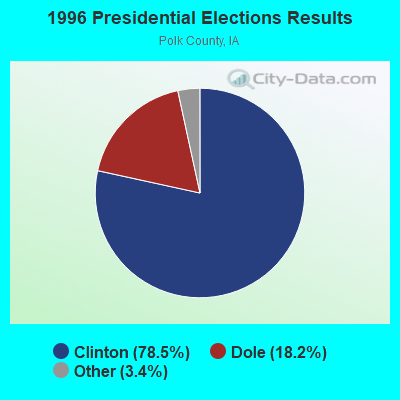


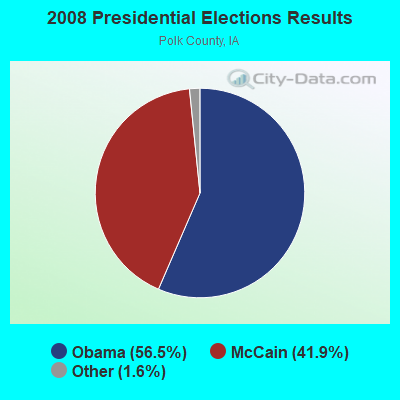


Graphs represent county-level data. Detailed 2008 Election Results
Political contributions by individuals in West Des Moines, IA
Neighborhoods in West Des Moines:
(West Des Moines, Iowa Neighborhood Map)- Ashawa Estates neighborhood
- Ashworth Estates neighborhood
- Ashworth Hills neighborhood
- Barrington Estates neighborhood
- Beverly Hills neighborhood
- Blue Creek neighborhood
- Bonnie-Lea Acres neighborhood
- Civic Estates neighborhood
- Clover Hills neighborhood
- Colby's Office Park neighborhood
- Colonial Heights neighborhood
- Colonial Village neighborhood
- Country Club Estates neighborhood
- Country Side neighborhood
- Crown Flair neighborhood
- Glen Oaks neighborhood
- Golf Country Club neighborhood
- Grand Oaks neighborhood
- Grand Woods neighborhood
- Heatherwood neighborhood
- Hickory Ridge neighborhood
- Hidden Creek neighborhood
- Jordan Glen neighborhood
- Jordan Grove neighborhood
- Jordan Park neighborhood
- Jordan Pointe neighborhood
- Maplenol Heights neighborhood
- Maryland Heights neighborhood
- Maryland Triangle neighborhood
- Meadow Brook neighborhood
- Meadow Point neighborhood
- Meadow Vista neighborhood
- Mountain Place neighborhood
- Murrow Hill neighborhood
- Murrowdale neighborhood
- Nuttall Acres neighborhood
- Parkhaven neighborhood
- Pine Grove neighborhood
- Ponderosa neighborhood
- Ponderosa Valley neighborhood
- Quail Cove neighborhood
- Quail Meadows neighborhood
- Quail Park neighborhood
- Quail Vista neighborhood
- Ridgeway neighborhood
- Robel Heights neighborhood
- Scenic neighborhood
- Southwoods neighborhood
- Stuart To the City of West Des Moines neighborhood
- Sun Prairie neighborhood
- The Knolls neighborhood
- The Oaks at 35th neighborhood
- Thornwood neighborhood
- Three Fountains neighborhood
- Turnberry neighborhood
- Valley Junction neighborhood
- West Des Moines Heights neighborhood
- West Glen neighborhood
- West Park neighborhood
- Western Hills Plat neighborhood
- Westernwoods neighborhood
- Westgate neighborhood
- Westown neighborhood
- Westridge neighborhood
- Willow Crest neighborhood
- Wirtz Park neighborhood
- Wistful Vista neighborhood
- Woodland Heights neighborhood
- Woodland Park neighborhood
- Zelda Acres neighborhood
Religion statistics for West Des Moines, IA (based on Polk County data)
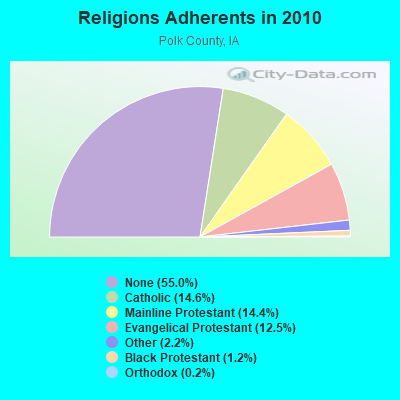
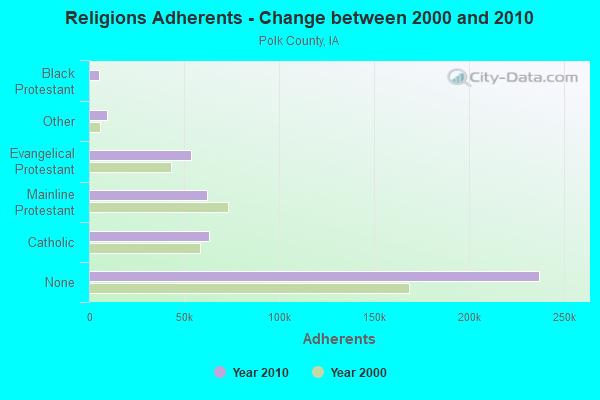
| Religion | Adherents | Congregations |
|---|---|---|
| Catholic | 62,867 | 19 |
| Mainline Protestant | 61,821 | 117 |
| Evangelical Protestant | 53,822 | 208 |
| Other | 9,331 | 35 |
| Black Protestant | 5,275 | 19 |
| Orthodox | 646 | 4 |
| None | 236,878 | - |
Food Environment Statistics:
| Here: | 1.51 / 10,000 pop. |
| Iowa: | 2.14 / 10,000 pop. |
| Polk County: | 0.17 / 10,000 pop. |
| State: | 0.23 / 10,000 pop. |
| Polk County: | 0.19 / 10,000 pop. |
| Iowa: | 0.43 / 10,000 pop. |
| Polk County: | 3.78 / 10,000 pop. |
| Iowa: | 5.55 / 10,000 pop. |
| This county: | 7.57 / 10,000 pop. |
| Iowa: | 8.01 / 10,000 pop. |
| Polk County: | 7.3% |
| Iowa: | 7.8% |
| Polk County: | 25.8% |
| State: | 27.3% |
| This county: | 13.5% |
| Iowa: | 14.5% |
Health and Nutrition:
| Here: | 49.7% |
| Iowa: | 49.5% |
| West Des Moines: | 47.1% |
| Iowa: | 46.1% |
| Here: | 28.4 |
| Iowa: | 28.6 |
| West Des Moines: | 21.0% |
| Iowa: | 21.4% |
| West Des Moines: | 10.0% |
| Iowa: | 10.4% |
| West Des Moines: | 6.8 |
| Iowa: | 6.8 |
| West Des Moines: | 32.1% |
| State: | 33.8% |
| Here: | 57.7% |
| State: | 55.9% |
| This city: | 80.2% |
| Iowa: | 77.7% |
More about Health and Nutrition of West Des Moines, IA Residents
| Local government employment and payroll (March 2022) | |||||
| Function | Full-time employees | Monthly full-time payroll | Average yearly full-time wage | Part-time employees | Monthly part-time payroll |
|---|---|---|---|---|---|
| Police Protection - Officers | 90 | $655,002 | $87,334 | 0 | $0 |
| Streets and Highways | 75 | $528,869 | $84,619 | 8 | $12,045 |
| Firefighters | 68 | $516,853 | $91,209 | 6 | $4,015 |
| Health | 58 | $356,019 | $73,659 | 4 | $13,373 |
| Other and Unallocable | 43 | $282,891 | $78,946 | 3 | $3,842 |
| Financial Administration | 23 | $201,218 | $104,983 | 0 | $0 |
| Local Libraries | 21 | $135,535 | $77,449 | 36 | $54,143 |
| Parks and Recreation | 21 | $167,153 | $95,516 | 64 | $65,031 |
| Housing and Community Development (Local) | 17 | $141,435 | $99,836 | 3 | $4,308 |
| Other Government Administration | 15 | $133,488 | $106,790 | 7 | $6,699 |
| Police - Other | 11 | $80,240 | $87,535 | 3 | $6,852 |
| Sewerage | 10 | $60,644 | $72,773 | 0 | $0 |
| Welfare | 8 | $47,706 | $71,559 | 0 | $0 |
| Natural Resources | 5 | $29,452 | $70,685 | 1 | $1,291 |
| Judicial and Legal | 5 | $46,805 | $112,332 | 0 | $0 |
| Solid Waste Management | 3 | $17,367 | $69,468 | 0 | $0 |
| Fire - Other | 3 | $30,041 | $120,164 | 1 | $3,284 |
| Totals for Government | 476 | $3,430,717 | $86,489 | 136 | $174,884 |
West Des Moines government finances - Expenditure in 2021 (per resident):
- Construction - Water Utilities: $4,305,000 ($60.86)
Sewerage: $1,317,000 ($18.62)
- Current Operations - General - Other: $15,865,000 ($224.27)
Police Protection: $13,916,000 ($196.72)
Sewerage: $11,763,000 ($166.28)
Local Fire Protection: $10,695,000 ($151.19)
Regular Highways: $9,568,000 ($135.25)
Water Utilities: $9,110,000 ($128.78)
Health - Other: $6,702,000 ($94.74)
Parks and Recreation: $6,589,000 ($93.14)
Libraries: $3,474,000 ($49.11)
Central Staff Services: $2,441,000 ($34.51)
Solid Waste Management: $2,430,000 ($34.35)
Financial Administration: $1,392,000 ($19.68)
Protective Inspection and Regulation - Other: $1,242,000 ($17.56)
Housing and Community Development: $1,211,000 ($17.12)
Public Welfare - Other: $1,038,000 ($14.67)
Judicial and Legal Services: $769,000 ($10.87)
General Public Buildings: $354,000 ($5.00)
Natural Resources - Other: $39,000 ($0.55)
Miscellaneous Commercial Activities - Other: $15,000 ($0.21)
- General - Interest on Debt: $8,097,000 ($114.46)
- Intergovernmental to Local - Other - Sewerage: $5,834,000 ($82.47)
Other - General - Other: $438,000 ($6.19)
- Intergovernmental to State - Regular Highways: $172,000 ($2.43)
General - Other: $41,000 ($0.58)
- Other Capital Outlay - General - Other: $40,429,000 ($571.51)
Sewerage: $1,528,000 ($21.60)
- Total Salaries and Wages: $42,781,000 ($604.76)
- Water Utilities - Interest on Debt: $243,000 ($3.44)
West Des Moines government finances - Revenue in 2021 (per resident):
- Charges - Sewerage: $16,152,000 ($228.33)
Other: $5,689,000 ($80.42)
Solid Waste Management: $2,278,000 ($32.20)
Parks and Recreation: $1,356,000 ($19.17)
Housing and Community Development: $1,238,000 ($17.50)
Regular Highways: $197,000 ($2.78)
Miscellaneous Commercial Activities: $30,000 ($0.42)
- Federal Intergovernmental - Other: $5,948,000 ($84.08)
Housing and Community Development: $983,000 ($13.90)
- Local Intergovernmental - Other: $7,704,000 ($108.90)
- Miscellaneous - General Revenue - Other: $10,810,000 ($152.81)
Interest Earnings: $1,439,000 ($20.34)
Fines and Forfeits: $261,000 ($3.69)
Sale of Property: $196,000 ($2.77)
Rents: $48,000 ($0.68)
Special Assessments: $19,000 ($0.27)
- Revenue - Water Utilities: $16,495,000 ($233.17)
- State Intergovernmental - Highways: $9,573,000 ($135.32)
General Local Government Support: $3,092,000 ($43.71)
Other: $1,074,000 ($15.18)
- Tax - Property: $80,048,000 ($1131.56)
General Sales and Gross Receipts: $9,438,000 ($133.42)
Other License: $4,486,000 ($63.41)
Other Selective Sales: $2,744,000 ($38.79)
Public Utilities Sales: $781,000 ($11.04)
West Des Moines government finances - Debt in 2021 (per resident):
- Long Term Debt - Outstanding Unspecified Public Purpose: $238,495,000 ($3371.38)
Beginning Outstanding - Unspecified Public Purpose: $216,020,000 ($3053.67)
Issue, Unspecified Public Purpose: $51,210,000 ($723.91)
Retired Unspecified Public Purpose: $28,734,000 ($406.19)
West Des Moines government finances - Cash and Securities in 2021 (per resident):
- Bond Funds - Cash and Securities: $34,784,000 ($491.71)
- Other Funds - Cash and Securities: $142,732,000 ($2017.67)
| Businesses in West Des Moines, IA | ||||
| Name | Count | Name | Count | |
|---|---|---|---|---|
| ALDO | 1 | LensCrafters | 2 | |
| AT&T | 2 | Little Caesars Pizza | 1 | |
| Ace Hardware | 1 | Long John Silver's | 1 | |
| Aeropostale | 1 | Lowe's | 2 | |
| American Eagle Outfitters | 2 | Marriott | 4 | |
| Ann Taylor | 1 | Marshalls | 1 | |
| Apple Store | 1 | Maurices | 2 | |
| Applebee's | 1 | McDonald's | 2 | |
| Arby's | 2 | Men's Wearhouse | 2 | |
| Banana Republic | 2 | Motel 6 | 1 | |
| Barnes & Noble | 2 | Motherhood Maternity | 2 | |
| Bath & Body Works | 2 | New Balance | 4 | |
| Bed Bath & Beyond | 1 | New York & Co | 1 | |
| Blockbuster | 2 | Nike | 15 | |
| Brooks Brothers | 1 | Office Depot | 1 | |
| Brookstone | 1 | OfficeMax | 2 | |
| Burger King | 2 | Old Navy | 1 | |
| Cache | 1 | Olive Garden | 1 | |
| Caribou Coffee | 1 | On The Border | 1 | |
| Carson Pirie Scott | 2 | Pac Sun | 1 | |
| Charlotte Russe | 1 | Panera Bread | 3 | |
| Chick-Fil-A | 1 | Papa John's Pizza | 1 | |
| Chico's | 1 | Payless | 2 | |
| Chipotle | 1 | Pizza Hut | 1 | |
| Chuck E. Cheese's | 1 | Plato's Closet | 1 | |
| Clarks | 1 | Pottery Barn | 1 | |
| Cold Stone Creamery | 1 | Pottery Barn Kids | 1 | |
| Coldwater Creek | 1 | Quiznos | 3 | |
| Costco | 1 | RadioShack | 2 | |
| Curves | 1 | Red Lobster | 1 | |
| DHL | 3 | Red Robin | 1 | |
| Dairy Queen | 4 | Rue21 | 1 | |
| Days Inn | 1 | Sephora | 1 | |
| Domino's Pizza | 1 | Sheraton | 1 | |
| Eddie Bauer | 1 | Soma Intimates | 1 | |
| Express | 2 | Spencer Gifts | 1 | |
| Famous Footwear | 3 | Sprint Nextel | 4 | |
| FedEx | 23 | Starbucks | 5 | |
| Foot Locker | 1 | Studio Plus Deluxe Studios | 1 | |
| Forever 21 | 2 | Subway | 7 | |
| GameStop | 2 | T-Mobile | 5 | |
| Gap | 3 | T.G.I. Driday's | 1 | |
| Gymboree | 1 | Taco Bell | 2 | |
| H&R Block | 5 | Talbots | 1 | |
| Hilton | 1 | Target | 2 | |
| Holiday Inn | 3 | The Limited | 1 | |
| Home Depot | 1 | Trader Joe's | 1 | |
| Hot Topic | 1 | True Value | 1 | |
| J. Jill | 1 | U.S. Cellular | 3 | |
| J.Crew | 1 | UPS | 40 | |
| Jimmy John's | 3 | Vans | 2 | |
| JoS. A. Bank | 1 | Verizon Wireless | 2 | |
| Jones New York | 6 | Victoria's Secret | 2 | |
| Journeys | 2 | Village Inn | 1 | |
| Justice | 2 | Walgreens | 3 | |
| Kohl's | 1 | Walmart | 1 | |
| Lane Bryant | 2 | |||
Strongest AM radio stations in West Des Moines:
- WHO (1040 AM; 50 kW; DES MOINES, IA; Owner: CITICASTERS LICENSES, L.P.)
- KRNT (1350 AM; 5 kW; DES MOINES, IA; Owner: SAGA COMMUNICATIONS OF IOWA, LLC)
- KBGG (1700 AM; 10 kW; DES MOINES, IA; Owner: CITADEL BROADCASTING COMPANY)
- KPSZ (940 AM; 10 kW; DES MOINES, IA; Owner: SAGA COMMUNICATIONS OF IOWA, LLC)
- KXNO (1460 AM; 5 kW; DES MOINES, IA; Owner: CAPSTAR TX LIMITED PARTNERSHIP)
- KWKY (1150 AM; 1 kW; DES MOINES, IA; Owner: PUTBRESE COMMUNICATIONS, LTD.)
- WOI (640 AM; 5 kW; AMES, IA; Owner: IOWA STATE UNIV., OF SCIENCE & TECH.)
- KXEL (1540 AM; 50 kW; WATERLOO, IA; Owner: KXEL BROADCASTING COMPANY, INC.)
- KFGQ (1260 AM; 5 kW; BOONE, IA; Owner: BOONE BIBLICAL MINISTRIES, INC.)
- KOIL (1020 AM; 50 kW; PLATTSMOUTH, NE; Owner: WAITT RADIO, INC.)
- KFAB (1110 AM; 50 kW; OMAHA, NE; Owner: CAPSTAR TX LIMITED PARTNERSHIP)
- KKAR (1290 AM; 50 kW; OMAHA, NE; Owner: WAITT RADIO, INC.)
- KXLQ (1490 AM; 1 kW; INDIANOLA, IA; Owner: WARREN BROADCASTING, INC.)
Strongest FM radio stations in West Des Moines:
- KWDM (88.7 FM; WEST DES MOINES, IA; Owner: W. DES MOINES COMM. SCHOOL DISTRICT)
- KIOA (93.3 FM; DES MOINES, IA; Owner: SAGA COMMUNICATIONS OF IOWA, LLC)
- KJJY (92.5 FM; WEST DES MOINES, IA; Owner: CITADEL BROADCASTING COMPANY)
- KHKI (97.3 FM; DES MOINES, IA; Owner: CITADEL BROADCASTING COMPANY)
- KMXD (100.3 FM; DES MOINES, IA; Owner: CITICASTERS LICENSES, L.P.)
- WOI-FM (90.1 FM; AMES, IA; Owner: IOWA STATE UNIVERSITY OF SCI & TECH)
- K269EJ (101.7 FM; DES MOINES, IA; Owner: UNIVERSITY OF NORTHERN IOWA)
- KSTZ (102.5 FM; DES MOINES, IA; Owner: SAGA COMMUNICATIONS OF IOWA, LLC)
- KGGO (94.9 FM; DES MOINES, IA; Owner: CITADEL BROADCASTING COMPANY)
- KJMC (89.3 FM; DES MOINES, IA; Owner: MINORITY COMMUNICATIONS, INC.)
- KAZR (103.3 FM; PELLA, IA; Owner: SAGA COMMUNICATIONS OF IOWA, LLC)
- KDFR (91.3 FM; DES MOINES, IA; Owner: FAMILY STATIONS, INC.)
- KLTI-FM (104.1 FM; AMES, IA; Owner: SAGA COMMUNICATIONS OF IOWA, LLC)
- KVJZ (106.3 FM; ANKENY, IA; Owner: CITICASTERS LICENSES, L.P.)
- KRKQ (98.3 FM; BOONE, IA; Owner: CITADEL BROADCASTING COMPANY)
- KKDM (107.5 FM; DES MOINES, IA; Owner: CLEAR CHANNEL BROADCASTING LICENSES, INC.)
- KZZQ (99.5 FM; WINTERSET, IA; Owner: POSITIVE IMPACT MEDIA, INC.)
- KLRX (96.1 FM; MADRID, IA; Owner: THOMAS H. BURKE, RECEIVER FOR LIFESTYLE COMMUNICATIONS CORP.)
- KKRF (107.9 FM; STUART, IA; Owner: COON VALLEY COMMUNICATIONS, INC.)
- KDLS-FM (105.5 FM; PERRY, IA; Owner: PERRY BROADCASTING COMPANY)
TV broadcast stations around West Des Moines:
- WBXF-CA (Channel 4; DES MOINES, IA; Owner: THE BOX WORLDWIDE LLC)
- WOI-TV (Channel 5; AMES, IA; Owner: CAPITAL COMMUNICATIONS COMPANY, INC.)
- KDIN-TV (Channel 11; DES MOINES, IA; Owner: IOWA PUBLIC BROADCASTING BOARD)
- KPWB-TV (Channel 23; AMES, IA; Owner: PAPPAS TELECASTING OF IOWA, L.L.C.)
- KDSM-TV (Channel 17; DES MOINES, IA; Owner: KDSM LICENSEE, LLC)
- KCCI (Channel 8; DES MOINES, IA; Owner: DES MOINES HEARST-ARGYLE TV, INC.)
- K41DD (Channel 41; DES MOINES, IA; Owner: VENTANA TELEVISION, INC.)
- WHO-TV (Channel 13; DES MOINES, IA; Owner: NEW YORK TIMES MANAGEMENT SERVICES)
- KRPG-LP (Channel 43; DES MOINES, IA; Owner: TIGER EYE BROADCASTING CORPORATION)
- K29EA (Channel 29; DES MOINES, IA; Owner: TV-45, INC.)
- K46EY (Channel 46; DES MOINES, IA; Owner: TV-45, INC.)
- K56GD (Channel 56; AMES, IA; Owner: TV-45, INC.)
- K48FZ (Channel 48; AMES, IA; Owner: TV-52, INC.)
- National Bridge Inventory (NBI) Statistics
- 124Number of bridges
- 1,811ft / 552mTotal length
- 1,863,190Total average daily traffic
- 192,145Total average daily truck traffic
- New bridges - historical statistics
- 31930-1939
- 21950-1959
- 221960-1969
- 41970-1979
- 51980-1989
- 211990-1999
- 402000-2009
- 272010-2019
FCC Registered Antenna Towers: 34 (See the full list of FCC Registered Antenna Towers)
FCC Registered Commercial Land Mobile Towers: 2 (See the full list of FCC Registered Commercial Land Mobile Towers in West Des Moines, IA)
FCC Registered Private Land Mobile Towers: 6 (See the full list of FCC Registered Private Land Mobile Towers)
FCC Registered Broadcast Land Mobile Towers: 44 (See the full list of FCC Registered Broadcast Land Mobile Towers)
FCC Registered Microwave Towers: 40 (See the full list of FCC Registered Microwave Towers in this town)
FCC Registered Paging Towers: 2 (See the full list of FCC Registered Paging Towers)
FCC Registered Amateur Radio Licenses: 191 (See the full list of FCC Registered Amateur Radio Licenses in West Des Moines)
FAA Registered Aircraft: 49 (See the full list of FAA Registered Aircraft in West Des Moines)
| Home Mortgage Disclosure Act Aggregated Statistics For Year 2009 (Based on 6 full and 2 partial tracts) | ||||||||||||||
| A) FHA, FSA/RHS & VA Home Purchase Loans | B) Conventional Home Purchase Loans | C) Refinancings | D) Home Improvement Loans | E) Loans on Dwellings For 5+ Families | F) Non-occupant Loans on < 5 Family Dwellings (A B C & D) | G) Loans On Manufactured Home Dwelling (A B C & D) | ||||||||
|---|---|---|---|---|---|---|---|---|---|---|---|---|---|---|
| Number | Average Value | Number | Average Value | Number | Average Value | Number | Average Value | Number | Average Value | Number | Average Value | Number | Average Value | |
| LOANS ORIGINATED | 303 | $156,460 | 429 | $169,711 | 1,723 | $180,889 | 107 | $52,580 | 3 | $3,823,230 | 67 | $176,351 | 5 | $36,330 |
| APPLICATIONS APPROVED, NOT ACCEPTED | 12 | $154,660 | 26 | $181,402 | 136 | $171,301 | 11 | $29,211 | 0 | $0 | 4 | $196,640 | 1 | $85,430 |
| APPLICATIONS DENIED | 19 | $160,372 | 25 | $162,467 | 270 | $194,503 | 44 | $29,961 | 1 | $3,450,000 | 8 | $123,574 | 4 | $38,828 |
| APPLICATIONS WITHDRAWN | 18 | $156,062 | 34 | $192,496 | 277 | $168,912 | 15 | $50,800 | 2 | $1,859,000 | 14 | $135,581 | 0 | $0 |
| FILES CLOSED FOR INCOMPLETENESS | 6 | $143,770 | 4 | $159,715 | 52 | $216,372 | 4 | $37,082 | 0 | $0 | 1 | $94,390 | 0 | $0 |
Detailed HMDA statistics for the following Tracts: 0110.01 , 0110.21, 0110.23, 0110.24, 0111.02, 0111.11, 0111.12, 0508.02
| Private Mortgage Insurance Companies Aggregated Statistics For Year 2009 (Based on 6 full and 2 partial tracts) | ||||||
| A) Conventional Home Purchase Loans | B) Refinancings | C) Non-occupant Loans on < 5 Family Dwellings (A & B) | ||||
|---|---|---|---|---|---|---|
| Number | Average Value | Number | Average Value | Number | Average Value | |
| LOANS ORIGINATED | 82 | $189,213 | 113 | $183,626 | 1 | $83,550 |
| APPLICATIONS APPROVED, NOT ACCEPTED | 14 | $195,506 | 13 | $176,512 | 0 | $0 |
| APPLICATIONS DENIED | 6 | $196,748 | 9 | $204,654 | 0 | $0 |
| APPLICATIONS WITHDRAWN | 4 | $186,218 | 8 | $174,838 | 0 | $0 |
| FILES CLOSED FOR INCOMPLETENESS | 1 | $311,430 | 3 | $190,507 | 0 | $0 |
Detailed PMIC statistics for the following Tracts: 0110.01 , 0110.21, 0110.23, 0110.24, 0111.02, 0111.11, 0111.12, 0508.02
2002 - 2017 National Fire Incident Reporting System (NFIRS) incidents
- Fire incident types reported to NFIRS in West Des Moines, IA
- 68139.8%Outside Fires
- 64437.7%Structure Fires
- 34019.9%Mobile Property/Vehicle Fires
- 452.6%Other
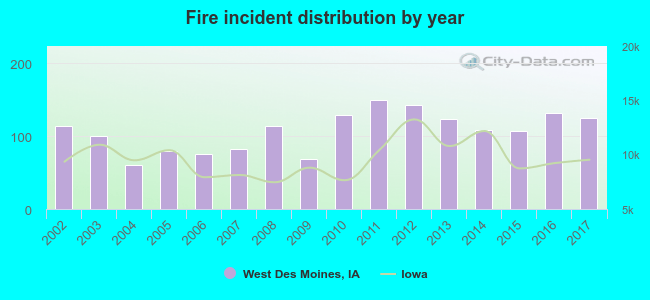 According to the data from the years 2002 - 2017 the average number of fires per year is 107. The highest number of fires - 149 took place in 2011, and the least - 60 in 2004. The data has a rising trend.
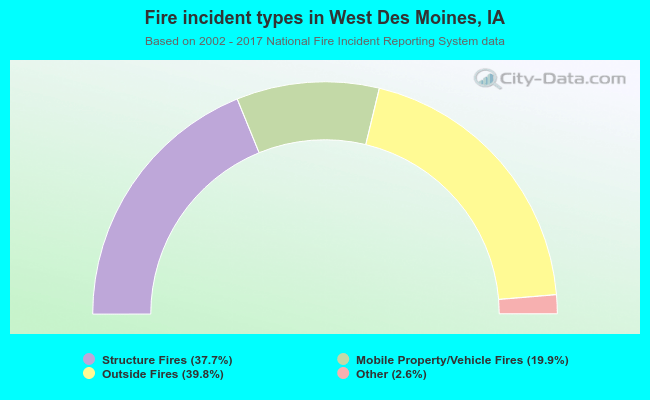 When looking into fire subcategories, the most incidents belonged to: Outside Fires (39.8%), and Structure Fires (37.7%).
Fire-safe hotels and motels in West Des Moines, Iowa:
- Westown Parkway Residences, 3530 Westown Pkwy, West Des Moines, Iowa 50266 , Phone: (515) 225-0000, Fax: (515) 225-1539
- Super 8, 11414 Forest Ave, West Des Moines, Iowa 50325 , Phone: (515) 226-0414, Fax: (515) 226-9769
- Sheraton West Des Moines Hotel, 1800 50th St, West Des Moines, Iowa 50266 , Phone: (515) 223-1800, Fax: (515) 223-0894
- Extended Stay America - Des Moines - West Des Moines, 2701 Westown Pkwy, West Des Moines, Iowa 50266 , Phone: (515) 327-9100, Fax: (515) 327-9200
- Hawthorn Suites LTD, 6905 Lk Dr, West Des Moines, Iowa 50266 , Fax: (515) 223-0099
- Springhill Suites, 1236 Jordan Creek Pkwy, West Des Moines, Iowa 50266 , Phone: (515) 223-9005, Fax: (515) 223-9058
- Residence Inn West Des Moines, 160 S Jordan Creek Pkwy, West Des Moines, Iowa 50266 , Phone: (515) 267-0338, Fax: (515) 440-1338
- Hilton Garden Inn - West Des Moines, 205 S 64th St, West Des Moines, Iowa 50266 , Phone: (515) 223-0571, Fax: (515) 223-0581
- 13 other hotels and motels
| Most common first names in West Des Moines, IA among deceased individuals | ||
| Name | Count | Lived (average) |
|---|---|---|
| John | 196 | 75.5 years |
| Mary | 190 | 80.2 years |
| Robert | 161 | 75.1 years |
| William | 126 | 75.5 years |
| James | 117 | 73.0 years |
| Margaret | 103 | 83.1 years |
| Helen | 99 | 83.3 years |
| Ruth | 84 | 84.5 years |
| Richard | 78 | 72.3 years |
| Dorothy | 76 | 80.0 years |
| Most common last names in West Des Moines, IA among deceased individuals | ||
| Last name | Count | Lived (average) |
|---|---|---|
| Johnson | 73 | 79.0 years |
| Smith | 57 | 78.7 years |
| Miller | 47 | 77.4 years |
| Anderson | 46 | 77.6 years |
| Brown | 46 | 77.0 years |
| Jones | 40 | 77.3 years |
| Wilson | 32 | 78.2 years |
| Williams | 26 | 81.1 years |
| Thompson | 24 | 79.5 years |
| Allen | 22 | 81.9 years |
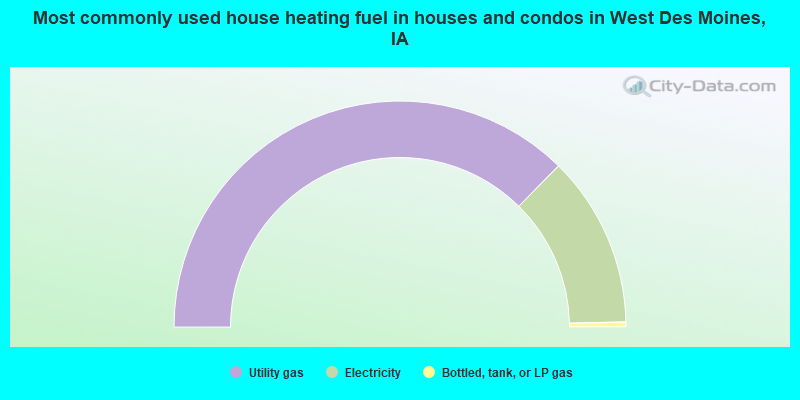
- 74.6%Utility gas
- 24.5%Electricity
- 0.7%Bottled, tank, or LP gas
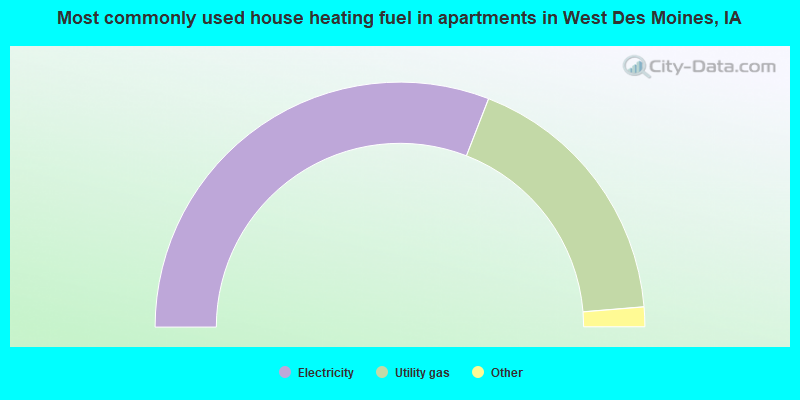
- 61.8%Electricity
- 35.6%Utility gas
- 2.0%Bottled, tank, or LP gas
- 0.3%Other fuel
- 0.2%No fuel used
- 0.1%Fuel oil, kerosene, etc.
West Des Moines compared to Iowa state average:
- Median house value above state average.
- Unemployed percentage significantly below state average.
- Black race population percentage above state average.
- Hispanic race population percentage above state average.
- Median age significantly below state average.
- Foreign-born population percentage significantly above state average.
- Length of stay since moving in below state average.
- House age significantly below state average.
- Percentage of population with a bachelor's degree or higher significantly above state average.
West Des Moines on our top lists:
- #1 on the list of "Top 101 cities with largest percentage of males in industries: finance and insurance (population 50,000+)"
- #1 on the list of "Top 101 cities with largest percentage of females in industries: finance and insurance (population 50,000+)"
- #4 on the list of "Top 101 cities with largest percentage of males in occupations: business and financial operations occupations (population 50,000+)"
- #15 on the list of "Top 101 cities with the highest ratio of rapes to murders between 2002 and 2012 (population 50,000+)"
- #25 on the list of "Top 101 cities with the lowest number of robberies per 100,000 residents (population 50,000+)"
- #30 on the list of "Top 101 cities with the largest temperature differences during a year (population 50,000+)"
- #42 on the list of "Top 101 cities with largest percentage of males in occupations: computer and mathematical occupations (population 50,000+)"
- #43 on the list of "Top 101 cities with largest percentage of females in occupations: business and financial operations occupations (population 50,000+)"
- #44 on the list of "Top 100 cities with highest median household income and median resident age less than 35 (pop. 50,000+)"
- #46 on the list of "Top 101 cities with the coldest winters (population 50,000+)"
- #50 on the list of "Top 101 cities with the lowest daily low temperatures (population 50,000+)"
- #57 on the list of "Top 101 cities with the smallest differences between morning and afternoon humidity (population 50,000+)"
- #58 on the list of "Top 101 cities with the smallest humidity differences during a year (population 50,000+)"
- #68 on the list of "Top 101 cities with most building permits per 10,000 residents (population 50,000+)"
- #69 on the list of "Top 101 cities with largest percentage of females in occupations: computer and mathematical occupations (population 50,000+)"
- #69 on the list of "Top 101 cities with largest percentage of females in occupations: legal occupations (population 50,000+)"
- #72 on the list of "Top 101 cities with the most recent year of entry for the foreign-born population (2,000+ people)+"
- #73 on the list of "Top 101 cities with the largest city-data.com crime index decrease from 2011 to 2012 (population 50,000+)"
- #75 on the list of "Top 101 cities with largest percentage of males in occupations: legal occupations (population 50,000+)"
- #75 on the list of "Top 101 cities with the lowest number of murders per 100,000 residents (population 50,000+)"
- #68 (50266) on the list of "Top 101 zip codes with the most finance and insurance companies in 2005"
- #23 on the list of "Top 101 counties with the lowest Sulfur Oxides Annual air pollution readings in 2012 (µg/m3)"
- #30 on the list of "Top 101 counties with the lowest percentage of residents relocating from foreign countries between 2010 and 2011"
- #46 on the list of "Top 101 counties with the lowest percentage of residents relocating to foreign countries in 2011"
- #47 on the list of "Top 101 counties with the highest percentage of residents that visited a dentist within the past year"
- #55 on the list of "Top 101 counties with the most Mainline Protestant adherents"

|
|
Total of 455 patent applications in 2008-2024.