West Des Moines: Fire Incidents, Iowa (IA)
Where are fire incidents reported in West Des Moines, IA
Something went wrong! Please refresh the page.
| Fire incidents reported | |
|---|---|
| Sreet name | Count |
| GRAND AVE | 158 |
| WESTOWN PKY | 108 |
| ASHWORTH RD | 104 |
| UNIVERSITY AVE | 86 |
| WOODLAND AVE | 86 |
| E.P. TRUE PKY | 80 |
| VISTA DR | 76 |
| MILLS CIVIC PKY | 68 |
| 11TH ST | 66 |
| JORDAN CREEK PKY | 66 |
| I-35 | 54 |
| VALLEY WEST DR | 54 |
| 50TH ST | 52 |
| 5TH ST | 52 |
| I-235 | 52 |
| OFFICE PARK RD | 50 |
| 22ND ST | 48 |
| 8TH ST | 48 |
| VINE ST | 46 |
| 9TH ST | 42 |
| PRAIRIE VIEW DR | 40 |
| 52ND ST | 38 |
| 1ST ST | 34 |
| 35TH ST | 32 |
| PLEASANT ST | 32 |
| 19TH ST | 30 |
| BOONEVILLE RD | 30 |
| I35 | 30 |
| LOCUST ST | 30 |
| 3RD ST | 28 |
2002 - 2017 National Fire Incident Reporting System (NFIRS) incidents
- Incident types reported to NFIRS in West Des Moines, IA
- 3,96331.6%Rescue & EMS
- 2,85722.8%False Alarm
- 2,31118.4%Hazardous Condition
- 1,71013.6%Fire
- 1,0818.6%Good Intent Call
- 5234.2%Service Call
- 680.5%Overpressure Rupture
- 160.1%Severe Weather
- Fire incident types reported to NFIRS in West Des Moines, IA
- 68139.8%Outside Fires
- 64437.7%Structure Fires
- 34019.9%Mobile Property/Vehicle Fires
- 452.6%Other
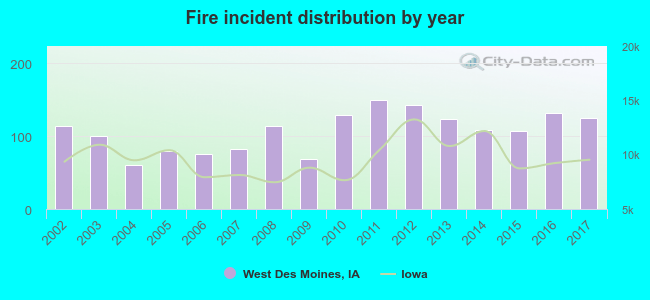 According to the data from the years 2002 - 2017 the average number of fire incidents per year is 107. The highest number of fire incidents - 149 took place in 2011, and the least - 60 in 2004. The data has a growing trend.
The average number of yearly fire incidents per 10k residents in West Des Moines, IA compared to nearest cities:
(Note: Based on data for the last 3 years, including only cities with population 5,000 and above)
| West Des Moines: | 13.6 |
| Clive: | 16.4 |
| Urbandale: | 10.8 |
| Waukee: | 27.4 |
| Des Moines: | 20.0 |
| Johnston: | 21.4 |
| Norwalk: | 2.0 |
| Grimes: | 20.9 |
| Pleasant Hill: | 13.1 |
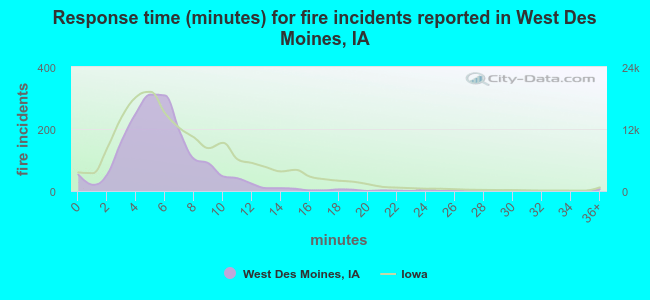 The median response time based on all reported fire incidents is 6 minutes. This is similar to the Iowa median value.
The median response time in West Des Moines, IA compared to nearest cities:
(Note: Based on data for all years, including only cities with at least 500 fire incidents)
| West Des Moines: | 6 minutes |
| Clive: | 6 minutes |
| Urbandale: | 7 minutes |
| Des Moines: | 5 minutes |
| Johnston: | 9 minutes |
| Pleasant Hill: | 10 minutes |
| Ankeny: | 7 minutes |
| Altoona: | 7 minutes |
| Indianola: | 8 minutes |
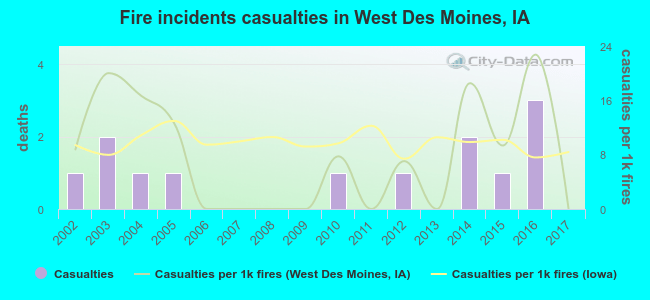 Based on the reports from the years 2002 - 2017 the average number of fire-related yearly casualties is 1. The highest number of injuries - 3 took place in 2016, and the lowest - 0 in 2006. The data has a declining trend.
The average number of casualties per 1,000 fire incidents is 8. This indicator was the highest - 23 in 2016, and the lowest 0 in 2006. The trend for injuries per 1,000 fires is dropping. Compared to the state value the number of injuries per 1,000 fire incidents is lower.
Based on the reports from the years 2002 - 2017 the average number of fire-related yearly casualties is 1. The highest number of injuries - 3 took place in 2016, and the lowest - 0 in 2006. The data has a declining trend.
The average number of casualties per 1,000 fire incidents is 8. This indicator was the highest - 23 in 2016, and the lowest 0 in 2006. The trend for injuries per 1,000 fires is dropping. Compared to the state value the number of injuries per 1,000 fire incidents is lower.Casualties per 1,000 incidents in West Des Moines, IA compared to nearest cities:
(Note: Based on data for all years, including only cities with at least 500 fire incidents)
| West Des Moines: | 7.6 |
| Clive: | 3.2 |
| Urbandale: | 11.9 |
| Des Moines: | 22.7 |
| Johnston: | 0.0 |
| Pleasant Hill: | 3.2 |
| Ankeny: | 12.5 |
| Altoona: | 14.5 |
| Indianola: | 18.0 |
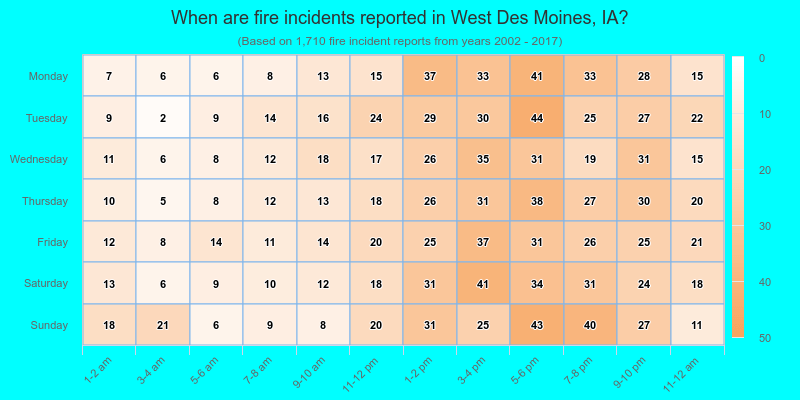
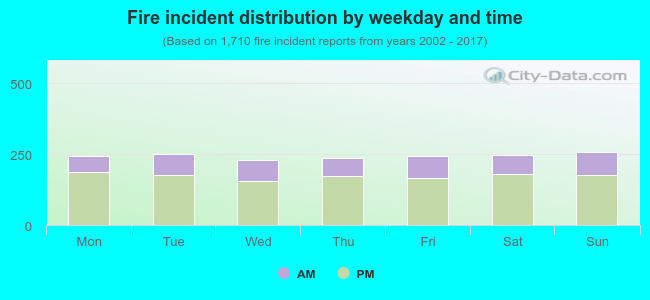 29.0% incidents where reported in the morning and 71.0% in the evening. The most fires (15.1%) took place on Sunday, and the least (13.4%) on Wednesday.
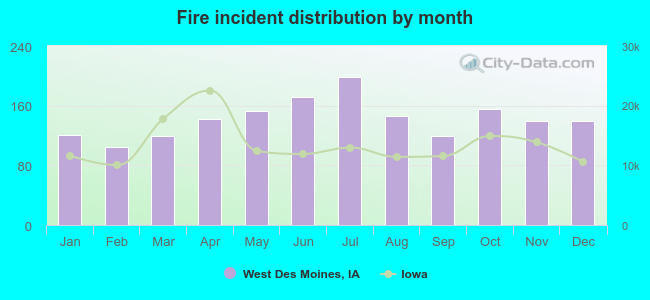 According to the 1,710 reports from years 2002 - 2017 most fires (11.6%) took place during July, and the least (6.1%) in February.
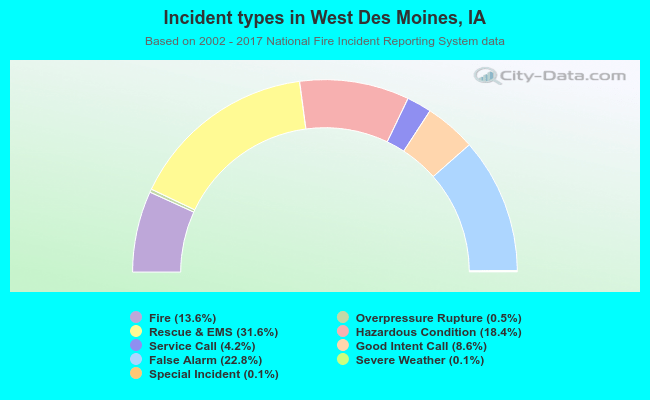 Out of all 12,539 cases reported during the years 2002 - 2017, the most belonged to the categories: Rescue & EMS (31.6%), False Alarm (22.8%), and Hazardous Condition (18.4%).
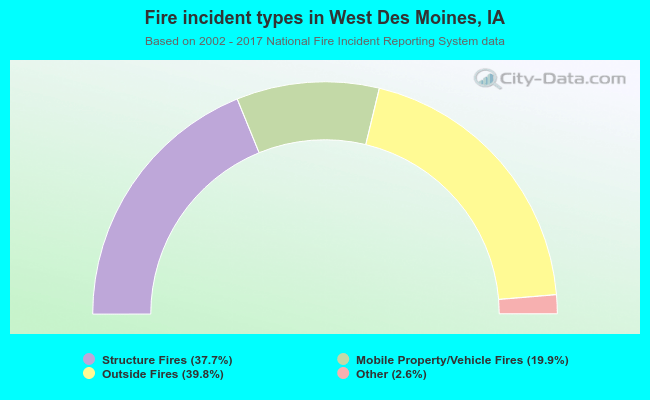 When looking into fire subcategories, the most reports belonged to: Outside Fires (39.8%), and Structure Fires (37.7%).