Altoona: Fire Incidents, Iowa (IA)
Where are fire incidents reported in Altoona, IA
Something went wrong! Please refresh the page.
|
| |||||||||||||||||||||||||||||||||||||||||||||||||||||||||||||||||||||||||||||||||||||||||||||||||||||||||||||
2002 - 2018 National Fire Incident Reporting System (NFIRS) incidents
- Incident types reported to NFIRS in Altoona, IA
- 3,88864.5%Rescue & EMS
- 68911.4%Fire
- 4377.2%Hazardous Condition
- 3986.6%False Alarm
- 2954.9%Service Call
- 2874.8%Good Intent Call
- 230.4%Special Incident
- 100.2%Overpressure Rupture
- Fire incident types reported to NFIRS in Altoona, IA
- 25637.2%Outside Fires
- 24936.1%Structure Fires
- 14521.0%Mobile Property/Vehicle Fires
- 395.7%Other
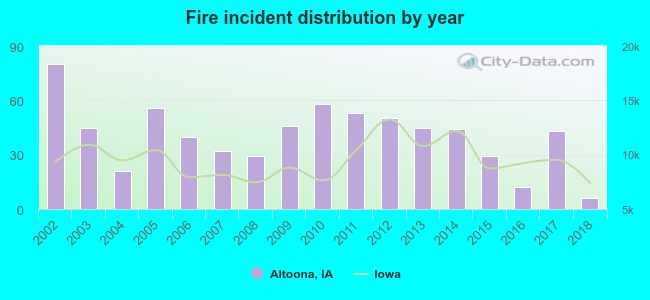 According to the data from the years 2002 - 2018 the average number of fire incidents per year is 41. The highest number of reported fires - 80 took place in 2002, and the least - 6 in 2018. The data has a declining trend.
The average number of yearly fire incidents per 10k residents in Altoona, IA compared to nearest cities:
(Note: Based on data for the last 3 years, including only cities with population 5,000 and above)
| Altoona: | 12.6 |
| Pleasant Hill: | 13.1 |
| Ankeny: | 1.4 |
| Des Moines: | 20.0 |
| Johnston: | 21.4 |
| Urbandale: | 10.8 |
| West Des Moines: | 13.6 |
| Norwalk: | 2.0 |
| Clive: | 16.4 |
 The median response time based on all reported fire incidents is 7 minutes. This is about the same as the state median value.
The median response time in Altoona, IA compared to nearest cities:
(Note: Based on data for all years, including only cities with at least 500 fire incidents)
| Altoona: | 7 minutes |
| Pleasant Hill: | 10 minutes |
| Ankeny: | 7 minutes |
| Des Moines: | 5 minutes |
| Johnston: | 9 minutes |
| Urbandale: | 7 minutes |
| West Des Moines: | 6 minutes |
| Clive: | 6 minutes |
| Indianola: | 8 minutes |
 29.6% incidents where reported in the morning and 70.4% in the evening. The most fires (16.1%) took place on Thursday, and the least (12.9%) on Wednesday.
 According to the 689 incident reports from years 2002 - 2018 most fires (12.2%) took place during April, and the least (5.8%) in January.
 Out of all 6,030 cases reported during the years 2002 - 2018, the most belonged to the categories: Rescue & EMS (64.5%), Fire (11.4%), and Hazardous Condition (7.2%).
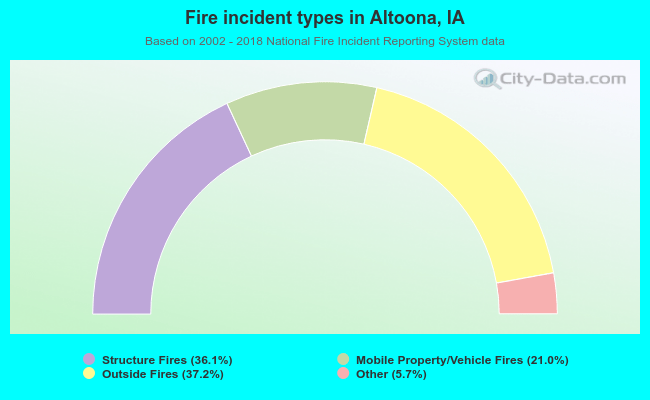 When looking into fire subcategories, the most reports belonged to: Outside Fires (37.2%), and Structure Fires (36.1%).