Clive: Fire Incidents, Iowa (IA)
Where are fire incidents reported in Clive, IA
Something went wrong! Please refresh the page.
| Fire incidents reported | |
|---|---|
| Sreet name | Count |
| HICKMAN RD | 146 |
| UNIVERSITY AVE | 86 |
| HARBACH BLVD | 70 |
| 86TH ST | 56 |
| 82ND ST | 42 |
| ALICE AVE | 42 |
| FRANKLIN AVE | 42 |
| UNIVERSITY BLVD | 28 |
| 156TH ST | 24 |
| SWANSON BLVD | 24 |
| 75TH ST | 20 |
| WILDWOOD DR | 20 |
| 114TH ST | 18 |
| INDIAN HILLS DR | 18 |
| SUMMIT DR | 18 |
| 128TH ST | 16 |
| FOREST AVE | 16 |
| 118TH ST | 12 |
| 131ST ST | 12 |
| 81ST ST | 12 |
| COUNTRY CLUB BLVD | 12 |
| 100TH ST | 10 |
| 120TH ST | 10 |
| 129TH ST | 10 |
| 84TH ST | 10 |
| 90TH ST | 10 |
| 96TH ST | 10 |
| CLARK ST | 10 |
| HAWTHORN DR | 10 |
| 102ND ST | 8 |
2002 - 2017 National Fire Incident Reporting System (NFIRS) incidents
- Incident types reported to NFIRS in Clive, IA
- 2,94550.3%Rescue & EMS
- 83514.3%False Alarm
- 66011.3%Good Intent Call
- 61910.6%Fire
- 5589.5%Hazardous Condition
- 1652.8%Service Call
- 530.9%Special Incident
- 180.3%Overpressure Rupture
- Fire incident types reported to NFIRS in Clive, IA
- 32552.5%Structure Fires
- 18029.1%Outside Fires
- 7011.3%Mobile Property/Vehicle Fires
- 447.1%Other
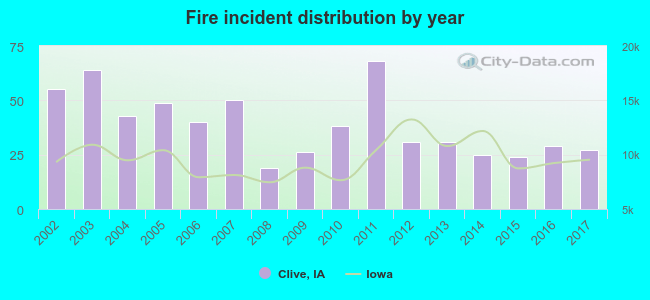 According to the data from the years 2002 - 2017 the average number of fires per year is 39. The highest number of reported fires - 68 took place in 2011, and the least - 19 in 2008. The data has a declining trend.
The average number of yearly fire incidents per 10k residents in Clive, IA compared to nearest cities:
(Note: Based on data for the last 3 years, including only cities with population 5,000 and above)
| Clive: | 16.4 |
| West Des Moines: | 13.6 |
| Urbandale: | 10.8 |
| Waukee: | 27.4 |
| Grimes: | 20.9 |
| Johnston: | 21.4 |
| Des Moines: | 20.0 |
| Norwalk: | 2.0 |
| Ankeny: | 1.4 |
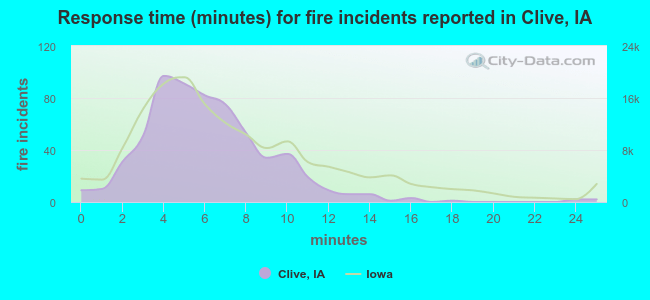 The median response time based on all reported fire incidents is 6 minutes. This is comparable to the Iowa median value.
The median response time in Clive, IA compared to nearest cities:
(Note: Based on data for all years, including only cities with at least 500 fire incidents)
| Clive: | 6 minutes |
| West Des Moines: | 6 minutes |
| Urbandale: | 7 minutes |
| Johnston: | 9 minutes |
| Des Moines: | 5 minutes |
| Ankeny: | 7 minutes |
| Pleasant Hill: | 10 minutes |
| Altoona: | 7 minutes |
| Indianola: | 8 minutes |
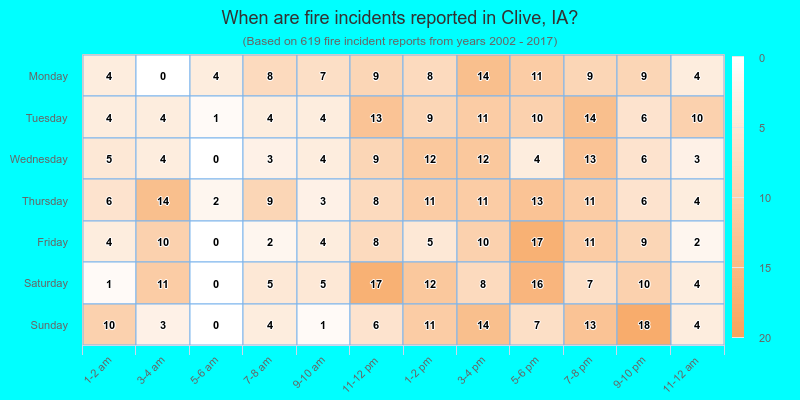
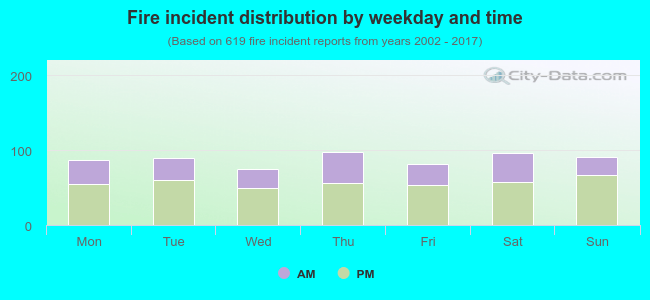 35.5% incidents where reported in the morning and 64.5% in the evening. The most fires (15.8%) took place on Thursday, and the least (12.1%) on Wednesday.
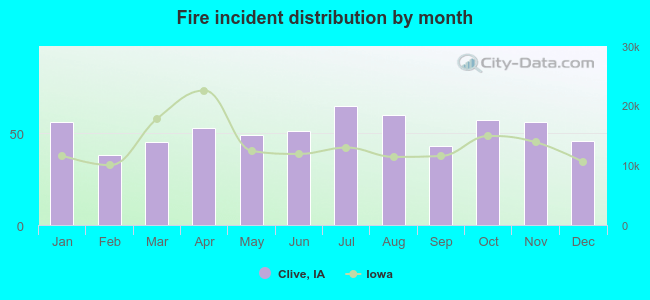 According to the 619 reports from years 2002 - 2017 most fires (10.5%) took place during July, and the least (6.1%) in February.
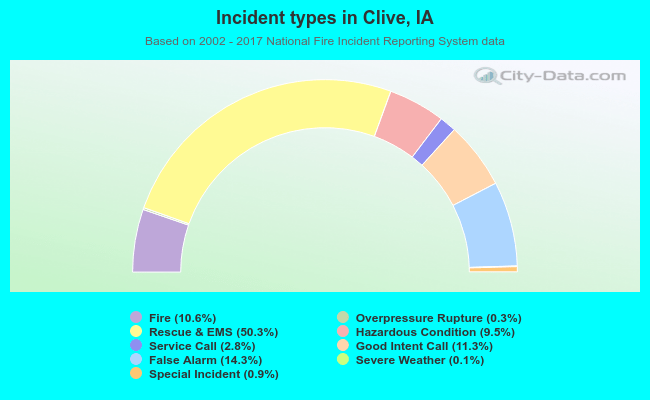 Out of all 5,858 cases reported during the years 2002 - 2017, the most belonged to the categories: Rescue & EMS (50.3%), False Alarm (14.3%), and Good Intent Call (11.3%).
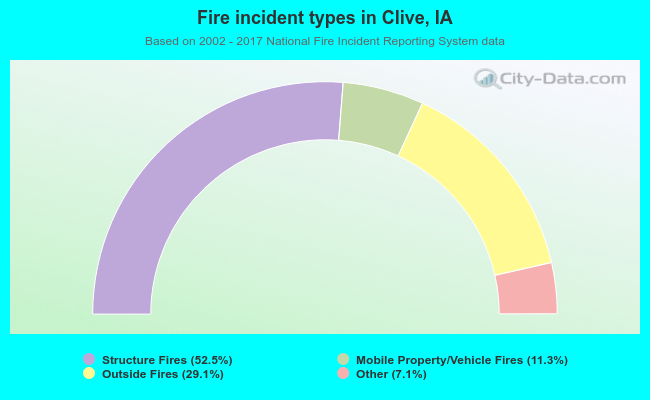 When looking into fire subcategories, the most reports belonged to: Structure Fires (52.5%), and Outside Fires (29.1%).