South Venice, Florida Submit your own pictures of this place and show them to the world
OSM Map
General Map
Google Map
MSN Map
OSM Map
General Map
Google Map
MSN Map
OSM Map
General Map
Google Map
MSN Map
OSM Map
General Map
Google Map
MSN Map
Please wait while loading the map...
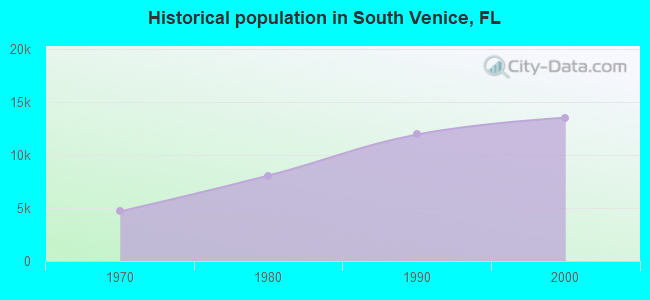
Population in 2010: 13,949. Population change since 2000: +3.0%Males: 6,833 Females: 7,116
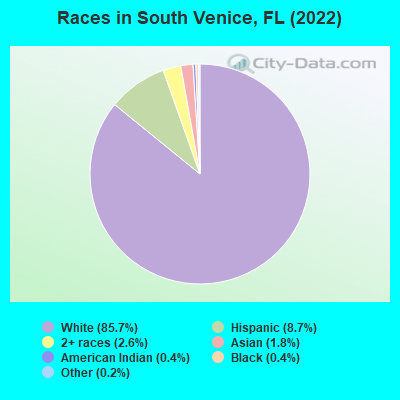
March 2022 cost of living index in South Venice: 95.5 (near average, U.S. average is 100) Percentage of residents living in poverty in 2022: 9.0%for White Non-Hispanic residents , 8.7% for Black residents , 7.2% for Hispanic or Latino residents , 17.0% for American Indian residents , 18.5% for other race residents , 2.6% for two or more races residents )
Profiles of local businesses
Business Search - 14 Million verified businesses
Data:
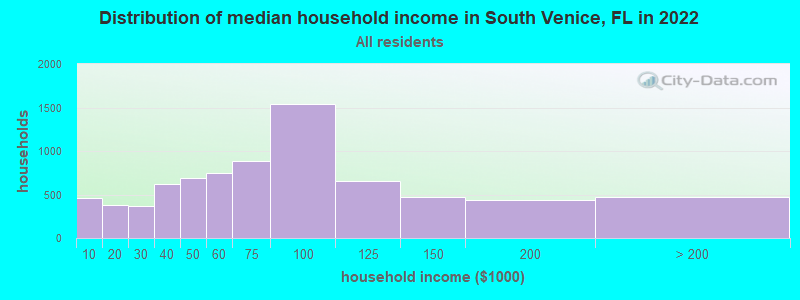
Median household income ($)
Median household income (% change since 2000)
Household income diversity
Ratio of average income to average house value (%)
Ratio of average income to average rent
Median household income ($) - White
Median household income ($) - Black or African American
Median household income ($) - Asian
Median household income ($) - Hispanic or Latino
Median household income ($) - American Indian and Alaska Native
Median household income ($) - Multirace
Median household income ($) - Other Race
Median household income for houses/condos with a mortgage ($)
Median household income for apartments without a mortgage ($)
Races - White alone (%)
Races - White alone (% change since 2000)
Races - Black alone (%)
Races - Black alone (% change since 2000)
Races - American Indian alone (%)
Races - American Indian alone (% change since 2000)
Races - Asian alone (%)
Races - Asian alone (% change since 2000)
Races - Hispanic (%)
Races - Hispanic (% change since 2000)
Races - Native Hawaiian and Other Pacific Islander alone (%)
Races - Native Hawaiian and Other Pacific Islander alone (% change since 2000)
Races - Two or more races (%)
Races - Two or more races (% change since 2000)
Races - Other race alone (%)
Races - Other race alone (% change since 2000)
Racial diversity
Unemployment (%)
Unemployment (% change since 2000)
Unemployment (%) - White
Unemployment (%) - Black or African American
Unemployment (%) - Asian
Unemployment (%) - Hispanic or Latino
Unemployment (%) - American Indian and Alaska Native
Unemployment (%) - Multirace
Unemployment (%) - Other Race
Population density (people per square mile)
Population - Males (%)
Population - Females (%)
Population - Males (%) - White
Population - Males (%) - Black or African American
Population - Males (%) - Asian
Population - Males (%) - Hispanic or Latino
Population - Males (%) - American Indian and Alaska Native
Population - Males (%) - Multirace
Population - Males (%) - Other Race
Population - Females (%) - White
Population - Females (%) - Black or African American
Population - Females (%) - Asian
Population - Females (%) - Hispanic or Latino
Population - Females (%) - American Indian and Alaska Native
Population - Females (%) - Multirace
Population - Females (%) - Other Race
Coronavirus confirmed cases (Jun 05, 2024)
Deaths caused by coronavirus (Jun 05, 2024)
Coronavirus confirmed cases (per 100k population) (Jun 05, 2024)
Deaths caused by coronavirus (per 100k population) (Jun 05, 2024)
Daily increase in number of cases (Jun 05, 2024)
Weekly increase in number of cases (Jun 05, 2024)
Cases doubled (in days) (Jun 05, 2024)
Hospitalized patients (Apr 18, 2022)
Negative test results (Apr 18, 2022)
Total test results (Apr 18, 2022)
COVID Vaccine doses distributed (per 100k population) (Sep 19, 2023)
COVID Vaccine doses administered (per 100k population) (Sep 19, 2023)
COVID Vaccine doses distributed (Sep 19, 2023)
COVID Vaccine doses administered (Sep 19, 2023)
Likely homosexual households (%)
Likely homosexual households (% change since 2000)
Likely homosexual households - Lesbian couples (%)
Likely homosexual households - Lesbian couples (% change since 2000)
Likely homosexual households - Gay men (%)
Likely homosexual households - Gay men (% change since 2000)
Cost of living index
Median gross rent ($)
Median contract rent ($)
Median monthly housing costs ($)
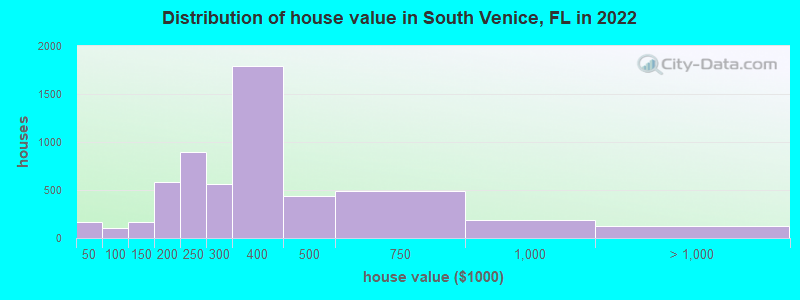
Median house or condo value ($)
Median house or condo value ($ change since 2000)
Mean house or condo value by units in structure - 1, detached ($)
Mean house or condo value by units in structure - 1, attached ($)
Mean house or condo value by units in structure - 2 ($)
Mean house or condo value by units in structure by units in structure - 3 or 4 ($)
Mean house or condo value by units in structure - 5 or more ($)
Mean house or condo value by units in structure - Boat, RV, van, etc. ($)
Mean house or condo value by units in structure - Mobile home ($)
Median house or condo value ($) - White
Median house or condo value ($) - Black or African American
Median house or condo value ($) - Asian
Median house or condo value ($) - Hispanic or Latino
Median house or condo value ($) - American Indian and Alaska Native
Median house or condo value ($) - Multirace
Median house or condo value ($) - Other Race
Median resident age
Resident age diversity
Median resident age - Males
Median resident age - Females
Median resident age - White
Median resident age - Black or African American
Median resident age - Asian
Median resident age - Hispanic or Latino
Median resident age - American Indian and Alaska Native
Median resident age - Multirace
Median resident age - Other Race
Median resident age - Males - White
Median resident age - Males - Black or African American
Median resident age - Males - Asian
Median resident age - Males - Hispanic or Latino
Median resident age - Males - American Indian and Alaska Native
Median resident age - Males - Multirace
Median resident age - Males - Other Race
Median resident age - Females - White
Median resident age - Females - Black or African American
Median resident age - Females - Asian
Median resident age - Females - Hispanic or Latino
Median resident age - Females - American Indian and Alaska Native
Median resident age - Females - Multirace
Median resident age - Females - Other Race
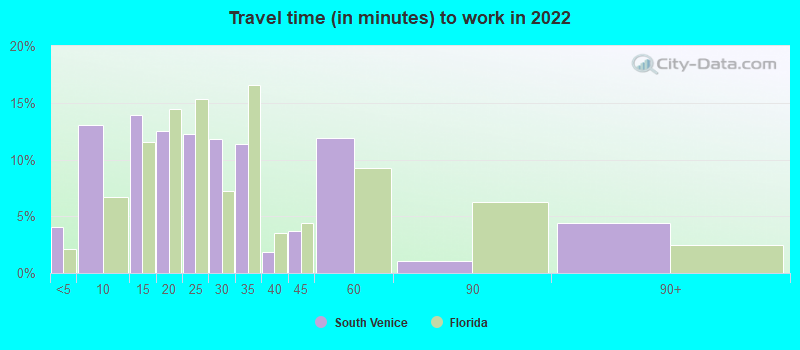
Commute - mean travel time to work (minutes)
Travel time to work - Less than 5 minutes (%)
Travel time to work - Less than 5 minutes (% change since 2000)
Travel time to work - 5 to 9 minutes (%)
Travel time to work - 5 to 9 minutes (% change since 2000)
Travel time to work - 10 to 19 minutes (%)
Travel time to work - 10 to 19 minutes (% change since 2000)
Travel time to work - 20 to 29 minutes (%)
Travel time to work - 20 to 29 minutes (% change since 2000)
Travel time to work - 30 to 39 minutes (%)
Travel time to work - 30 to 39 minutes (% change since 2000)
Travel time to work - 40 to 59 minutes (%)
Travel time to work - 40 to 59 minutes (% change since 2000)
Travel time to work - 60 to 89 minutes (%)
Travel time to work - 60 to 89 minutes (% change since 2000)
Travel time to work - 90 or more minutes (%)
Travel time to work - 90 or more minutes (% change since 2000)
Marital status - Never married (%)
Marital status - Now married (%)
Marital status - Separated (%)
Marital status - Widowed (%)
Marital status - Divorced (%)
Median family income ($)
Median family income (% change since 2000)
Median non-family income ($)
Median non-family income (% change since 2000)
Median per capita income ($)
Median per capita income (% change since 2000)
Median family income ($) - White
Median family income ($) - Black or African American
Median family income ($) - Asian
Median family income ($) - Hispanic or Latino
Median family income ($) - American Indian and Alaska Native
Median family income ($) - Multirace
Median family income ($) - Other Race
Median year house/condo built
Median year apartment built
Year house built - Built 2005 or later (%)
Year house built - Built 2000 to 2004 (%)
Year house built - Built 1990 to 1999 (%)
Year house built - Built 1980 to 1989 (%)
Year house built - Built 1970 to 1979 (%)
Year house built - Built 1960 to 1969 (%)
Year house built - Built 1950 to 1959 (%)
Year house built - Built 1940 to 1949 (%)
Year house built - Built 1939 or earlier (%)
Average household size
Household density (households per square mile)
Average household size - White
Average household size - Black or African American
Average household size - Asian
Average household size - Hispanic or Latino
Average household size - American Indian and Alaska Native
Average household size - Multirace
Average household size - Other Race
Occupied housing units (%)
Vacant housing units (%)
Owner occupied housing units (%)
Renter occupied housing units (%)
Vacancy status - For rent (%)
Vacancy status - For sale only (%)
Vacancy status - Rented or sold, not occupied (%)
Vacancy status - For seasonal, recreational, or occasional use (%)
Vacancy status - For migrant workers (%)
Vacancy status - Other vacant (%)
Residents with income below the poverty level (%)
Residents with income below 50% of the poverty level (%)
Children below poverty level (%)
Poor families by family type - Married-couple family (%)
Poor families by family type - Male, no wife present (%)
Poor families by family type - Female, no husband present (%)
Poverty status for native-born residents (%)
Poverty status for foreign-born residents (%)
Poverty among high school graduates not in families (%)
Poverty among people who did not graduate high school not in families (%)
Residents with income below the poverty level (%) - White
Residents with income below the poverty level (%) - Black or African American
Residents with income below the poverty level (%) - Asian
Residents with income below the poverty level (%) - Hispanic or Latino
Residents with income below the poverty level (%) - American Indian and Alaska Native
Residents with income below the poverty level (%) - Multirace
Residents with income below the poverty level (%) - Other Race
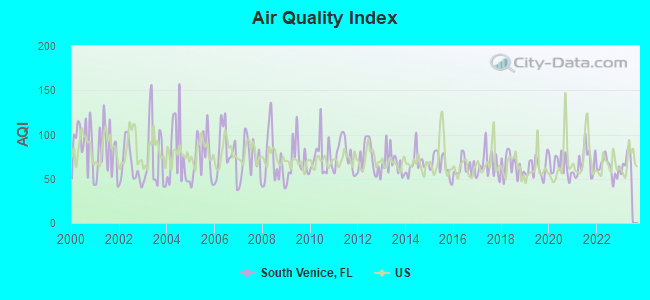
Air pollution - Air Quality Index (AQI)
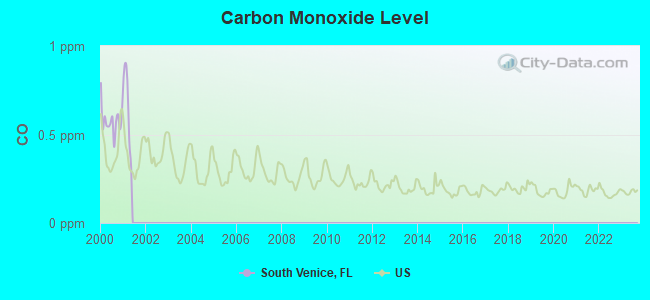
Air pollution - CO
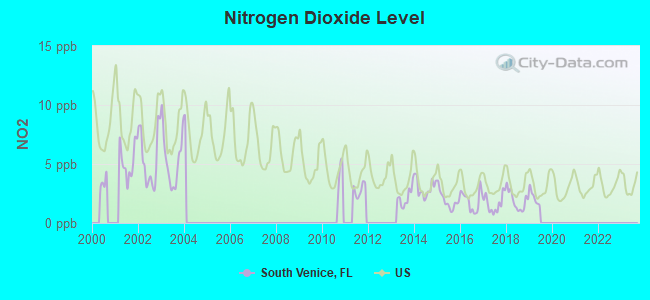
Air pollution - NO2
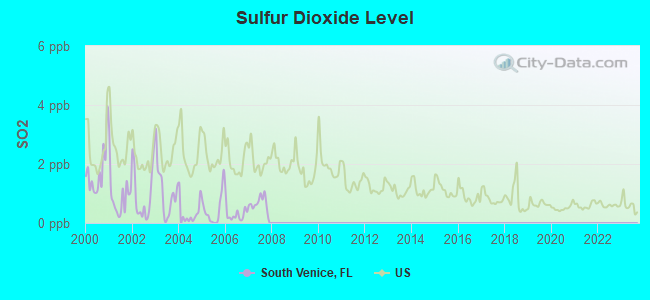
Air pollution - SO2
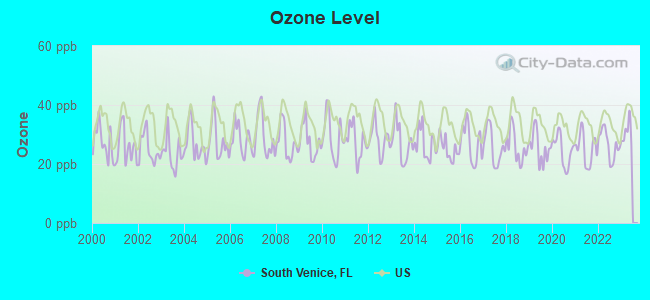
Air pollution - Ozone
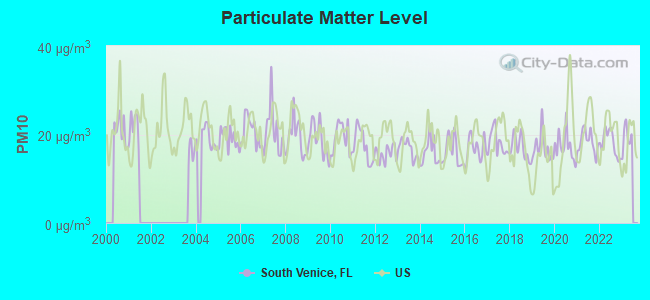
Air pollution - PM10
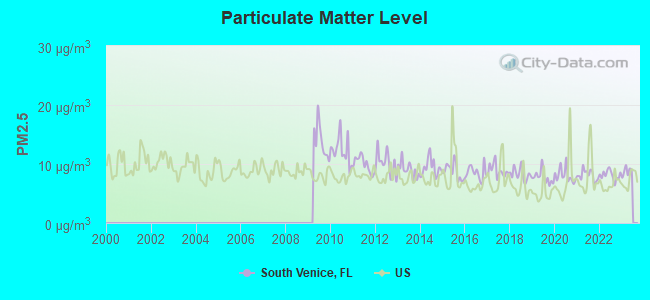
Air pollution - PM25
Air pollution - Pb
Crime - Murders per 100,000 population
Crime - Rapes per 100,000 population
Crime - Robberies per 100,000 population
Crime - Assaults per 100,000 population
Crime - Burglaries per 100,000 population
Crime - Thefts per 100,000 population
Crime - Auto thefts per 100,000 population
Crime - Arson per 100,000 population
Crime - City-data.com crime index
Crime - Violent crime index
Crime - Property crime index
Crime - Murders per 100,000 population (5 year average)
Crime - Rapes per 100,000 population (5 year average)
Crime - Robberies per 100,000 population (5 year average)
Crime - Assaults per 100,000 population (5 year average)
Crime - Burglaries per 100,000 population (5 year average)
Crime - Thefts per 100,000 population (5 year average)
Crime - Auto thefts per 100,000 population (5 year average)
Crime - Arson per 100,000 population (5 year average)
Crime - City-data.com crime index (5 year average)
Crime - Violent crime index (5 year average)
Crime - Property crime index (5 year average)
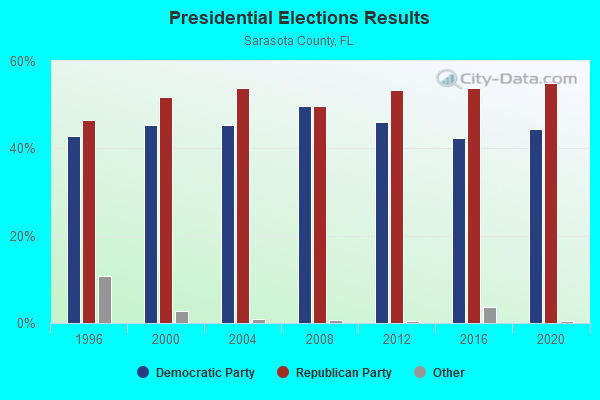
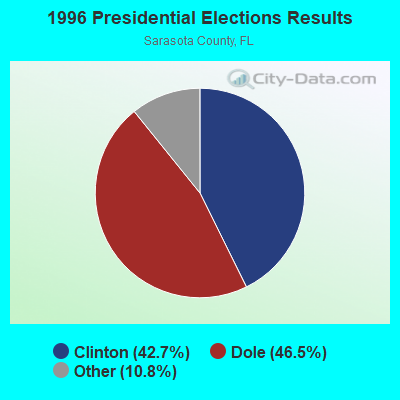
1996 Presidential Elections Results (%) - Democratic Party (Clinton)
1996 Presidential Elections Results (%) - Republican Party (Dole)
1996 Presidential Elections Results (%) - Other
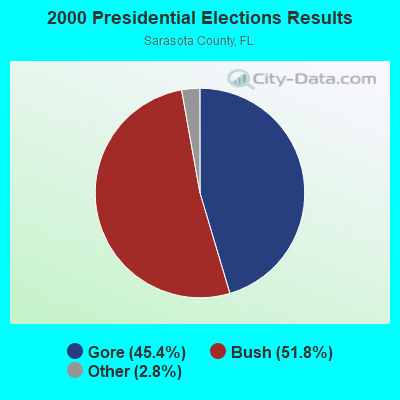
2000 Presidential Elections Results (%) - Democratic Party (Gore)
2000 Presidential Elections Results (%) - Republican Party (Bush)
2000 Presidential Elections Results (%) - Other
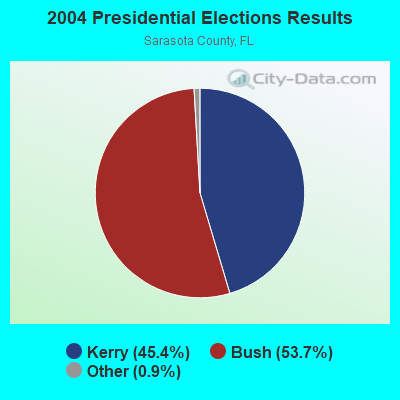
2004 Presidential Elections Results (%) - Democratic Party (Kerry)
2004 Presidential Elections Results (%) - Republican Party (Bush)
2004 Presidential Elections Results (%) - Other
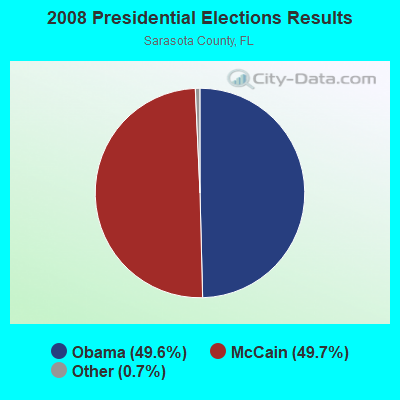
2008 Presidential Elections Results (%) - Democratic Party (Obama)
2008 Presidential Elections Results (%) - Republican Party (McCain)
2008 Presidential Elections Results (%) - Other
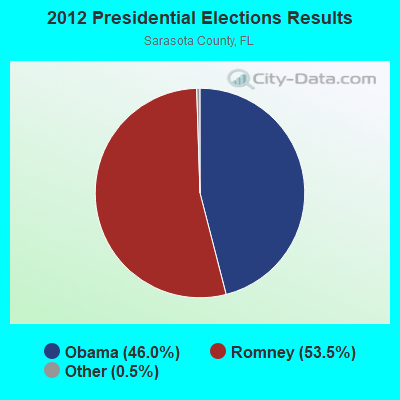
2012 Presidential Elections Results (%) - Democratic Party (Obama)
2012 Presidential Elections Results (%) - Republican Party (Romney)
2012 Presidential Elections Results (%) - Other
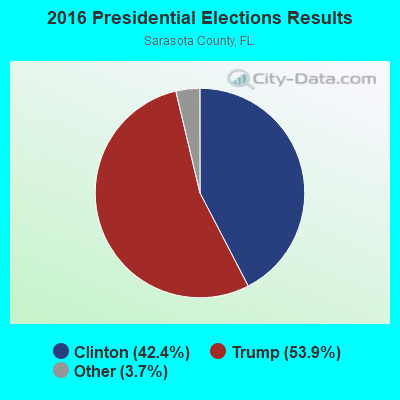
2016 Presidential Elections Results (%) - Democratic Party (Clinton)
2016 Presidential Elections Results (%) - Republican Party (Trump)
2016 Presidential Elections Results (%) - Other
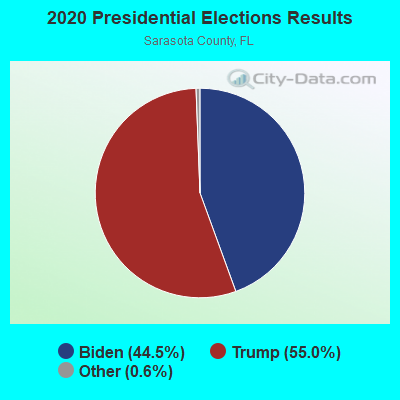
2020 Presidential Elections Results (%) - Democratic Party (Biden)
2020 Presidential Elections Results (%) - Republican Party (Trump)
2020 Presidential Elections Results (%) - Other
Ancestries Reported - Arab (%)
Ancestries Reported - Czech (%)
Ancestries Reported - Danish (%)
Ancestries Reported - Dutch (%)
Ancestries Reported - English (%)
Ancestries Reported - French (%)
Ancestries Reported - French Canadian (%)
Ancestries Reported - German (%)
Ancestries Reported - Greek (%)
Ancestries Reported - Hungarian (%)
Ancestries Reported - Irish (%)
Ancestries Reported - Italian (%)
Ancestries Reported - Lithuanian (%)
Ancestries Reported - Norwegian (%)
Ancestries Reported - Polish (%)
Ancestries Reported - Portuguese (%)
Ancestries Reported - Russian (%)
Ancestries Reported - Scotch-Irish (%)
Ancestries Reported - Scottish (%)
Ancestries Reported - Slovak (%)
Ancestries Reported - Subsaharan African (%)
Ancestries Reported - Swedish (%)
Ancestries Reported - Swiss (%)
Ancestries Reported - Ukrainian (%)
Ancestries Reported - United States (%)
Ancestries Reported - Welsh (%)
Ancestries Reported - West Indian (%)
Ancestries Reported - Other (%)
Educational Attainment - No schooling completed (%)
Educational Attainment - Less than high school (%)
Educational Attainment - High school or equivalent (%)
Educational Attainment - Less than 1 year of college (%)
Educational Attainment - 1 or more years of college (%)
Educational Attainment - Associate degree (%)
Educational Attainment - Bachelor's degree (%)
Educational Attainment - Master's degree (%)
Educational Attainment - Professional school degree (%)
Educational Attainment - Doctorate degree (%)
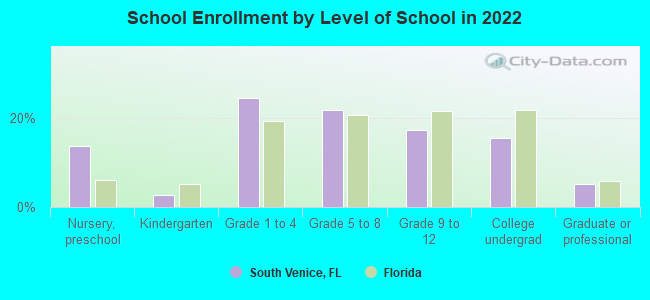
School Enrollment - Nursery, preschool (%)
School Enrollment - Kindergarten (%)
School Enrollment - Grade 1 to 4 (%)
School Enrollment - Grade 5 to 8 (%)
School Enrollment - Grade 9 to 12 (%)
School Enrollment - College undergrad (%)
School Enrollment - Graduate or professional (%)
School Enrollment - Not enrolled in school (%)
School enrollment - Public schools (%)
School enrollment - Private schools (%)
School enrollment - Not enrolled (%)
Median number of rooms in houses and condos
Median number of rooms in apartments
Housing units lacking complete plumbing facilities (%)
Housing units lacking complete kitchen facilities (%)
Density of houses
Urban houses (%)
Rural houses (%)
Households with people 60 years and over (%)
Households with people 65 years and over (%)
Households with people 75 years and over (%)
Households with one or more nonrelatives (%)
Households with no nonrelatives (%)
Population in households (%)
Family households (%)
Nonfamily households (%)
Population in families (%)
Family households with own children (%)
Median number of bedrooms in owner occupied houses
Mean number of bedrooms in owner occupied houses
Median number of bedrooms in renter occupied houses
Mean number of bedrooms in renter occupied houses
Median number of vehichles in owner occupied houses
Mean number of vehichles in owner occupied houses
Median number of vehichles in renter occupied houses
Mean number of vehichles in renter occupied houses
Mortgage status - with mortgage (%)
Mortgage status - with second mortgage (%)
Mortgage status - with home equity loan (%)
Mortgage status - with both second mortgage and home equity loan (%)
Mortgage status - without a mortgage (%)
Average family size
Average family size - White
Average family size - Black or African American
Average family size - Asian
Average family size - Hispanic or Latino
Average family size - American Indian and Alaska Native
Average family size - Multirace
Average family size - Other Race
Geographical mobility - Same house 1 year ago (%)
Geographical mobility - Moved within same county (%)
Geographical mobility - Moved from different county within same state (%)
Geographical mobility - Moved from different state (%)
Geographical mobility - Moved from abroad (%)
Place of birth - Born in state of residence (%)
Place of birth - Born in other state (%)
Place of birth - Native, outside of US (%)
Place of birth - Foreign born (%)
Housing units in structures - 1, detached (%)
Housing units in structures - 1, attached (%)
Housing units in structures - 2 (%)
Housing units in structures - 3 or 4 (%)
Housing units in structures - 5 to 9 (%)
Housing units in structures - 10 to 19 (%)
Housing units in structures - 20 to 49 (%)
Housing units in structures - 50 or more (%)
Housing units in structures - Mobile home (%)
Housing units in structures - Boat, RV, van, etc. (%)
House/condo owner moved in on average (years ago)
Renter moved in on average (years ago)
Year householder moved into unit - Moved in 1999 to March 2000 (%)
Year householder moved into unit - Moved in 1995 to 1998 (%)
Year householder moved into unit - Moved in 1990 to 1994 (%)
Year householder moved into unit - Moved in 1980 to 1989 (%)
Year householder moved into unit - Moved in 1970 to 1979 (%)
Year householder moved into unit - Moved in 1969 or earlier (%)
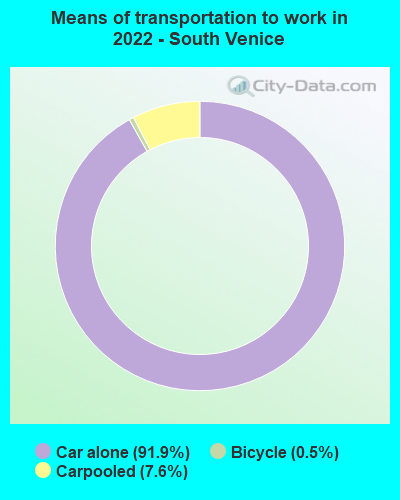
Means of transportation to work - Drove car alone (%)
Means of transportation to work - Carpooled (%)
Means of transportation to work - Public transportation (%)
Means of transportation to work - Bus or trolley bus (%)
Means of transportation to work - Streetcar or trolley car (%)
Means of transportation to work - Subway or elevated (%)
Means of transportation to work - Railroad (%)
Means of transportation to work - Ferryboat (%)
Means of transportation to work - Taxicab (%)
Means of transportation to work - Motorcycle (%)
Means of transportation to work - Bicycle (%)
Means of transportation to work - Walked (%)
Means of transportation to work - Other means (%)
Working at home (%)
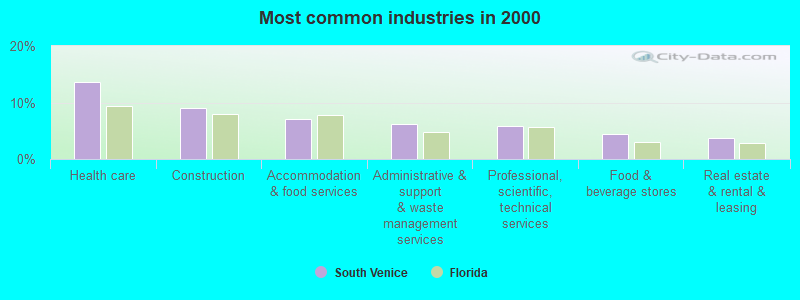
Industry diversity
Most Common Industries - Agriculture, forestry, fishing and hunting, and mining (%)
Most Common Industries - Agriculture, forestry, fishing and hunting (%)
Most Common Industries - Mining, quarrying, and oil and gas extraction (%)
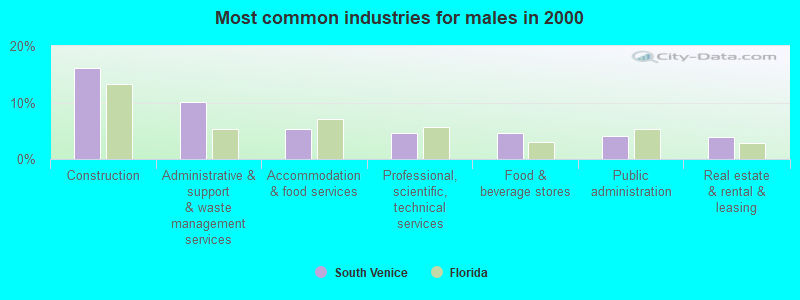
Most Common Industries - Construction (%)
Most Common Industries - Manufacturing (%)
Most Common Industries - Wholesale trade (%)
Most Common Industries - Retail trade (%)
Most Common Industries - Transportation and warehousing, and utilities (%)
Most Common Industries - Transportation and warehousing (%)
Most Common Industries - Utilities (%)
Most Common Industries - Information (%)
Most Common Industries - Finance and insurance, and real estate and rental and leasing (%)
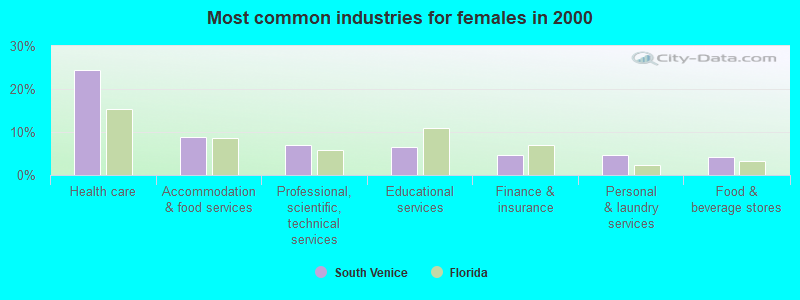
Most Common Industries - Finance and insurance (%)
Most Common Industries - Real estate and rental and leasing (%)
Most Common Industries - Professional, scientific, and management, and administrative and waste management services (%)
Most Common Industries - Professional, scientific, and technical services (%)
Most Common Industries - Management of companies and enterprises (%)
Most Common Industries - Administrative and support and waste management services (%)
Most Common Industries - Educational services, and health care and social assistance (%)
Most Common Industries - Educational services (%)
Most Common Industries - Health care and social assistance (%)
Most Common Industries - Arts, entertainment, and recreation, and accommodation and food services (%)
Most Common Industries - Arts, entertainment, and recreation (%)
Most Common Industries - Accommodation and food services (%)
Most Common Industries - Other services, except public administration (%)
Most Common Industries - Public administration (%)
Occupation diversity
Most Common Occupations - Management, business, science, and arts occupations (%)
Most Common Occupations - Management, business, and financial occupations (%)
Most Common Occupations - Management occupations (%)
Most Common Occupations - Business and financial operations occupations (%)
Most Common Occupations - Computer, engineering, and science occupations (%)
Most Common Occupations - Computer and mathematical occupations (%)
Most Common Occupations - Architecture and engineering occupations (%)
Most Common Occupations - Life, physical, and social science occupations (%)
Most Common Occupations - Education, legal, community service, arts, and media occupations (%)
Most Common Occupations - Community and social service occupations (%)
Most Common Occupations - Legal occupations (%)
Most Common Occupations - Education, training, and library occupations (%)
Most Common Occupations - Arts, design, entertainment, sports, and media occupations (%)
Most Common Occupations - Healthcare practitioners and technical occupations (%)
Most Common Occupations - Health diagnosing and treating practitioners and other technical occupations (%)
Most Common Occupations - Health technologists and technicians (%)
Most Common Occupations - Service occupations (%)
Most Common Occupations - Healthcare support occupations (%)
Most Common Occupations - Protective service occupations (%)
Most Common Occupations - Fire fighting and prevention, and other protective service workers including supervisors (%)
Most Common Occupations - Law enforcement workers including supervisors (%)
Most Common Occupations - Food preparation and serving related occupations (%)
Most Common Occupations - Building and grounds cleaning and maintenance occupations (%)
Most Common Occupations - Personal care and service occupations (%)
Most Common Occupations - Sales and office occupations (%)
Most Common Occupations - Sales and related occupations (%)
Most Common Occupations - Office and administrative support occupations (%)
Most Common Occupations - Natural resources, construction, and maintenance occupations (%)
Most Common Occupations - Farming, fishing, and forestry occupations (%)
Most Common Occupations - Construction and extraction occupations (%)
Most Common Occupations - Installation, maintenance, and repair occupations (%)
Most Common Occupations - Production, transportation, and material moving occupations (%)
Most Common Occupations - Production occupations (%)
Most Common Occupations - Transportation occupations (%)
Most Common Occupations - Material moving occupations (%)
People in Group quarters - Institutionalized population (%)
People in Group quarters - Correctional institutions (%)
People in Group quarters - Federal prisons and detention centers (%)
People in Group quarters - Halfway houses (%)
People in Group quarters - Local jails and other confinement facilities (including police lockups) (%)
People in Group quarters - Military disciplinary barracks (%)
People in Group quarters - State prisons (%)
People in Group quarters - Other types of correctional institutions (%)
People in Group quarters - Nursing homes (%)
People in Group quarters - Hospitals/wards, hospices, and schools for the handicapped (%)
People in Group quarters - Hospitals/wards and hospices for chronically ill (%)
People in Group quarters - Hospices or homes for chronically ill (%)
People in Group quarters - Military hospitals or wards for chronically ill (%)
People in Group quarters - Other hospitals or wards for chronically ill (%)
People in Group quarters - Hospitals or wards for drug/alcohol abuse (%)
People in Group quarters - Mental (Psychiatric) hospitals or wards (%)
People in Group quarters - Schools, hospitals, or wards for the mentally retarded (%)
People in Group quarters - Schools, hospitals, or wards for the physically handicapped (%)
People in Group quarters - Institutions for the deaf (%)
People in Group quarters - Institutions for the blind (%)
People in Group quarters - Orthopedic wards and institutions for the physically handicapped (%)
People in Group quarters - Wards in general hospitals for patients who have no usual home elsewhere (%)
People in Group quarters - Wards in military hospitals for patients who have no usual home elsewhere (%)
People in Group quarters - Juvenile institutions (%)
People in Group quarters - Long-term care (%)
People in Group quarters - Homes for abused, dependent, and neglected children (%)
People in Group quarters - Residential treatment centers for emotionally disturbed children (%)
People in Group quarters - Training schools for juvenile delinquents (%)
People in Group quarters - Short-term care, detention or diagnostic centers for delinquent children (%)
People in Group quarters - Type of juvenile institution unknown (%)
People in Group quarters - Noninstitutionalized population (%)
People in Group quarters - College dormitories (includes college quarters off campus) (%)
People in Group quarters - Military quarters (%)
People in Group quarters - On base (%)
People in Group quarters - Barracks, unaccompanied personnel housing (UPH), (Enlisted/Officer), ;and similar group living quarters for military personnel (%)
People in Group quarters - Transient quarters for temporary residents (%)
People in Group quarters - Military ships (%)
People in Group quarters - Group homes (%)
People in Group quarters - Homes or halfway houses for drug/alcohol abuse (%)
People in Group quarters - Homes for the mentally ill (%)
People in Group quarters - Homes for the mentally retarded (%)
People in Group quarters - Homes for the physically handicapped (%)
People in Group quarters - Other group homes (%)
People in Group quarters - Religious group quarters (%)
People in Group quarters - Dormitories (%)
People in Group quarters - Agriculture workers' dormitories on farms (%)
People in Group quarters - Job Corps and vocational training facilities (%)
People in Group quarters - Other workers' dormitories (%)
People in Group quarters - Crews of maritime vessels (%)
People in Group quarters - Other nonhousehold living situations (%)
People in Group quarters - Other noninstitutional group quarters (%)
Residents speaking English at home (%)
Residents speaking English at home - Born in the United States (%)
Residents speaking English at home - Native, born elsewhere (%)
Residents speaking English at home - Foreign born (%)
Residents speaking Spanish at home (%)
Residents speaking Spanish at home - Born in the United States (%)
Residents speaking Spanish at home - Native, born elsewhere (%)
Residents speaking Spanish at home - Foreign born (%)
Residents speaking other language at home (%)
Residents speaking other language at home - Born in the United States (%)
Residents speaking other language at home - Native, born elsewhere (%)
Residents speaking other language at home - Foreign born (%)
Class of Workers - Employee of private company (%)
Class of Workers - Self-employed in own incorporated business (%)
Class of Workers - Private not-for-profit wage and salary workers (%)
Class of Workers - Local government workers (%)
Class of Workers - State government workers (%)
Class of Workers - Federal government workers (%)
Class of Workers - Self-employed workers in own not incorporated business and Unpaid family workers (%)
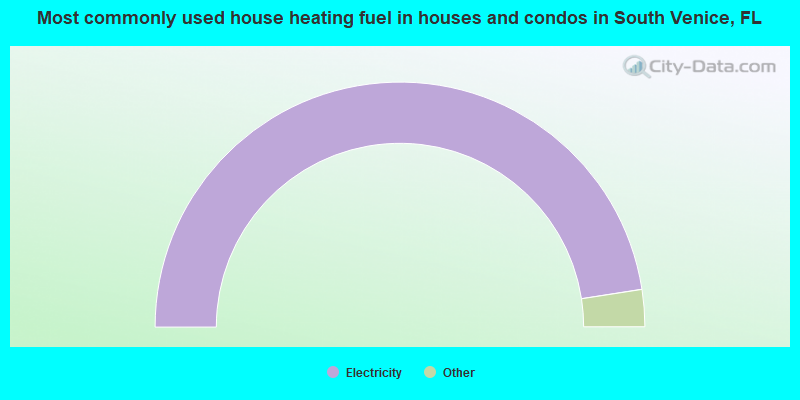
House heating fuel used in houses and condos - Utility gas (%)
House heating fuel used in houses and condos - Bottled, tank, or LP gas (%)
House heating fuel used in houses and condos - Electricity (%)
House heating fuel used in houses and condos - Fuel oil, kerosene, etc. (%)
House heating fuel used in houses and condos - Coal or coke (%)
House heating fuel used in houses and condos - Wood (%)
House heating fuel used in houses and condos - Solar energy (%)
House heating fuel used in houses and condos - Other fuel (%)
House heating fuel used in houses and condos - No fuel used (%)
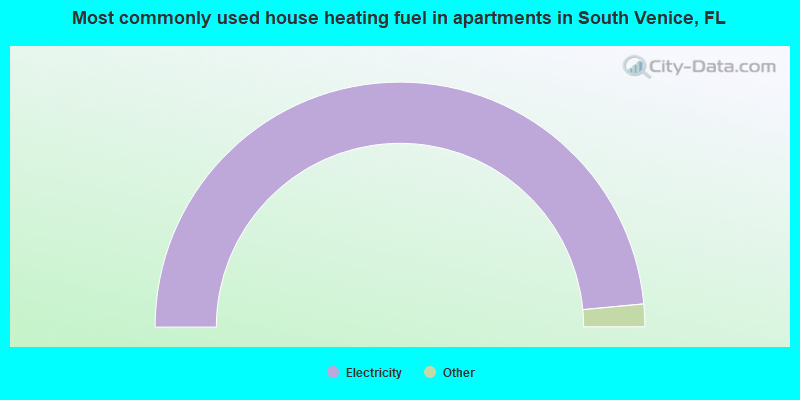
House heating fuel used in apartments - Utility gas (%)
House heating fuel used in apartments - Bottled, tank, or LP gas (%)
House heating fuel used in apartments - Electricity (%)
House heating fuel used in apartments - Fuel oil, kerosene, etc. (%)
House heating fuel used in apartments - Coal or coke (%)
House heating fuel used in apartments - Wood (%)
House heating fuel used in apartments - Solar energy (%)
House heating fuel used in apartments - Other fuel (%)
House heating fuel used in apartments - No fuel used (%)
Armed forces status - In Armed Forces (%)
Armed forces status - Civilian (%)
Armed forces status - Civilian - Veteran (%)
Armed forces status - Civilian - Nonveteran (%)
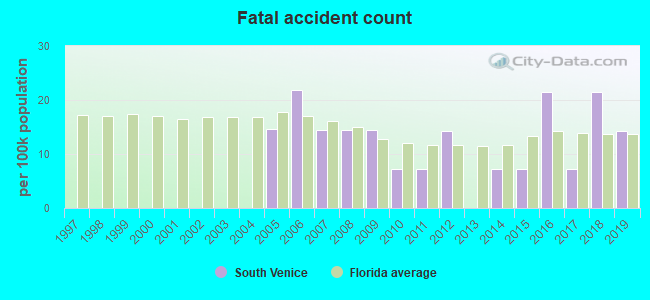
Fatal accidents locations in years 2005-2021
Fatal accidents locations in 2005
Fatal accidents locations in 2006
Fatal accidents locations in 2007
Fatal accidents locations in 2008
Fatal accidents locations in 2009
Fatal accidents locations in 2010
Fatal accidents locations in 2011
Fatal accidents locations in 2012
Fatal accidents locations in 2013
Fatal accidents locations in 2014
Fatal accidents locations in 2015
Fatal accidents locations in 2016
Fatal accidents locations in 2017
Fatal accidents locations in 2018
Fatal accidents locations in 2019
Fatal accidents locations in 2020
Fatal accidents locations in 2021
Alcohol use - People drinking some alcohol every month (%)
Alcohol use - People not drinking at all (%)
Alcohol use - Average days/month drinking alcohol
Alcohol use - Average drinks/week
Alcohol use - Average days/year people drink much
Audiometry - Average condition of hearing (%)
Audiometry - People that can hear a whisper from across a quiet room (%)
Audiometry - People that can hear normal voice from across a quiet room (%)
Audiometry - Ears ringing, roaring, buzzing (%)
Audiometry - Had a job exposure to loud noise (%)
Audiometry - Had off-work exposure to loud noise (%)
Blood Pressure & Cholesterol - Has high blood pressure (%)
Blood Pressure & Cholesterol - Checking blood pressure at home (%)
Blood Pressure & Cholesterol - Frequently checking blood cholesterol (%)
Blood Pressure & Cholesterol - Has high cholesterol level (%)
Consumer Behavior - Money monthly spent on food at supermarket/grocery store
Consumer Behavior - Money monthly spent on food at other stores
Consumer Behavior - Money monthly spent on eating out
Consumer Behavior - Money monthly spent on carryout/delivered foods
Consumer Behavior - Income spent on food at supermarket/grocery store (%)
Consumer Behavior - Income spent on food at other stores (%)
Consumer Behavior - Income spent on eating out (%)
Consumer Behavior - Income spent on carryout/delivered foods (%)
Current Health Status - General health condition (%)
Current Health Status - Blood donors (%)
Current Health Status - Has blood ever tested for HIV virus (%)
Current Health Status - Left-handed people (%)
Dermatology - People using sunscreen (%)
Diabetes - Diabetics (%)
Diabetes - Had a blood test for high blood sugar (%)
Diabetes - People taking insulin (%)
Diet Behavior & Nutrition - Diet health (%)
Diet Behavior & Nutrition - Milk product consumption (# of products/month)
Diet Behavior & Nutrition - Meals not home prepared (#/week)
Diet Behavior & Nutrition - Meals from fast food or pizza place (#/week)
Diet Behavior & Nutrition - Ready-to-eat foods (#/month)
Diet Behavior & Nutrition - Frozen meals/pizza (#/month)
Drug Use - People that ever used marijuana or hashish (%)
Drug Use - Ever used hard drugs (%)
Drug Use - Ever used any form of cocaine (%)
Drug Use - Ever used heroin (%)
Drug Use - Ever used methamphetamine (%)
Health Insurance - People covered by health insurance (%)
Kidney Conditions-Urology - Avg. # of times urinating at night
Medical Conditions - People with asthma (%)
Medical Conditions - People with anemia (%)
Medical Conditions - People with psoriasis (%)
Medical Conditions - People with overweight (%)
Medical Conditions - Elderly people having difficulties in thinking or remembering (%)
Medical Conditions - People who ever received blood transfusion (%)
Medical Conditions - People having trouble seeing even with glass/contacts (%)
Medical Conditions - People with arthritis (%)
Medical Conditions - People with gout (%)
Medical Conditions - People with congestive heart failure (%)
Medical Conditions - People with coronary heart disease (%)
Medical Conditions - People with angina pectoris (%)
Medical Conditions - People who ever had heart attack (%)
Medical Conditions - People who ever had stroke (%)
Medical Conditions - People with emphysema (%)
Medical Conditions - People with thyroid problem (%)
Medical Conditions - People with chronic bronchitis (%)
Medical Conditions - People with any liver condition (%)
Medical Conditions - People who ever had cancer or malignancy (%)
Mental Health - People who have little interest in doing things (%)
Mental Health - People feeling down, depressed, or hopeless (%)
Mental Health - People who have trouble sleeping or sleeping too much (%)
Mental Health - People feeling tired or having little energy (%)
Mental Health - People with poor appetite or overeating (%)
Mental Health - People feeling bad about themself (%)
Mental Health - People who have trouble concentrating on things (%)
Mental Health - People moving or speaking slowly or too fast (%)
Mental Health - People having thoughts they would be better off dead (%)
Oral Health - Average years since last visit a dentist
Oral Health - People embarrassed because of mouth (%)
Oral Health - People with gum disease (%)
Oral Health - General health of teeth and gums (%)
Oral Health - Average days a week using dental floss/device
Oral Health - Average days a week using mouthwash for dental problem
Oral Health - Average number of teeth
Pesticide Use - Households using pesticides to control insects (%)
Pesticide Use - Households using pesticides to kill weeds (%)
Physical Activity - People doing vigorous-intensity work activities (%)
Physical Activity - People doing moderate-intensity work activities (%)
Physical Activity - People walking or bicycling (%)
Physical Activity - People doing vigorous-intensity recreational activities (%)
Physical Activity - People doing moderate-intensity recreational activities (%)
Physical Activity - Average hours a day doing sedentary activities
Physical Activity - Average hours a day watching TV or videos
Physical Activity - Average hours a day using computer
Physical Functioning - People having limitations keeping them from working (%)
Physical Functioning - People limited in amount of work they can do (%)
Physical Functioning - People that need special equipment to walk (%)
Physical Functioning - People experiencing confusion/memory problems (%)
Physical Functioning - People requiring special healthcare equipment (%)
Prescription Medications - Average number of prescription medicines taking
Preventive Aspirin Use - Adults 40+ taking low-dose aspirin (%)
Reproductive Health - Vaginal deliveries (%)
Reproductive Health - Cesarean deliveries (%)
Reproductive Health - Deliveries resulted in a live birth (%)
Reproductive Health - Pregnancies resulted in a delivery (%)
Reproductive Health - Women breastfeeding newborns (%)
Reproductive Health - Women that had a hysterectomy (%)
Reproductive Health - Women that had both ovaries removed (%)
Reproductive Health - Women that have ever taken birth control pills (%)
Reproductive Health - Women taking birth control pills (%)
Reproductive Health - Women that have ever used Depo-Provera or injectables (%)
Reproductive Health - Women that have ever used female hormones (%)
Sexual Behavior - People 18+ that ever had sex (vaginal, anal, or oral) (%)
Sexual Behavior - Males 18+ that ever had vaginal sex with a woman (%)
Sexual Behavior - Males 18+ that ever performed oral sex on a woman (%)
Sexual Behavior - Males 18+ that ever had anal sex with a woman (%)
Sexual Behavior - Males 18+ that ever had any sex with a man (%)
Sexual Behavior - Females 18+ that ever had vaginal sex with a man (%)
Sexual Behavior - Females 18+ that ever performed oral sex on a man (%)
Sexual Behavior - Females 18+ that ever had anal sex with a man (%)
Sexual Behavior - Females 18+ that ever had any kind of sex with a woman (%)
Sexual Behavior - Average age people first had sex
Sexual Behavior - Average number of female sex partners in lifetime (males 18+)
Sexual Behavior - Average number of female vaginal sex partners in lifetime (males 18+)
Sexual Behavior - Average age people first performed oral sex on a woman (18+)
Sexual Behavior - Average number of woman performed oral sex on in lifetime (18+)
Sexual Behavior - Average number of male sex partners in lifetime (males 18+)
Sexual Behavior - Average number of male anal sex partners in lifetime (males 18+)
Sexual Behavior - Average age people first performed oral sex on a man (18+)
Sexual Behavior - Average number of male oral sex partners in lifetime (18+)
Sexual Behavior - People using protection when performing oral sex (%)
Sexual Behavior - Average number of times people have vaginal or anal sex a year
Sexual Behavior - People having sex without condom (%)
Sexual Behavior - Average number of male sex partners in lifetime (females 18+)
Sexual Behavior - Average number of male vaginal sex partners in lifetime (females 18+)
Sexual Behavior - Average number of female sex partners in lifetime (females 18+)
Sexual Behavior - Circumcised males 18+ (%)
Sleep Disorders - Average hours sleeping at night
Sleep Disorders - People that has trouble sleeping (%)
Smoking-Cigarette Use - People smoking cigarettes (%)
Taste & Smell - People 40+ having problems with smell (%)
Taste & Smell - People 40+ having problems with taste (%)
Taste & Smell - People 40+ that ever had wisdom teeth removed (%)
Taste & Smell - People 40+ that ever had tonsils teeth removed (%)
Taste & Smell - People 40+ that ever had a loss of consciousness because of a head injury (%)
Taste & Smell - People 40+ that ever had a broken nose or other serious injury to face or skull (%)
Taste & Smell - People 40+ that ever had two or more sinus infections (%)
Weight - Average height (inches)
Weight - Average weight (pounds)
Weight - Average BMI
Weight - People that are obese (%)
Weight - People that ever were obese (%)
Weight - People trying to lose weight (%)
Latest news from South Venice, FL collected exclusively by city-data.com from local newspapers, TV, and radio stations
Ancestries: American (21.2%), English (9.5%), Italian (9.4%), German (8.3%), Irish (6.1%), Polish (5.2%).
Current Local Time:
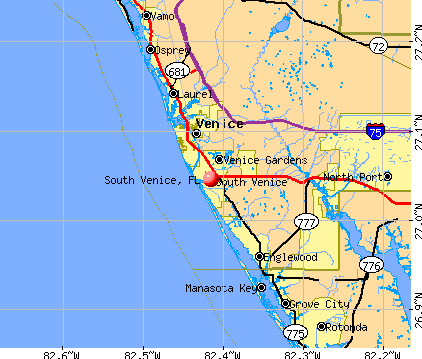
Land area: 6.21 square miles.
Population density: 2,245 people per square mile (low).
1,938 residents are foreign born (5.0% Europe , 2.9% Latin America , 1.8% Asia ).
This place:
10.5%Florida:
21.1%
Median real estate property taxes paid for housing units with mortgages in 2022: $2,131 (0.6%)Median real estate property taxes paid for housing units with no mortgage in 2022: $1,675 (0.6%)
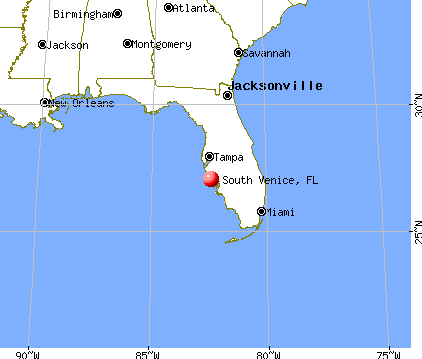
Nearest city with pop. 50,000+: Sarasota, FL
Nearest city with pop. 200,000+: St. Petersburg, FL
Nearest city with pop. 1,000,000+: Houston, TX
Nearest cities:
Latitude: 27.05 N, Longitude: 82.42 W
Daytime population change due to commuting: -5,001 (-27.2%)Workers who live and work in this place: 2,272 (26.0%)
Area code commonly used in this area: 941
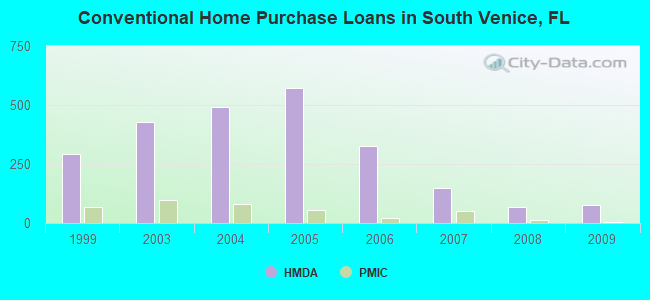
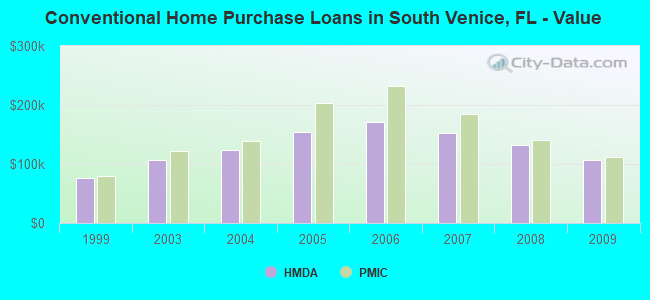
Property values in South Venice, FL
Unemployment in December 2023:
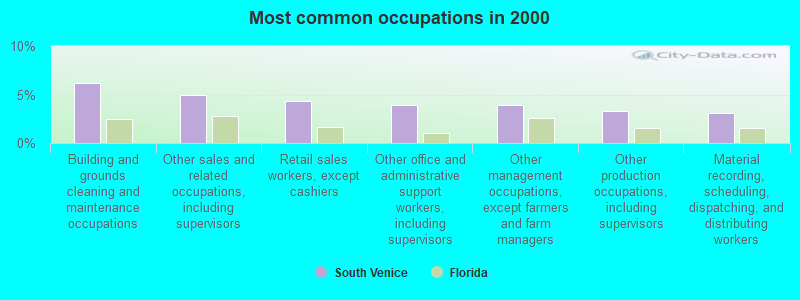
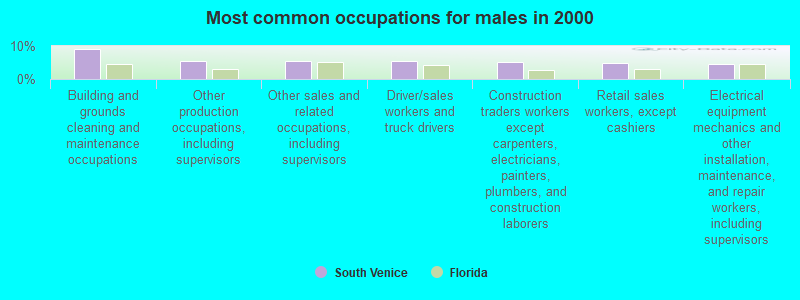
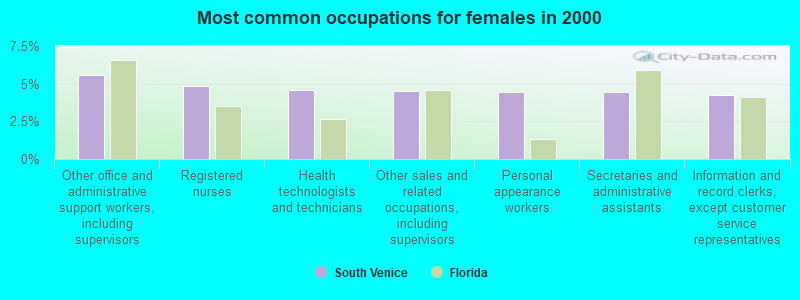
Most common occupations in South Venice, FL (%)
Both Males Females
Building and grounds cleaning and maintenance occupations (6.2%)
Other sales and related occupations, including supervisors (4.9%)
Retail sales workers, except cashiers (4.3%)
Other office and administrative support workers, including supervisors (4.0%)
Other management occupations, except farmers and farm managers (3.9%)
Other production occupations, including supervisors (3.3%)
Material recording, scheduling, dispatching, and distributing workers (3.1%)
Building and grounds cleaning and maintenance occupations (9.1%)
Other production occupations, including supervisors (5.5%)
Other sales and related occupations, including supervisors (5.4%)
Driver/sales workers and truck drivers (5.4%)
Construction traders workers except carpenters, electricians, painters, plumbers, and construction laborers (5.3%)
Retail sales workers, except cashiers (4.7%)
Electrical equipment mechanics and other installation, maintenance, and repair workers, including supervisors (4.7%)
Other office and administrative support workers, including supervisors (5.6%)
Registered nurses (4.8%)
Health technologists and technicians (4.6%)
Other sales and related occupations, including supervisors (4.5%)
Personal appearance workers (4.5%)
Secretaries and administrative assistants (4.5%)
Information and record clerks, except customer service representatives (4.3%)
Tornado activity:
South Venice-area historical tornado activity is near Florida state average. It is 5% greater than the overall U.S. average.
On 2/3/1970, a category F2 (max. wind speeds 113-157 mph) tornado 1.9 miles away from the South Venice place center caused between $50,000 and $500,000 in damages.
On 10/31/1958, a category F3 (max. wind speeds 158-206 mph) tornado 34.3 miles away from the place center injured 4 people and caused between $5000 and $50,000 in damages.
Earthquake activity:
South Venice-area historical earthquake activity is significantly above Florida state average. It is 92% smaller than the overall U.S. average. On 9/10/2006 at 14:56:08, a magnitude 5.9 (5.9 MB, 5.5 MS, 5.8 MW, Class: Moderate, Intensity: VI - VII) earthquake occurred 266.3 miles away from South Venice center On 3/31/1992 at 14:59:39, a magnitude 3.8 (3.8 MB, Depth: 3.1 mi, Class: Light, Intensity: II - III) earthquake occurred 217.1 miles away from the city center On 10/24/1997 at 08:35:17, a magnitude 4.9 (4.8 MB, 4.2 MS, 4.9 LG, Depth: 6.2 mi, Class: Light, Intensity: IV - V) earthquake occurred 407.0 miles away from the city center On 4/18/1997 at 14:57:35, a magnitude 3.9 (3.9 MB, Depth: 20.5 mi) earthquake occurred 270.7 miles away from South Venice center On 5/6/2018 at 16:47:09, a magnitude 4.6 (4.6 MB, Depth: 6.2 mi) earthquake occurred 388.5 miles away from South Venice center On 6/23/2016 at 17:20:29, a magnitude 3.8 (3.8 ML) earthquake occurred 272.2 miles away from South Venice center Magnitude types: regional Lg-wave magnitude (LG), body-wave magnitude (MB), local magnitude (ML), surface-wave magnitude (MS), moment magnitude (MW) Natural disasters: The number of natural disasters in Sarasota County (27) is a lot greater than the US average (15).Major Disasters (Presidential) Declared: 17Emergencies Declared: 5Hurricanes: 10, Tropical Storms: 6, Fires: 5, Floods: 5, Storms: 4, Tornadoes: 2, Freeze: 1, Wind: 1, Other: 1 (Note: some incidents may be assigned to more than one category). Hospitals and medical centers near South Venice: VENICE KIDNEY CENTER (Dialysis Facility, about 3 miles away; VENICE, FL)
SUNSET LAKE HEALTH AND REHABILITATION CENTER (Nursing Home, about 3 miles away; VENICE, FL)
VENICE NURSING AND REHAB CENTER (Nursing Home, about 3 miles away; VENICE, FL)
VILLAGE ON THE ISLE (Nursing Home, about 4 miles away; VENICE, FL)
HOME HEALTH SERVICES OF VENICE (Home Health Center, about 4 miles away; VENICE, FL)
HEARTLAND HOME HEALTH CARE (Home Health Center, about 4 miles away; ENGLEWOOD, FL)
VENICE REGIONAL MEDICAL CENTER (about 4 miles away; VENICE, FL)
Amtrak station near South Venice: 16 miles: SARASOTA (I-75 AT CLARK RD.) - Bus Station Services: public payphones, snack bar, free short-term parking, paid long-term parking.
Colleges/universities with over 2000 students nearest to South Venice:
State College of Florida-Manatee-Sarasota (about 30 miles; Bradenton, FL ; Full-time enrollment: 8,012)
Edison State College (about 48 miles; Fort Myers, FL ; FT enrollment: 10,649)
Eckerd College (about 50 miles; Saint Petersburg, FL ; FT enrollment: 2,437)
University of South Florida-St Petersburg (about 52 miles; St. Petersburg, FL ; FT enrollment: 4,459)
Florida Gulf Coast University (about 57 miles; Fort Myers, FL ; FT enrollment: 11,165)
Hillsborough Community College (about 62 miles; Tampa, FL ; FT enrollment: 19,838)
St Petersburg College (about 63 miles; Clearwater, FL ; FT enrollment: 21,467)
Sarasota County has a predicted average indoor radon screening level less than 2 pCi/L (pico curies per liter) - Low Potential Average household size: This place:
2.2 peopleFlorida:
2.5 people
Percentage of family households: This place:
62.2%Whole state:
65.2%
Percentage of households with unmarried partners: This place:
7.7%Whole state:
7.3%
Likely homosexual households (counted as self-reported same-sex unmarried-partner households)
Lesbian couples: 0.5% of all households Gay men: 0.4% of all households
4 people in emergency and transitional shelters (with sleeping facilities) for people experiencing homelessness in 2010people in group homes intended for adults in 2010
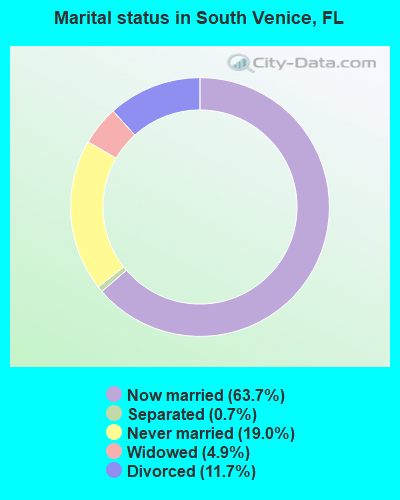
For population 15 years and over in South Venice:
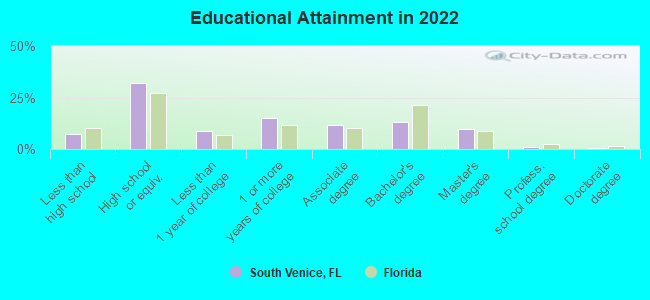
Never married: 19.0%Now married: 63.7%Separated: 0.7%Widowed: 4.9%Divorced: 11.7% For population 25 years and over in South Venice:
High school or higher: 92.1%Bachelor's degree or higher: 22.8%Graduate or professional degree: 10.6%Unemployed: 3.9%Mean travel time to work (commute): 19.1 minutes
Education Gini index (Inequality in education) Here:
9.2Florida average:
12.2
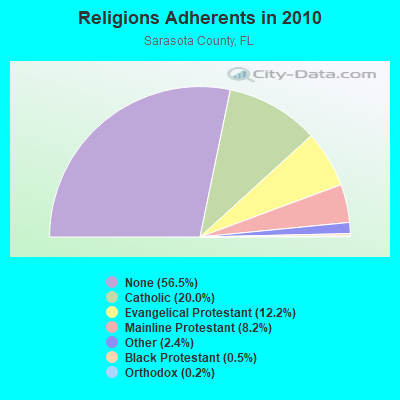
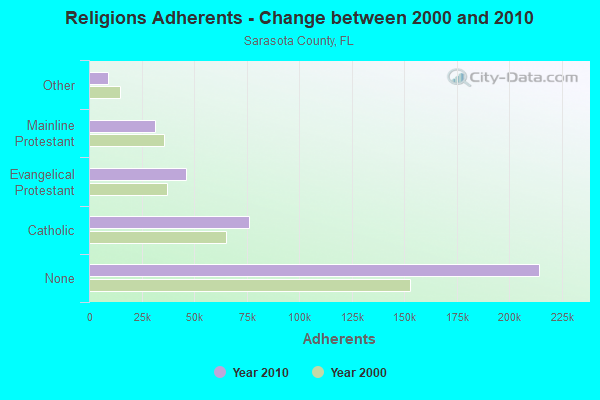
Religion statistics for South Venice, FL (based on Sarasota County data)
Religion Adherents Congregations Catholic 76,000 13 Evangelical Protestant 46,290 174 Mainline Protestant 31,191 58 Other 9,089 38 Black Protestant 1,901 7 Orthodox 620 2 None 214,357 -
Source: Clifford Grammich, Kirk Hadaway, Richard Houseal, Dale E.Jones, Alexei Krindatch, Richie Stanley and Richard H.Taylor. 2012. 2010 U.S.Religion Census: Religious Congregations & Membership Study. Association of Statisticians of American Religious Bodies. Jones, Dale E., et al. 2002. Congregations and Membership in the United States 2000. Nashville, TN: Glenmary Research Center. Graphs represent county-level data
Food Environment Statistics: Number of grocery stores : 67Sarasota County :
1.81 / 10,000 pop.Florida :
2.04 / 10,000 pop.
Number of supercenters and club stores : 3Sarasota County :
0.08 / 10,000 pop.Florida :
0.11 / 10,000 pop.
Number of convenience stores (no gas) : 47This county :
1.27 / 10,000 pop.Florida :
1.28 / 10,000 pop.
Number of convenience stores (with gas) : 84Here :
2.26 / 10,000 pop.Florida :
3.04 / 10,000 pop.
Number of full-service restaurants : 366Sarasota County :
9.87 / 10,000 pop.State :
7.45 / 10,000 pop.
Adult diabetes rate : Sarasota County :
9.1%Florida :
9.2%
Adult obesity rate : This county :
20.1%State :
23.7%
Low-income preschool obesity rate : Sarasota County :
12.4%Florida :
14.0%
Health and Nutrition:
Average overall health of teeth and gums : This city:
53.8%State:
49.4%
Average BMI : This city:
28.6Florida:
28.6
People feeling badly about themselves : South Venice:
18.9%State:
19.5%
People not drinking alcohol at all : South Venice:
9.1%Florida:
10.7%
Average hours sleeping at night : Overweight people : South Venice:
36.9%Florida:
34.7%
General health condition : South Venice:
59.9%Florida:
57.0%
Average condition of hearing : South Venice:
77.7%State:
79.2%
More about Health and Nutrition of South Venice, FL Residents
11.25% of this county's 2021 resident taxpayers lived in other counties in 2020 ($164,585 average adjusted gross income )
Here:
11.25%Florida average:
8.80%
0.02% of residents moved from foreign countries ($156 average AGI )Sarasota County:
0.02%Florida average:
0.05%
Top counties from which taxpayers relocated into this county between 2020 and 2021:
7.51% of this county's 2020 resident taxpayers moved to other counties in 2021 ($100,435 average adjusted gross income )
Here:
7.51%Florida average:
7.45%
0.02% of residents moved to foreign countries ($122 average AGI )Sarasota County:
0.02%Florida average:
0.04%
Top counties to which taxpayers relocated from this county between 2020 and 2021: Strongest AM radio stations in South Venice:
WAMR (1320 AM; 5 kW; VENICE, FL; Owner: CITICASTERS LICENSES, L.P.)
WMGG (820 AM; 50 kW; LARGO, FL; Owner: MEGA COMMUNICATIONS OF ST. PETERSBURG LICENSEE)
WLSS (930 AM; 5 kW; SARASOTA, FL; Owner: WGUL-FM, INC.)
WQYK (1010 AM; 50 kW; SEFFNER, FL; Owner: INFINITY BROADCASTING CORPORATION OF TAMPA)
WENG (1530 AM; daytime; 1 kW; ENGLEWOOD, FL)
WIBQ (1220 AM; 5 kW; SARASOTA, FL; Owner: NOVA BROADCASTING COMPANY)
WFLF (540 AM; 50 kW; PINE HILLS, FL; Owner: CLEAR CHANNEL BROADCASTING LICENSES, INC.)
WPTK (1200 AM; 10 kW; PINE ISLAND CENTER, FL; Owner: FORT MYERS BROADCASTING COMPANY)
WWCN (770 AM; 10 kW; NORTH FORT MYERS, FL; Owner: WJPT LICENSE LIMITED PARTNERSHIP)
WFLA (970 AM; 25 kW; TAMPA, FL; Owner: CITICASTERS LICENSES, L.P.)
WQTM (740 AM; 50 kW; ORLANDO, FL; Owner: CLEAR CHANNEL BROADCASTING LICENSES, INC.)
WJNA (640 AM; 38 kW; ROYAL PALM BEACH, FL; Owner: SOUTH FLORIDA RADIO, INC.)
WKII (1070 AM; 3 kW; SOLANA, FL; Owner: CLEAR CHANNEL BROADCASTING LICENSES, INC.)
Strongest FM radio stations in South Venice:
WDDV (92.1 FM; VENICE, FL; Owner: CITICASTERS LICENSES, L.P.)
WSMR (89.1 FM; SARASOTA, FL; Owner: NORTHWESTERN COLLEGE)
WTZB (105.9 FM; ENGLEWOOD, FL; Owner: CITICASTERS LICENSES, L.P.)
WJIS (88.1 FM; BRADENTON, FL; Owner: RADIO TRAINING NETWORK, INC.)
WSRZ-FM (107.9 FM; CORAL COVE, FL; Owner: CITICASTERS LICENSES, L.P.)
WIKX (92.9 FM; CHARLOTTE HARBOR, FL; Owner: CITICASTERS LICENSES, L.P.)
WHPT (102.5 FM; SARASOTA, FL; Owner: CXR HOLDINGS, INC.)
WINK-FM (96.9 FM; FORT MYERS, FL; Owner: FORT MYERS BROADCASTING COMPANY)
WBCG (98.9 FM; MURDOCK, FL; Owner: CONCORD MEDIA GROUP, INC.)
WCTQ (106.5 FM; SARASOTA, FL; Owner: CITICASTERS LICENSES, L.P.)
WRXK-FM (96.1 FM; BONITA SPRINGS, FL; Owner: WRXK LICENSE LIMITED PARTNERSHIP)
WXKB (103.9 FM; CAPE CORAL, FL; Owner: WXKB LICENSE LIMITED PARTNERSHIP)
WSEB (91.3 FM; ENGLEWOOD, FL; Owner: SUNCOAST EDUCATIONAL B/CNG CORP.)
WKZM (104.3 FM; SARASOTA, FL; Owner: THE MOODY BIBLE INSTITUTE OF CHICAGO)
WSJT (94.1 FM; LAKELAND, FL; Owner: INFINITY RADIO OPERATIONS INC.)
WPOI (101.5 FM; ST. PETERSBURG, FL; Owner: CXR HOLDINGS, INC.)
WWRM (94.9 FM; TAMPA, FL; Owner: COX RADIO, INC.)
WCKT (100.1 FM; PORT CHARLOTTE, FL; Owner: CLEAR CHANNEL BROADCASTING LICENSES, INC.)
WOLZ (95.3 FM; FORT MYERS, FL; Owner: CLEAR CHANNEL BROADCASTING LICENSES, INC.)
WCVU (104.9 FM; SOLANA, FL; Owner: CITICASTERS LICENSES, L.P.)
TV broadcast stations around South Venice:
WVEA-TV (Channel 62; VENICE, FL; Owner: ENTRAVISION HOLDINGS, LLC)
W56CN (Channel 56; VENICE, FL; Owner: WMOR-TV COMPANY)
WINK-TV (Channel 11; FORT MYERS, FL; Owner: FORT MYERS BROADCASTING COMPANY)
WFTX (Channel 36; CAPE CORAL, FL; Owner: EMMIS TELEVISION LICENSE CORPORATION)
WTVK (Channel 46; NAPLES, FL; Owner: ACME TELEVISION LICENSES OF FLORIDA, LLC)
WBBH-TV (Channel 20; FORT MYERS, FL; Owner: WATERMAN BROADCASTING CORP. OF FLORIDA)
WEDU (Channel 3; TAMPA, FL; Owner: FLORIDA WEST COAST PUBLIC BROADCASTING, INC.)
WRXY-TV (Channel 49; TICE, FL; Owner: WEST COAST CHRISTIAN TELEVISION, INC)
W48CN (Channel 48; SARASOTA, FL; Owner: NATIONAL MINORITY T.V., INC.)
WXPX (Channel 66; BRADENTON, FL; Owner: PAXSON COMMUNICATION LICENSE COMPANY, LLC)
WTOG (Channel 44; ST. PETERSBURG, FL; Owner: VIACOM INTERNATIONAL INC.)
WWSB (Channel 40; SARASOTA, FL; Owner: SOUTHERN BROADCAST CORPORATION OF SARASOTA)
W17CK (Channel 17; PORT CHARLOTTE, FL; Owner: TRINITY BROADCASTING NETWORK)
WGCU (Channel 30; FT. MYERS, FL; Owner: BOARD OF TRUSTEES, FLORIDA GULF COAST UNIVERSITY)
WSVT-LP (Channel 18; BRADENTON, FL; Owner: WORD OF GOD FELLOWSHIP, INC.)
W34AW (Channel 34; SARASOTA, FL; Owner: THREE ANGELS BROADCASTING NETWORK, INC.)
National Bridge Inventory (NBI) Statistics 3 Number of bridges26ft / 7.6m Total length44,010 Total average daily traffic2,230 Total average daily truck traffic76,358 Total future (year 2041) average daily traffic
FCC Registered Antenna Towers: 13 (
See the full list of FCC Registered Antenna Towers in South Venice )
FCC Registered Microwave Towers: 2
TA60XC158, 3730 Cadbury Circle Bldg 2 (Lat: 27.053056 Lon: -82.399722), Type: Bant, Structure height: 38.7 m, Call Sign: WQSJ658, Assigned Frequencies: 17765.0 MHz, 17815.0 MHz, 17765.0 MHz, 17815.0 MHz, 17765.0 MHz, 17815.0 MHz, 17765.0 MHz, 17815.0 MHz, 17765.0 MHz, 17815.0 MHz, 17765.0 MHz, 17815.0 MHz, Grant Date: 09/27/2013, Expiration Date: 09/27/2023, Cancellation Date: 05/09/2023, Certifier: Jenny Knopf, Registrant: T-Mobile Usa, Inc., 12920 Se 38th Street, Bellevue, WA 98006, Phone: (425) 383-8401, Email:
R L ANDERSON, 4000 S Tamiami Trail (Lat: 27.048472 Lon: -82.400278), Type: Ltower, Structure height: 21.3 m, Call Sign: WREW479, Assigned Frequencies: 11645.0 MHz, 11645.0 MHz, 11645.0 MHz, 11645.0 MHz, 11645.0 MHz, 11645.0 MHz, 11645.0 MHz, 11645.0 MHz, 11645.0 MHz, 11645.0 MHz, Grant Date: 12/13/2019, Expiration Date: 12/13/2029, Certifier: Bill Rhodes, Registrant: Alpha-Omega Communications, LLC, Po Box 5159, Sarasota, FL 34277, Phone: (641) 350-9618, Email:
FCC Registered Maritime Coast & Aviation Ground Towers: 1
Brdg Tender Cntrl Hse Venice Bridge On Us41 Over Intercoastal Waterway (Lat: 27.078667 Lon: -82.430361), Type: Building, Overall height: 4 m, Call Sign: WHW339, Assigned Frequencies: 156.650 MHz, 156.800 MHz, 156.450 MHz, 156.600 MHz, Grant Date: 04/02/2021, Expiration Date: 06/21/2031, Registrant: State Of Florida, 605 Suwannee Street, Ms 90, Tallahassee, FL 32399-0450, Phone: (850) 410-5600, Fax: (850) 410-5601, Email:
FCC Registered Amateur Radio Licenses: 1
Call Sign: KA4UNK, Grant Date: 03/29/1988, Expiration Date: 03/29/1998, Cancellation Date: 03/30/2000, Registrant: Tom Hibbert, 980 Jamaica Rd, South Venice, FL 34293
Home Mortgage Disclosure Act Aggregated Statistics For Year 2009(Based on 2 full and 2 partial tracts) A) FHA, FSA/RHS & VA B) Conventional C) Refinancings D) Home Improvement Loans F) Non-occupant Loans on G) Loans On Manufactured Number Average Value Number Average Value Number Average Value Number Average Value Number Average Value Number Average Value
LOANS ORIGINATED 38 $112,103 76 $107,267 115 $126,451 8 $75,005 48 $103,372 1 $52,000 APPLICATIONS APPROVED, NOT ACCEPTED 3 $116,503 9 $96,943 13 $139,415 3 $36,660 6 $93,627 1 $51,000 APPLICATIONS DENIED 9 $119,698 17 $90,722 86 $152,842 10 $40,779 21 $122,778 3 $84,467 APPLICATIONS WITHDRAWN 3 $140,110 15 $96,666 60 $134,382 4 $138,372 10 $89,430 0 $0 FILES CLOSED FOR INCOMPLETENESS 1 $62,480 2 $170,985 12 $120,068 0 $0 3 $154,333 0 $0
Aggregated Statistics For Year 2008(Based on 2 full and 2 partial tracts) A) FHA, FSA/RHS & VA B) Conventional C) Refinancings D) Home Improvement Loans F) Non-occupant Loans on G) Loans On Manufactured Number Average Value Number Average Value Number Average Value Number Average Value Number Average Value Number Average Value
LOANS ORIGINATED 46 $131,610 68 $132,847 132 $137,658 12 $42,794 37 $112,812 1 $3,000 APPLICATIONS APPROVED, NOT ACCEPTED 3 $100,300 11 $132,042 34 $115,866 9 $34,326 9 $120,509 0 $0 APPLICATIONS DENIED 10 $164,907 14 $142,169 121 $167,714 26 $76,258 17 $121,582 2 $47,500 APPLICATIONS WITHDRAWN 6 $138,898 13 $123,461 35 $166,270 1 $104,860 8 $98,781 0 $0 FILES CLOSED FOR INCOMPLETENESS 2 $122,960 1 $319,170 13 $183,699 1 $19,580 3 $134,750 0 $0
Aggregated Statistics For Year 2007(Based on 2 full and 2 partial tracts) A) FHA, FSA/RHS & VA B) Conventional C) Refinancings D) Home Improvement Loans F) Non-occupant Loans on G) Loans On Manufactured Number Average Value Number Average Value Number Average Value Number Average Value Number Average Value Number Average Value
LOANS ORIGINATED 15 $156,232 149 $153,319 318 $150,117 43 $96,435 84 $145,708 0 $0 APPLICATIONS APPROVED, NOT ACCEPTED 3 $148,480 20 $153,206 76 $152,201 6 $131,128 13 $191,369 0 $0 APPLICATIONS DENIED 9 $160,128 60 $157,169 256 $175,819 53 $104,923 45 $189,983 5 $70,718 APPLICATIONS WITHDRAWN 0 $0 17 $168,759 114 $176,138 11 $94,988 9 $152,786 0 $0 FILES CLOSED FOR INCOMPLETENESS 0 $0 8 $160,331 46 $182,223 4 $97,580 6 $159,293 0 $0
Aggregated Statistics For Year 2006(Based on 2 full and 2 partial tracts) A) FHA, FSA/RHS & VA B) Conventional C) Refinancings D) Home Improvement Loans E) Loans on Dwellings For 5+ Families F) Non-occupant Loans on G) Loans On Manufactured Number Average Value Number Average Value Number Average Value Number Average Value Number Average Value Number Average Value Number Average Value
LOANS ORIGINATED 8 $230,996 328 $172,026 538 $160,689 71 $81,245 1 $1,118,880 160 $181,247 1 $26,110 APPLICATIONS APPROVED, NOT ACCEPTED 1 $236,830 69 $196,035 101 $159,309 13 $63,015 0 $0 31 $197,231 2 $26,000 APPLICATIONS DENIED 2 $163,665 68 $151,733 224 $174,402 57 $75,070 0 $0 33 $154,698 1 $88,000 APPLICATIONS WITHDRAWN 5 $171,768 27 $173,923 189 $157,939 22 $118,361 0 $0 19 $170,423 0 $0 FILES CLOSED FOR INCOMPLETENESS 0 $0 13 $139,139 95 $183,682 2 $44,495 0 $0 11 $142,878 0 $0
Aggregated Statistics For Year 2005(Based on 2 full and 2 partial tracts) A) FHA, FSA/RHS & VA B) Conventional C) Refinancings D) Home Improvement Loans F) Non-occupant Loans on G) Loans On Manufactured Number Average Value Number Average Value Number Average Value Number Average Value Number Average Value Number Average Value
LOANS ORIGINATED 13 $183,098 571 $154,815 689 $142,751 78 $100,679 281 $155,921 4 $75,250 APPLICATIONS APPROVED, NOT ACCEPTED 0 $0 45 $148,258 76 $152,008 12 $43,442 26 $166,188 2 $61,910 APPLICATIONS DENIED 2 $143,650 89 $188,890 262 $133,721 55 $75,527 29 $152,373 0 $0 APPLICATIONS WITHDRAWN 5 $172,838 49 $130,722 193 $147,455 39 $115,493 32 $136,358 0 $0 FILES CLOSED FOR INCOMPLETENESS 0 $0 20 $162,730 137 $154,031 7 $141,381 11 $136,724 0 $0
Aggregated Statistics For Year 2004(Based on 2 full and 2 partial tracts) A) FHA, FSA/RHS & VA B) Conventional C) Refinancings D) Home Improvement Loans F) Non-occupant Loans on G) Loans On Manufactured Number Average Value Number Average Value Number Average Value Number Average Value Number Average Value Number Average Value
LOANS ORIGINATED 19 $134,272 491 $123,345 554 $114,687 42 $52,855 238 $117,209 4 $72,750 APPLICATIONS APPROVED, NOT ACCEPTED 1 $181,200 49 $138,744 84 $105,090 17 $42,384 24 $104,551 2 $64,000 APPLICATIONS DENIED 8 $136,489 87 $127,438 246 $109,910 42 $50,701 39 $120,256 3 $41,037 APPLICATIONS WITHDRAWN 1 $174,750 53 $125,221 175 $111,326 16 $70,663 26 $120,419 0 $0 FILES CLOSED FOR INCOMPLETENESS 0 $0 12 $114,761 74 $110,612 6 $47,965 5 $130,890 0 $0
Aggregated Statistics For Year 2003(Based on 2 full and 2 partial tracts) A) FHA, FSA/RHS & VA B) Conventional C) Refinancings D) Home Improvement Loans F) Non-occupant Loans on Number Average Value Number Average Value Number Average Value Number Average Value Number Average Value
LOANS ORIGINATED 37 $123,899 429 $106,274 1,018 $94,720 38 $37,704 207 $93,914 APPLICATIONS APPROVED, NOT ACCEPTED 5 $89,932 42 $95,630 133 $92,300 16 $17,504 21 $82,419 APPLICATIONS DENIED 7 $104,659 60 $104,667 389 $98,137 28 $28,069 27 $95,301 APPLICATIONS WITHDRAWN 4 $125,552 39 $106,263 151 $104,894 4 $32,960 14 $90,335 FILES CLOSED FOR INCOMPLETENESS 2 $113,535 12 $104,259 44 $90,226 4 $46,558 5 $107,002
Aggregated Statistics For Year 1999(Based on 1 full and 1 partial tracts) A) FHA, FSA/RHS & VA B) Conventional C) Refinancings D) Home Improvement Loans F) Non-occupant Loans on Number Average Value Number Average Value Number Average Value Number Average Value Number Average Value
LOANS ORIGINATED 75 $79,805 291 $76,134 269 $64,023 37 $17,631 79 $71,947 APPLICATIONS APPROVED, NOT ACCEPTED 2 $88,030 34 $69,770 65 $64,195 23 $24,139 8 $74,135 APPLICATIONS DENIED 6 $88,620 63 $74,425 164 $61,900 50 $19,937 8 $57,144 APPLICATIONS WITHDRAWN 5 $85,620 21 $77,419 119 $64,384 5 $26,476 7 $72,380 FILES CLOSED FOR INCOMPLETENESS 1 $91,680 6 $76,130 19 $66,653 1 $46,800 1 $65,020
Detailed HMDA statistics for the following Tracts:
0025.03
, 0025.07 , 0025.08 , 0025.09
Private Mortgage Insurance Companies Aggregated Statistics For Year 2009(Based on 2 full and 2 partial tracts) A) Conventional B) Refinancings Number Average Value Number Average Value
LOANS ORIGINATED 3 $111,467 0 $0 APPLICATIONS APPROVED, NOT ACCEPTED 1 $93,000 0 $0 APPLICATIONS DENIED 0 $0 2 $95,435 APPLICATIONS WITHDRAWN 0 $0 0 $0 FILES CLOSED FOR INCOMPLETENESS 0 $0 0 $0
Aggregated Statistics For Year 2008(Based on 2 full and 2 partial tracts) A) Conventional B) Refinancings C) Non-occupant Loans on Number Average Value Number Average Value Number Average Value
LOANS ORIGINATED 14 $140,341 11 $146,189 6 $130,522 APPLICATIONS APPROVED, NOT ACCEPTED 4 $206,805 6 $165,525 4 $102,282 APPLICATIONS DENIED 1 $142,660 4 $168,425 1 $176,790 APPLICATIONS WITHDRAWN 1 $188,180 2 $177,300 0 $0 FILES CLOSED FOR INCOMPLETENESS 0 $0 0 $0 0 $0
Aggregated Statistics For Year 2007(Based on 2 full and 2 partial tracts) A) Conventional B) Refinancings C) Non-occupant Loans on Number Average Value Number Average Value Number Average Value
LOANS ORIGINATED 49 $184,368 22 $187,869 10 $196,528 APPLICATIONS APPROVED, NOT ACCEPTED 5 $209,272 3 $168,837 0 $0 APPLICATIONS DENIED 1 $130,540 1 $174,000 1 $130,540 APPLICATIONS WITHDRAWN 1 $231,240 1 $374,660 1 $231,240 FILES CLOSED FOR INCOMPLETENESS 0 $0 0 $0 0 $0
Aggregated Statistics For Year 2006(Based on 2 full and 2 partial tracts) A) Conventional B) Refinancings C) Non-occupant Loans on Number Average Value Number Average Value Number Average Value
LOANS ORIGINATED 21 $232,905 10 $220,515 3 $172,157 APPLICATIONS APPROVED, NOT ACCEPTED 3 $237,303 2 $187,925 1 $222,400 APPLICATIONS DENIED 0 $0 0 $0 0 $0 APPLICATIONS WITHDRAWN 1 $263,260 2 $207,500 0 $0 FILES CLOSED FOR INCOMPLETENESS 0 $0 0 $0 0 $0
Aggregated Statistics For Year 2005(Based on 2 full and 2 partial tracts) A) Conventional B) Refinancings C) Non-occupant Loans on Number Average Value Number Average Value Number Average Value
LOANS ORIGINATED 54 $203,293 17 $193,395 15 $204,514 APPLICATIONS APPROVED, NOT ACCEPTED 22 $209,954 12 $164,284 11 $192,890 APPLICATIONS DENIED 0 $0 0 $0 0 $0 APPLICATIONS WITHDRAWN 5 $228,404 5 $156,814 1 $111,590 FILES CLOSED FOR INCOMPLETENESS 0 $0 0 $0 0 $0
Aggregated Statistics For Year 2004(Based on 2 full and 2 partial tracts) A) Conventional B) Refinancings C) Non-occupant Loans on Number Average Value Number Average Value Number Average Value
LOANS ORIGINATED 80 $139,093 23 $134,110 27 $133,739 APPLICATIONS APPROVED, NOT ACCEPTED 19 $146,707 5 $127,524 3 $136,127 APPLICATIONS DENIED 0 $0 1 $111,890 0 $0 APPLICATIONS WITHDRAWN 7 $131,037 5 $149,174 2 $155,440 FILES CLOSED FOR INCOMPLETENESS 0 $0 4 $146,758 0 $0
Aggregated Statistics For Year 2003(Based on 2 full and 2 partial tracts) A) Conventional B) Refinancings C) Non-occupant Loans on Number Average Value Number Average Value Number Average Value
LOANS ORIGINATED 99 $122,779 64 $113,922 26 $102,757 APPLICATIONS APPROVED, NOT ACCEPTED 19 $131,408 10 $140,789 2 $129,195 APPLICATIONS DENIED 1 $119,000 2 $125,270 1 $119,000 APPLICATIONS WITHDRAWN 8 $130,930 2 $113,945 2 $92,755 FILES CLOSED FOR INCOMPLETENESS 0 $0 0 $0 0 $0
Aggregated Statistics For Year 1999(Based on 1 full and 1 partial tracts) A) Conventional B) Refinancings C) Non-occupant Loans on Number Average Value Number Average Value Number Average Value
LOANS ORIGINATED 66 $79,750 21 $79,951 8 $68,576 APPLICATIONS APPROVED, NOT ACCEPTED 6 $79,310 5 $77,590 2 $97,420 APPLICATIONS DENIED 6 $88,480 2 $81,660 1 $54,440 APPLICATIONS WITHDRAWN 6 $92,413 0 $0 0 $0 FILES CLOSED FOR INCOMPLETENESS 1 $93,690 2 $57,785 0 $0
Detailed PMIC statistics for the following Tracts:
0025.03
, 0025.07 , 0025.08 , 0025.09 South Venice compared to Florida state average:
Unemployed percentage significantly below state average. Black race population percentage significantly below state average. Hispanic race population percentage below state average. Median age significantly above state average. Renting percentage below state average. Length of stay since moving in significantly above state average. South Venice on our top lists :
#37 on the list of "Top 101 cities with the most residents born in Europe, n.e.c. (population 500+)"
#94 on the list of "Top 101 cities with largest percentage of males in occupations: healthcare support occupations (population 5,000+)"
#2 on the list of "Top 101 counties with the largest number of people without health insurance coverage in 2000 (pop. 50,000+)"
#4 on the list of "Top 101 counties with the largest decrease in the number of infant deaths per 1000 residents 2000-2006 to 2007-2013 (pop. 50,000+)"
#5 on the list of "Top 101 counties with the lowest number of births per 1000 residents 2007-2013"
#6 on the list of "Top 101 counties with the lowest number of infant deaths per 1000 residents 2007-2013 (pop. 50,000+)"
#16 on the list of "Top 101 counties with the highest number of deaths per 1000 residents 2007-2013 (pop. 50,000+)"


 Recent articles from our blog. Our writers, many of them Ph.D. graduates or candidates, create easy-to-read articles on a wide variety of topics.

 (21.5 miles