South Venice, FL (Florida) Houses and Residents
| South Venice: | $321,515 |
| Florida: | $354,100 |
Total population: 13,949 (Urban population: 13,493, Rural population: 17 (all nonfarm))
Houses: 8,991 (7,545 occupied: 6,432 owner occupied, 1,356 renter occupied)
| % of renters here: | 17% |
| State: | 33% |
Housing density: 1,447 houses/condos per square mile
Median price asked for vacant for-sale houses and condos in 2022: $155,034.
Median contract rent in 2022: $1,579 (lower quartile is $1,132, upper quartile is $1,947)
Median rent asked for vacant for-rent units in 2022: $3,972
Median gross rent in South Venice, FL in 2022: $1,712
Housing units in South Venice with a mortgage: 4,069 (344 second mortgage, 14 home equity loan, 274 both second mortgage and home equity loan)
Houses without a mortgage: 177
Median household income for houses/condos with a mortgage: $85,977
Median household income for apartments without a mortgage: $59,324
Median monthly housing costs: $1,294
Compare current foreclosures near South Venice, FL:
| Photo | Address | Area | Beds / Baths | Price | Details |
|---|---|---|---|---|---|

|
#1
Gladstone Blvd
Englewood, FL 34223
|
1,865 sq. feet
|
2 baths 3 beds |
$260,000
|
show details |

|
#2
Gull Rd
Venice, FL 34293
|
1,101 sq. feet
|
2 baths 2 beds |
$310,000
|
show details |

|
#3
Magnolia Rd
Venice, FL 34293
|
1,324 sq. feet
|
2 baths 2 beds |
show details | |

|
#4
Balboa Ter
North Port, FL 34291
|
1,608 sq. feet
|
2 baths 3 beds |
show details | |

|
#5
Knightsbridge Cir
Sarasota, FL 34238
|
1,499 sq. feet
|
2 baths 3 beds |
show details | |

|
#6
Vanessa Ave
Englewood, FL 34224
|
906 sq. feet
|
2 baths 2 beds |
show details | |

|
#7
Osprey Point Dr
Osprey, FL 34229
|
3,541 sq. feet
|
3 baths 3 beds |
show details | |

|
#8
S Venice Blvd
Venice, FL 34293
|
1,731 sq. feet
|
2 baths 3 beds |
show details | |

|
#9
Fernwalk Ln
Osprey, FL 34229
|
3,396 sq. feet
|
3 baths 3 beds |
show details | |

|
#10
Ponce De Leon Blvd
North Port, FL 34291
|
- sq. feet
|
2 baths 3 beds |
show details |
| Photo | Address | Area | Beds / Baths | Price | Details |
|---|---|---|---|---|---|

|
#11
Malamin Rd
North Port, FL 34287
|
1,884 sq. feet
|
2 baths 3 beds |
show details | |

|
#12
Snow Dr
Englewood, FL 34224
|
1,326 sq. feet
|
2 baths 2 beds |
show details | |

|
#13
Wagon Wheel Dr
North Port, FL 34291
|
2,450 sq. feet
|
2 baths 4 beds |
show details | |

|
#14
Kenwood Dr
North Port, FL 34287
|
1,237 sq. feet
|
2 baths 2 beds |
show details | |

|
#15
Stardust Ave
North Port, FL 34287
|
1,176 sq. feet
|
2 baths 3 beds |
show details | |

|
#16
Mill Run Ct
North Port, FL 34287
|
997 sq. feet
|
2 baths 2 beds |
show details | |

|
#17
Bayhead Ln
Osprey, FL 34229
|
2,780 sq. feet
|
3 baths 3 beds |
show details | |

|
#18
Sylvania Ave
North Port, FL 34291
|
1,443 sq. feet
|
2 baths 3 beds |
show details | |

|
#19
De Garmo St
North Port, FL 34291
|
1,732 sq. feet
|
2 baths 3 beds |
show details | |

|
#20
Mill Run Ct
North Port, FL 34287
|
1,176 sq. feet
|
2 baths 2 beds |
show details |
| Photo | Address | Area | Beds / Baths | Price | Details |
|---|---|---|---|---|---|

|
#21
Pebble Creek Ln
Sarasota, FL 34238
|
1,766 sq. feet
|
2 baths 2 beds |
show details | |

|
#22
Dongola St
North Port, FL 34291
|
2,133 sq. feet
|
2 baths 3 beds |
show details | |

|
#23
Chiffon Ln
North Port, FL 34287
|
1,916 sq. feet
|
2 baths 3 beds |
show details | |

|
#24
Chard Ter
Port Charlotte, FL 33981
|
1,370 sq. feet
|
2 baths 2 beds |
show details | |

|
#25
Torino St
North Port, FL 34287
|
1,862 sq. feet
|
2 baths 3 beds |
show details | |

|
#26
Parrot St
North Port, FL 34286
|
1,728 sq. feet
|
2 baths 3 beds |
show details | |

|
#27
Mariner Ln
Rotonda West, FL 33947
|
1,718 sq. feet
|
2 baths 3 beds |
show details | |

|
#28
S Cranberry Blvd
North Port, FL 34286
|
1,795 sq. feet
|
3 baths 3 beds |
show details | |

|
#29
Alibi Ter
North Port, FL 34286
|
960 sq. feet
|
2 baths 2 beds |
show details | |

|
#30
Taneytown St
North Port, FL 34291
|
1,052 sq. feet
|
3 baths 3 beds |
show details |
| Photo | Address | Area | Beds / Baths | Price | Details |
|---|---|---|---|---|---|

|
#31
Alibi Ter
North Port, FL 34286
|
1,848 sq. feet
|
3 baths 3 beds |
show details | |

|
#32
Thorman Rd
Port Charlotte, FL 33981
|
1,360 sq. feet
|
2 baths 3 beds |
show details | |

|
#33
Roxbury Cir
North Port, FL 34287
|
1,200 sq. feet
|
2 baths 3 beds |
show details | |

|
#34
Meroni Blvd
North Port, FL 34291
|
1,872 sq. feet
|
2 baths 3 beds |
show details | |

|
#35
Mill Run Ct
North Port, FL 34287
|
912 sq. feet
|
2 baths 2 beds |
show details | |

|
#36
Bolander Ter
North Port, FL 34287
|
2,308 sq. feet
|
3 baths 3 beds |
show details | |

|
#37
Yacht Harbor Dr
Osprey, FL 34229
|
1,983 sq. feet
|
2 baths 3 beds |
show details | |

|
#38
Grobe St
North Port, FL 34287
|
648 sq. feet
|
1 baths 2 beds |
show details | |

|
#39
San Pablo Ave
North Port, FL 34287
|
1,042 sq. feet
|
2 baths 3 beds |
show details | |

|
#40
Irondale Rd
North Port, FL 34287
|
1,548 sq. feet
|
2 baths 3 beds |
show details |
| Photo | Address | Area | Beds / Baths | Price | Details |
|---|---|---|---|---|---|

|
#41
Agress Ave
North Port, FL 34287
|
1,090 sq. feet
|
1 baths 3 beds |
show details | |

|
#42
S Biscayne Dr
North Port, FL 34287
|
1,139 sq. feet
|
1 baths 2 beds |
show details | |

|
#43
Myrtlewood Rd
North Port, FL 34287
|
900 sq. feet
|
2 baths 2 beds |
show details | |

|
#44
Myrtlewood Rd
North Port, FL 34287
|
904 sq. feet
|
1 baths 2 beds |
show details | |

|
#45
Harmony Rd
North Port, FL 34287
|
900 sq. feet
|
1 baths 2 beds |
show details | |

|
#46
San Jacinto Ave
North Port, FL 34287
|
1,176 sq. feet
|
2 baths 3 beds |
show details | |

|
#47
Harmony Rd
North Port, FL 34287
|
1,115 sq. feet
|
1 baths 2 beds |
show details | |

|
#48
Mesa St
North Port, FL 34287
|
1,443 sq. feet
|
2 baths 2 beds |
show details | |

|
#49
Belcrest Ct
North Port, FL 34287
|
1,216 sq. feet
|
3 baths 2 beds |
show details | |

|
Check over 1 million property listings on Foreclosure.com!
|
browse all offers | |||


Median year apartment built: 1982
Household type by relationship:
Households: 18,379- Male householders: 3,555 (652 living alone), Female householders: 4,039 (915 living alone)
4,501 spouses (4,496 opposite-sex spouses), 439 unmarried partners, (405 opposite-sex unmarried partners), 4,259 children (4,028 natural, 44 adopted, 187 stepchildren), 303 grandchildren, 137 brothers or sisters, 380 parents, 0 foster children, 219 other relatives, 515 non-relatives
- In group quarters: 26
Size of family households: 3,054 2-persons, 1,485 3-persons, 824 4-persons, 164 5-persons, 105 6-persons, 99 7-or-more-persons.
Size of nonfamily households: 1,582 1-person, 413 2-persons, 116 3-persons.
2,042 married couples with children.
612 single-parent households (299 men, 313 women).
87.1% of residents of South Venice speak English at home.
4.5% of residents speak Spanish at home (56% speak English very well, 41% speak English well, 3% speak English not well).
6.7% of residents speak other Indo-European language at home (62% speak English very well, 23% speak English well, 15% speak English not well).
1.5% of residents speak Asian or Pacific Island language at home (38% speak English very well, 49% speak English well, 13% speak English not well).
Foreign born population: 2,198 (12.0%)
(82.1% of them are naturalized citizens)
| Here: | 5.4 |
| State: | 5.9 |
| Here: | 4.7 |
| State: | 4.2 |

- Bedrooms in owner-occupied houses and condos in South Venice, Florida
- 52no bedroom
- 541 bedroom
- 2,8902 bedrooms
- 3,2563 bedrooms
- 1234 bedrooms
- 585+ bedrooms

- Bedrooms in renter-occupied apartments in South Venice, Florida
- 15no bedroom
- 261 bedroom
- 7652 bedrooms
- 5233 bedrooms
- 164 bedrooms
- 115+ bedrooms

- Cars and other vehicles available in South Venice in owner-occupied houses/condos
- 234no vehicle
- 1,5601 vehicle
- 3,4992 vehicles
- 8133 vehicles
- 2344 vehicles
- 935+ vehicles

- Cars and other vehicles available in South Venice in renter-occupied apartments
- 36no vehicle
- 3801 vehicle
- 5412 vehicles
- 2193 vehicles
- 1814 vehicles
- 05+ vehicles

- Rooms in owner-occupied houses in South Venice, Florida
- 141 room
- 552 rooms
- 1583 rooms
- 1,2164 rooms
- 2,1975 rooms
- 1,7046 rooms
- 5837 rooms
- 2228 rooms
- 2849+ rooms

- Rooms in renter-occupied apartments in South Venice, Florida
- 01 room
- 152 rooms
- 833 rooms
- 4924 rooms
- 3555 rooms
- 2036 rooms
- 1327 rooms
- 328 rooms
- 449+ rooms


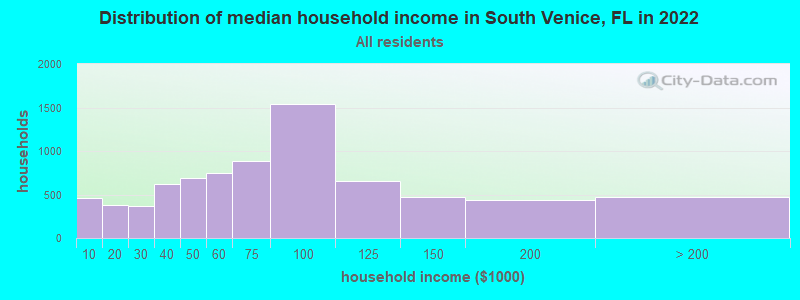
South Venice, FL household income distribution

- 460Less than $10,000
- 380$10,000 to $19,999
- 364$20,000 to $29,999
- 621$30,000 to $39,999
- 693$40,000 to $49,999
- 751$50,000 to $59,999
- 882$60,000 to $74,999
- 1,541$75,000 to $99,999
- 651$100,000 to $124,999
- 466$125,000 to $149,999
- 432$150,000 to $199,999
- 468$200,000 or more
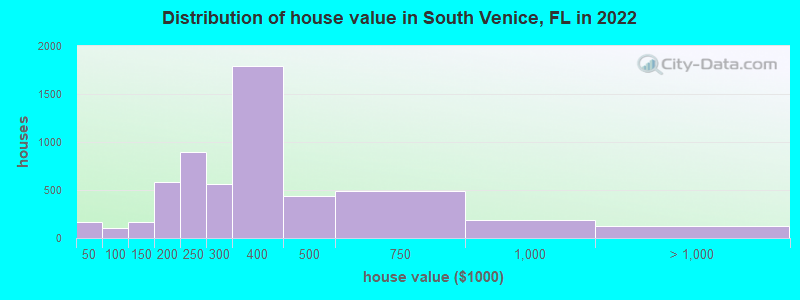
Home value of owner - occupied houses in 2022 in South Venice, FL
-
- 49Less than $10,000
- 5$15,000 to $19,999
- 47$20,000 to $24,999
- 7$25,000 to $29,999
- 17$30,000 to $34,999
- 33$35,000 to $39,999
- 6$40,000 to $49,999
- 49$70,000 to $79,999
- 31$80,000 to $89,999
- 20$90,000 to $99,999
- 84$100,000 to $124,999
- 76$125,000 to $149,999
- 369$150,000 to $174,999
- 215$175,000 to $199,999
- 901$200,000 to $249,999
- 563$250,000 to $299,999
- 1,787$300,000 to $399,999
- 436$400,000 to $499,999
- 485$500,000 to $749,999
- 191$750,000 to $999,999
- 64$1,000,000 to $1,499,999
- 57$2,000,000 or more
Rent paid by renters in 2022 in South Venice, FL
-
- 9$500 to $549
- 7$550 to $599
- 12$650 to $699
- 32$700 to $749
- 12$750 to $799
- 72$800 to $899
- 65$900 to $999
- 94$1,000 to $1,249
- 245$1,250 to $1,499
- 403$1,500 to $1,999
- 132$2,000 to $2,499
- 24$2,500 to $2,999
- 20$3,500 or more
- 187No cash rent


Percentage of workers working in this county: 91.2%
Number of people working at home: 1,779 (20.3% of all workers)
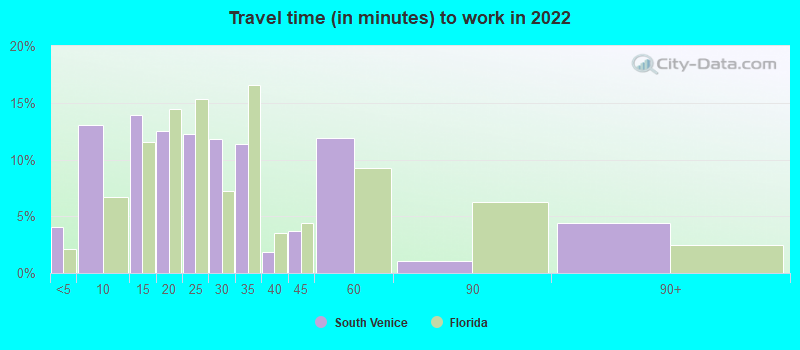
Travel time to work (commute)
- Less than 5 minutes: 15
- 5 to 9 minutes: 875
- 10 to 14 minutes: 1,689
- 15 to 19 minutes: 956
- 20 to 24 minutes: 850
- 25 to 29 minutes: 359
- 30 to 34 minutes: 808
- 35 to 39 minutes: 170
- 40 to 44 minutes: 341
- 45 to 59 minutes: 744
- 60 to 89 minutes: 218
- 90 or more minutes: 102
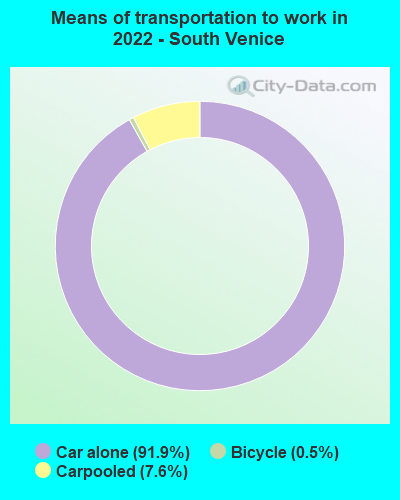
Means of transportation to work:
- Drove a car alone: 2,024 (54.0%)
- Carpooled: 195 (5.2%)
- Bicycle: 10 (0.3%)
- Walked: 3 (0.1%)
- Worked at home: 1,779 (47.5%)

- Unemployment by race in 2022
- Unemployment rate for White non-Hispanic residents
- 0.9%Males
- 6.2%Females
- Unemployment rate for Black residents
- 31.5%Females
- Unemployment rate for other race residents
- 7.5%Males
- Unemployment rate for two or more race residents
- 15.5%Males
- 1.4%Females
- Unemployment rate for Hispanic or Latino residents
- 7.3%Males
- 0.6%Females

- Year of entry for the foreign-born population in South Venice, Florida
- 5282010 or later
- 3952000 to 2009
- 3671990 to 1999
- 1491980 to 1989
- 821970 to 1979
- 322Before 1970
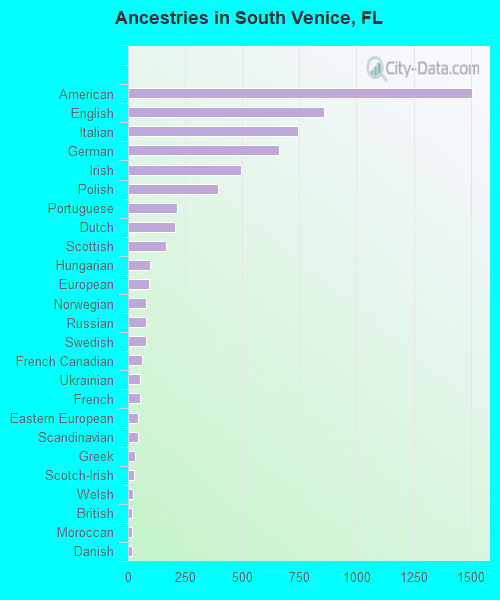
First ancestries reported:
- American: 1,505 (20.0%)
- English: 858 (11.4%)
- Italian: 744 (9.9%)
- German: 660 (8.8%)
- Irish: 494 (6.6%)
- Polish: 395 (5.2%)
- Portuguese: 215 (2.9%)
- Dutch: 206 (2.7%)
- Scottish: 165 (2.2%)
- Hungarian: 97 (1.3%)
- European: 93 (1.2%)
- Norwegian: 78 (1.0%)
- Russian: 78 (1.0%)
- Swedish: 78 (1.0%)
- French Canadian: 61 (0.8%)
- Ukrainian: 53 (0.7%)
- French: 52 (0.7%)
- Eastern European: 42 (0.6%)
- Scandinavian: 42 (0.6%)
- Greek: 32 (0.4%)
- Scotch-Irish: 28 (0.4%)
- Welsh: 21 (0.3%)
- British: 18 (0.2%)
- Moroccan: 16 (0.2%)
- Danish: 16 (0.2%)
- Bulgarian: 12 (0.2%)
- Czech: 12 (0.2%)
- Romanian: 12 (0.2%)
- Lithuanian: 11 (0.1%)
- Finnish: 7 (0.09%)
- Canadian: 6 (0.08%)
- Slovak: 6 (0.08%)
- Czechoslovakian: 5 (0.07%)
- Swiss: 5 (0.07%)
Most common places of birth for foreign-born residents (%):
| South Venice: | 15.0% (290) |
| Florida: | 0.5% (21,886) |
| South Venice: | 8.4% (163) |
| Florida: | 22.0% (1,006,576) |
| South Venice: | 7.8% (152) |
| Florida: | 1.3% (57,263) |
| South Venice: | 6.1% (119) |
| Florida: | 0.1% (3,402) |
| South Venice: | 5.4% (105) |
| Florida: | 5.6% (257,152) |
| South Venice: | 5.3% (103) |
| Florida: | 2.4% (109,132) |
| South Venice: | 4.9% (95) |
| Florida: | 0.6% (25,219) |
| South Venice: | 4.3% (83) |
| Florida: | 1.3% (60,604) |
| South Venice: | 3.9% (75) |
| Florida: | 0.1% (4,700) |
| South Venice: | 3.7% (71) |
| Florida: | 1.8% (84,403) |
| South Venice: | 3.5% (68) |
| Florida: | 0.4% (20,008) |
| South Venice: | 3.1% (60) |
| Florida: | 0.7% (31,076) |
| South Venice: | 2.7% (53) |
| Florida: | 1.2% (54,272) |
| South Venice: | 2.3% (45) |
| Florida: | 0.1% (4,361) |
| South Venice: | 2.1% (41) |
| Florida: | 0.2% (9,122) |
| South Venice: | 2.1% (40) |
| Florida: | 0.2% (11,243) |
| South Venice: | 1.9% (37) |
| Florida: | 0.2% (8,980) |
| South Venice: | 1.9% (36) |
| Florida: | 2.1% (97,632) |
| South Venice: | 1.8% (34) |
| Florida: | 1.2% (56,071) |
| South Venice: | 1.5% (30) |
| Florida: | 0.2% (9,421) |
Place of birth for U.S.-born residents:
- This state: 4,172
- Other state: 11,552
- Northeast: 5,348
- Midwest: 4,030
- South: 1,498
- West: 650
90.8% of South Venice residents lived in the same house 1 years ago.
Out of people who lived in different houses, 28.9% lived in this county.
Out of people who lived in different counties, 26.5% lived in Florida.
| South Venice: | 90.8% |
| State average: | 86.3% |
Education attainment for males 25 years and older:
- No schooling: 58
- Nursery to 4th grade: 0
- 5th and 6th grade: 15
- 7th and 8th grade: 26
- 9th grade: 12
- 10th grade: 108
- 11th grade: 42
- 12th grade, no diploma: 459
- High school graduate (or equivalency): 2,471
- Less than 1 year of college: 664
- Some college more than 1 year, no degree: 1,075
- Associate degree: 707
- Bachelor's degree: 765
- Master's degree: 421
- Professional school degree: 136
- Doctorate degree: 42

Education attainment for females 25 years and older:
- No schooling: 36
- Nursery to 4th grade: 0
- 5th and 6th grade: 10
- 7th and 8th grade: 0
- 9th grade: 0
- 10th grade: 72
- 11th grade: 39
- 12th grade, no diploma: 176
- High school graduate (or equivalency): 2,020
- Less than 1 year of college: 546
- Some college more than 1 year, no degree: 1,046
- Associate degree: 953
- Bachelor's degree: 1,088
- Master's degree: 929
- Professional school degree: 32
- Doctorate degree: 58


Housing units in structures:
- One, detached: 8,222
- One, attached: 47
- Two: 68
- 3 or 4: 41
- 5 to 9: 19
- 10 to 19: 51
- 20 to 49: 30
- 50 or more: 10
- Mobile homes: 498
Median worth of mobile homes: $165,400
Housing units lacking complete kitchen facilities in 2022: 0.5%
House/condo owner moved in on average 9 years ago
Renter moved in on average 5 years ago

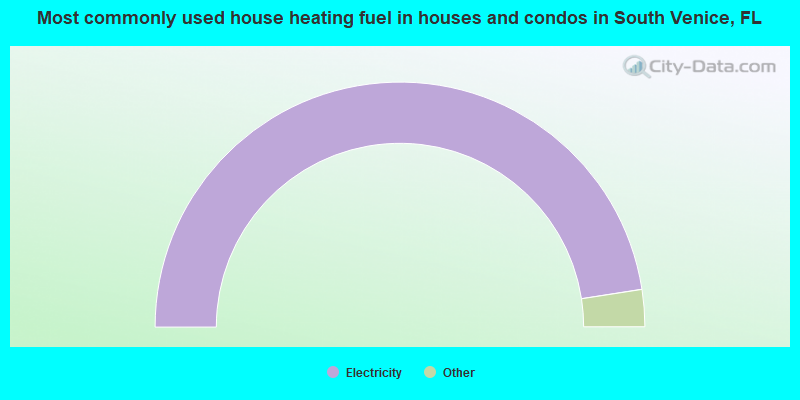
- 95.1%Electricity
- 1.7%Utility gas
- 1.6%No fuel used
- 1.0%Solar energy
- 0.6%Wood
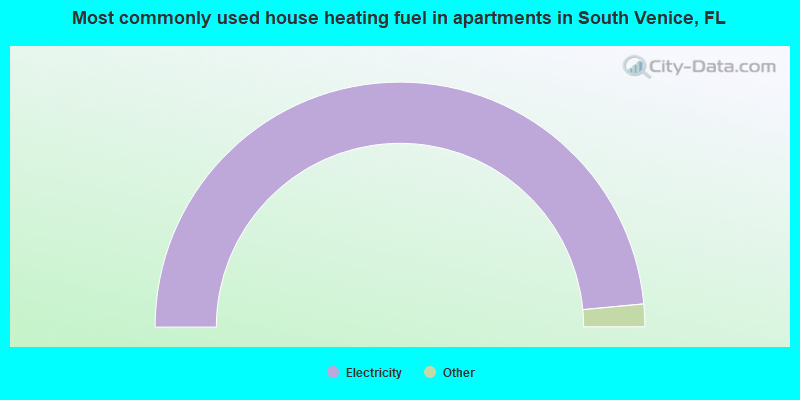
- 97.1%Electricity
- 1.5%No fuel used
- 1.4%Utility gas
Private vs. public school enrollment:
| Here: | 14.7% |
| Florida: | 15.8% |
| Here: | 4.4% |
| Florida: | 12.9% |
| Here: | 28.3% |
| Florida: | 23.6% |


