Percentage of residents living in poverty in 2022: 6.4%
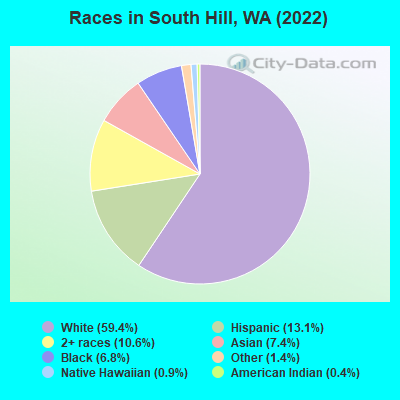
(5.8% for White Non-Hispanic residents, 7.6% for Black residents, 5.9% for Hispanic or Latino residents, 8.0% for Native Hawaiian and other Pacific Islander residents, 4.3% for other race residents, 9.9% for two or more races residents)
Latest news from South Hill, WA collected exclusively by city-data.com from local newspapers, TV, and radio stations
Ancestries: German (10.5%), American (6.5%), English (6.3%), Irish (5.4%), European (5.1%), Norwegian (2.7%).
Current Local Time: PST time zone
Land area: 18.0 square miles.
Population density: 3,589 people per square mile (average).
7,112 residents are foreign born (3.9% Asia, 2.9% Latin America, 1.8% Europe).
This place:
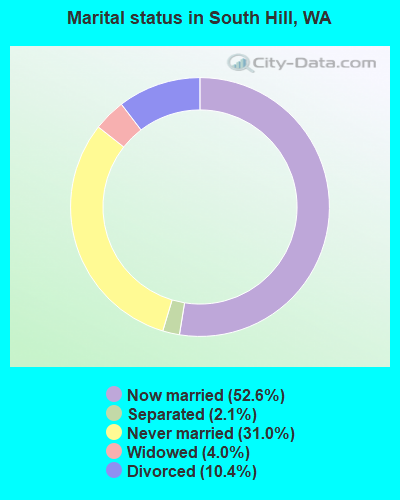
10.4%
Washington:
14.9%
Median real estate property taxes paid for housing units with mortgages in 2022: $4,642 (0.8%) Median real estate property taxes paid for housing units with no mortgage in 2022: $4,492 (0.9%)
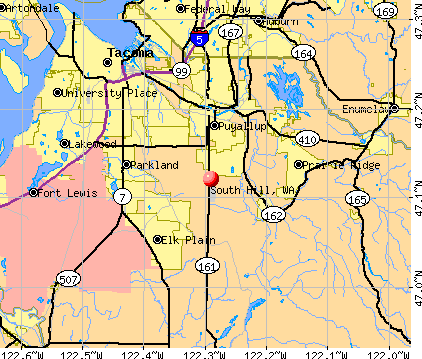
Nearest city with pop. 50,000+: Graham-Thrift, WA (5.2 miles , pop. 56,970).
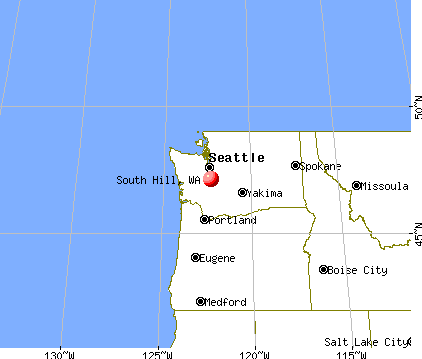
Nearest city with pop. 200,000+: East Seattle, WA (34.8 miles , pop. 480,100).
Nearest city with pop. 1,000,000+: Los Angeles, CA (924.4 miles , pop. 3,694,820).
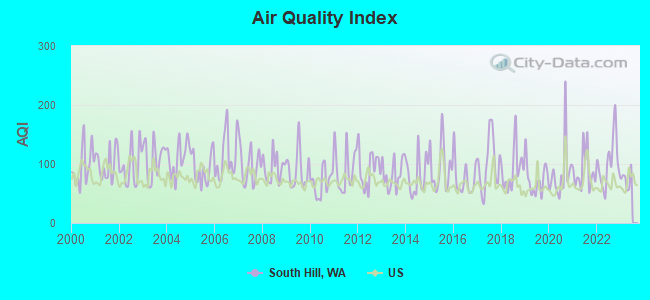
Air Quality Index (AQI) level in 2022 was 103. This is significantly worse than average.
City:
103
U.S.:
73
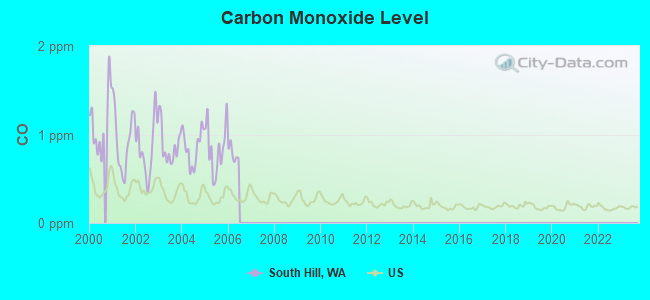
Carbon Monoxide (CO) [ppm] level in 2005 was 0.848. This is significantly worse than average.Closest monitor was 11.2 miles away from the city center.
City:
0.848
U.S.:
0.251
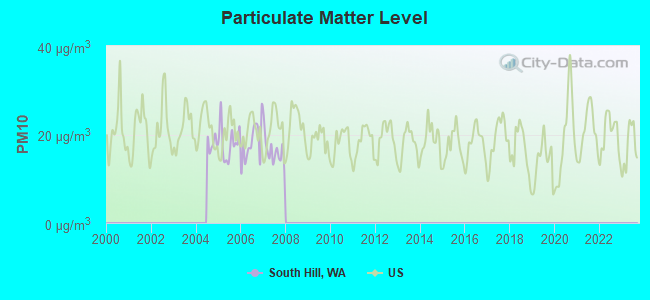
Particulate Matter (PM10) [µg/m3] level in 2007 was 16.3. This is about average.Closest monitor was 1.4 miles away from the city center.
City:
16.3
U.S.:
19.2
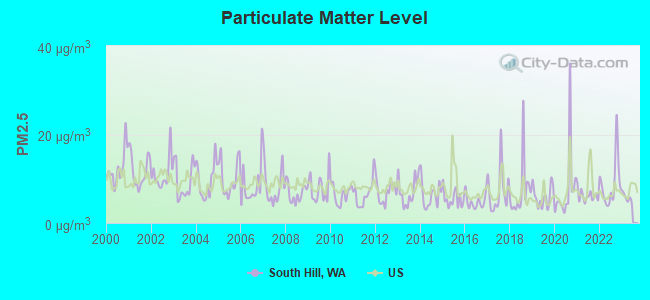
Particulate Matter (PM2.5) [µg/m3] level in 2022 was 8.87. This is about average.Closest monitor was 1.4 miles away from the city center.
City:
8.87
U.S.:
8.11
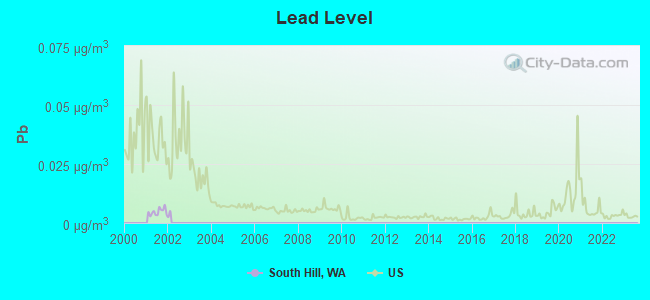
Lead (Pb) [µg/m3] level in 2001 was 0.00477. This is significantly better than average.Closest monitor was 11.4 miles away from the city center.
City:
0.00477
U.S.:
0.00931
Earthquake activity:
South Hill-area historical earthquake activity is significantly above Washington state average. It is 1406% greater than the overall U.S. average.
On 4/13/1949 at 19:55:42, a magnitude 7.0 (7.0 UK, Class: Major, Intensity: VIII - XII) earthquake occurred 13.3 miles away from South Hill center, causing $80,000,000 total damage On 2/28/2001 at 18:54:32, a magnitude 6.8 (6.5 MB, 6.6 MS, 6.8 MW, Class: Strong, Intensity: VII - IX) earthquake occurred 13.8 miles away from the city center, causing $2,000,000,000 total damage and $305,000,000 insured losses On 2/28/2001 at 18:54:32, a magnitude 6.8 (6.8 MD, Depth: 32.2 mi) earthquake occurred 20.6 miles away from the city center On 4/29/1965 at 15:28:43, a magnitude 6.6 (6.6 UK) earthquake occurred 13.7 miles away from South Hill center, causing $28,000,000 total damage On 7/3/1999 at 01:43:54, a magnitude 5.8 (5.4 MB, 5.5 MS, 5.8 MW, 5.3 ME, Depth: 25.2 mi, Class: Moderate, Intensity: VI - VII) earthquake occurred 44.6 miles away from South Hill center On 1/31/1922 at 13:17:28, a magnitude 7.6 (7.6 UK) earthquake occurred 472.8 miles away from the city center Magnitude types: body-wave magnitude (MB), duration magnitude (MD), energy magnitude (ME), surface-wave magnitude (MS), moment magnitude (MW)
Natural disasters:
The number of natural disasters in Pierce County (21) is greater than the US average (15). Major Disasters (Presidential) Declared: 20 Emergencies Declared: 1
Causes of natural disasters: Floods: 13, Storms: 10, Mudslides: 5, Landslides: 4, Winter Storms: 4, Earthquakes: 2, Heavy Rains: 2, Winds: 2, Hurricane: 1, Volcanic Eruption: 1, Other: 1 (Note: some incidents may be assigned to more than one category).
Hospitals and medical centers near South Hill:
GREATER PUYALLUP DIALYSIS CENTER (Dialysis Facility, about 3 miles away; PUYALLUP, WA)
PUYALLUP COMMUNITY DIALYSIS CENTER (Dialysis Facility, about 3 miles away; PUYALLUP, WA)
GRAHAM DIALYSIS CENTER (Dialysis Facility, about 3 miles away; GRAHAM, WA)
REGENCY AT PUYALLUP REHABILITATION CENTER (Nursing Home, about 4 miles away; PUYALLUP, WA)
MULTICARE GOOD SAMARITAN HOSPITAL Acute Care Hospitals (about 4 miles away; PUYALLUP, WA)
KINDRED TRANSITIONAL CARE AND REHAB - RAINIER VISTA (Nursing Home, about 5 miles away; PUYALLUP, WA)
LIFE CARE CENTER OF PUYALLUP (Nursing Home, about 5 miles away; PUYALLUP, WA)
Amtrak station near South Hill:
11 miles: TACOMA (1001 PUYALLUP AVE.) . Services: ticket office, partially wheelchair accessible, enclosed waiting area, public restrooms, public payphones, full-service food facilities, free short-term parking, free long-term parking, call for taxi service, intercity bus service, public transit connection.
Colleges/universities with over 2000 students nearest to South Hill:
Pierce College at Puyallup (about 3 miles; Puyallup, WA; Full-time enrollment: 2,529)
Pacific Lutheran University (about 8 miles; Tacoma, WA; FT enrollment: 3,548)
Clover Park Technical College (about 11 miles; Lakewood, WA; FT enrollment: 4,185)
University of Washington-Tacoma Campus (about 12 miles; Tacoma, WA; FT enrollment: 3,788)
Bates Technical College (about 12 miles; Tacoma, WA; FT enrollment: 4,929)
University of Puget Sound (about 14 miles; Tacoma, WA; FT enrollment: 2,788)
Pierce College at Fort Steilacoom (about 14 miles; Lakewood, WA; FT enrollment: 5,228)
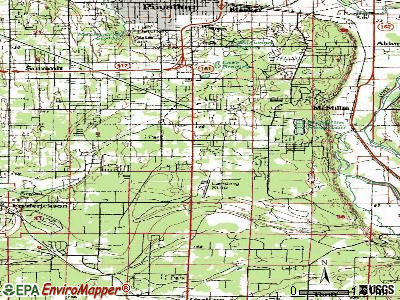
Notable locations in South Hill: Paul Bunyan Rifle and Sportsmens Club (A), Hidden Valley Landfill (B), Pierce County Fire District 6 Central Pierce Fire and Rescue Station 6 - 6 (C), Pierce County Fire District 6 Central Pierce Fire and Rescue Station 6 - 9 (D), Pierce County Fire Protection District 21 Graham Fire and Rescue Station 91 (E). Display/hide their locations on the map
Reservoirs: McMillin Reservoir (A), McMillin Reservoir Number 1-North (B), McMillin Reservoir Number 1-South (C), McMillin Reservoir Number Two (D). Display/hide their locations on the map
Pierce County has a predicted average indoor radon screening level less than 2 pCi/L (pico curies per liter) - Low Potential
Average household size:
This place:
2.9 people
Washington:
2.5 people
Percentage of family households:
This place:
77.9%
Whole state:
64.4%
Percentage of households with unmarried partners:
This place:
7.4%
Whole state:
7.7%
Likely homosexual households (counted as self-reported same-sex unmarried-partner households)
Lesbian couples: 0.4% of all households
Gay men: 0.3% of all households
60 people in group homes intended for adults in 2010
People in group quarters in South Hill in 2000:
71 people in other noninstitutional group quarters
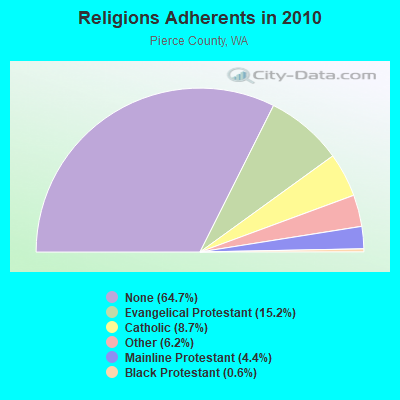
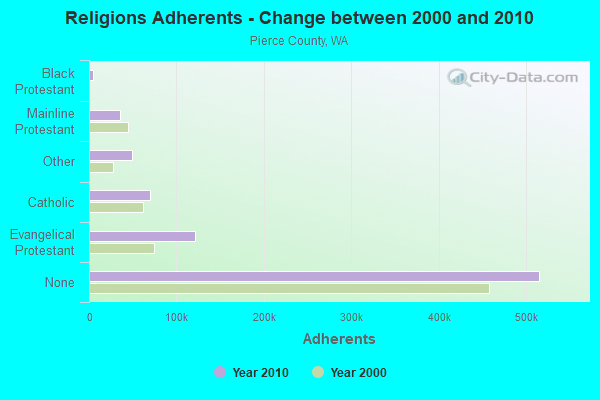
Religion statistics for South Hill, WA (based on Pierce County data)
Religion
Adherents
Congregations
Evangelical Protestant
121,041
365
Catholic
69,558
26
Other
49,446
109
Mainline Protestant
34,906
123
Black Protestant
4,817
17
Orthodox
605
4
None
514,852
-
Source: Clifford Grammich, Kirk Hadaway, Richard Houseal, Dale E.Jones, Alexei Krindatch, Richie Stanley and Richard H.Taylor. 2012. 2010 U.S.Religion Census: Religious Congregations & Membership Study. Association of Statisticians of American Religious Bodies. Jones, Dale E., et al. 2002. Congregations and Membership in the United States 2000. Nashville, TN: Glenmary Research Center. Graphs represent county-level data
30,562Total future (year 2039) average daily traffic
FCC Registered Antenna Towers:
7
David Werblow, 19129 97th Ave Court East (Se05313d) (Lat: 47.082306 Lon: -122.299444), Type: 38.1, Structure height: 53053 m, Overall height: 38.1 m, Registrant: T-Mobile West LLC, Fccregulatorycompliancecontact@t-Mobile.Com, , Belle-vue, Phone: (425) 383-8401
DAVID WERBLOW, 19129 97th Ave Court East (Se05313d), Type: 38.1, Structure height: 53053 m, Overall height: 38.1 m, Registrant: T-Mobile West LLC, Fccregulatorycompliancecontact@t-Mobile.Com, , Belle-vue, Phone: (425) 383-8401
DAVID WERBLOW, 19129 97th Ave Court East (Se05313d) (Lat: 47.082306 Lon: -122.299444), Type: 38.1, Structure height: 53053 m, Overall height: 38.1 m, Licensee ID: L, Registrant: T-Mobile West LLC, Fccregulatorycompliancecontact@t-Mobile.Com, , Belle-vue, Phone: (425) 383-8401
David Werblow, 19129 97th Ave Ct E (Se05313d) (Lat: 47.082222 Lon: -122.299472), Type: 38.1, Structure height: 53053 m, Overall height: 38.1 m, Registrant: T-Mobile West LLC, Fccregulatorycompliancecontact@t-Mobile.Com, , Belle-vue, Phone: (425) 383-8401
David Werblow, 19129 97th Ave Ct E (Se05313d) (Lat: 47.082222 Lon: -122.299472), Type: 38.1, Structure height: 53053 m, Overall height: 38.1 m, Registrant: T-Mobile West LLC, Fccregulatorycompliancecontact@t-Mobile.Com, , Belle-vue, Phone: (425) 383-8401
David Werblow, 19129 97th Ave Ct E (Se05313d) (Lat: 47.082222 Lon: -122.299472), Type: 38.1, Structure height: 53053 m, Overall height: 38.1 m, Registrant: T-Mobile West LLC, Fccregulatorycompliancecontact@t-Mobile.Com, , Belle-vue, Phone: (425) 383-8401
112th St E & 117th Ave E (Lat: 47.153889 Lon: -122.273889), Type: 36.3, Overall height: 35.1 m, Registrant: Cable Tv Puget Sound Inc, Kollmann.Tim.M@tci.Com, , 5630 Denve-r, Phone: (303) 267-4865
FCC Registered Microwave Towers:
1
SE73XC091, 19129 97th Ct E (Lat: 47.082250 Lon: -122.299667), Type: Tank, Structure height: 38.1 m, Call Sign: WQWL708, Assigned Frequencies: 18015.0 MHz, 18015.0 MHz, 18015.0 MHz, 18015.0 MHz, 18015.0 MHz, Grant Date: 09/29/2015, Expiration Date: 09/29/2025, Cancellation Date: 05/16/2023, Certifier: David Werblow, Registrant: T-Mobile Usa, Inc., 12920 Se 38th Street, Bellevue, WA 98006, Phone: (425) 383-8401, Email:
FCC Registered Amateur Radio Licenses:
2
Call Sign: KB7WGA, Licensee ID: L00357787, Grant Date: 04/08/2003, Expiration Date: 07/06/2013, Cancellation Date: 08/06/2005, Certifier: Matthew R Sousley, Registrant: Matthew R Sousley, 9300 172nd St Ct E, South Hill, WA 98375
Call Sign: W7BUN, Licensee ID: L00357340, Grant Date: 05/07/2004, Expiration Date: 07/27/2014, Cancellation Date: 07/28/2016, Registrant: Jerry Seligman, 12306 80th Ave East, South Hill, WA 98373-4841
FAA Registered Aircraft:
1
Aircraft: CESSNA TU206G (Category: Land, Seats: 6, Weight: Up to 12,499 Pounds, Speed: 132 mph), Engine: CONT MOTOR TSIO-520 SER (300 HP) (Reciprocating) N-Number: 7561N, N7561N, N-7561N, Serial Number: U20603673, Year manufactured: 1977, Airworthiness Date: 02/09/1977, Certificate Issue Date: 05/02/1989 Registrant (Government): Pierce County Sheriffs Department, 271 John Bananola Way E / Attn: Air Unit Supervisor, South Hill, WA 98374
Home Mortgage Disclosure Act Aggregated Statistics For Year 2009 (Based on 4 full and 4 partial tracts)
A) FHA, FSA/RHS & VA Home Purchase Loans
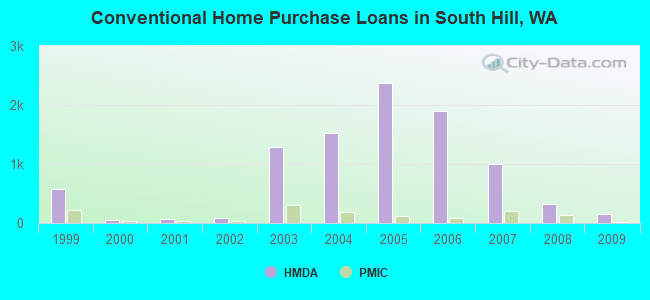
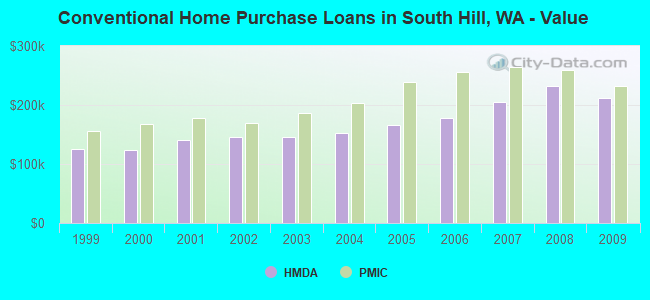
B) Conventional Home Purchase Loans
C) Refinancings
D) Home Improvement Loans
E) Loans on Dwellings For 5+ Families
F) Non-occupant Loans on < 5 Family Dwellings (A B C & D)
G) Loans On Manufactured Home Dwelling (A B C & D)
Number
Average Value
Number
Average Value
Number
Average Value
Number
Average Value
Number
Average Value
Number
Average Value
Number
Average Value
LOANS ORIGINATED
413
$235,147
150
$211,173
1,492
$222,731
41
$127,985
1
$10,362,000
93
$188,684
35
$148,913
APPLICATIONS APPROVED, NOT ACCEPTED
25
$245,559
26
$192,243
172
$231,594
12
$66,246
0
$0
13
$237,079
13
$103,370
APPLICATIONS DENIED
47
$235,735
34
$181,834
472
$244,248
31
$100,885
0
$0
28
$201,462
26
$105,625
APPLICATIONS WITHDRAWN
53
$235,468
19
$207,990
305
$241,600
6
$129,138
0
$0
15
$172,984
11
$127,586
FILES CLOSED FOR INCOMPLETENESS
6
$211,693
6
$215,628
71
$251,833
2
$289,050
0
$0
5
$188,152
3
$128,767
Aggregated Statistics For Year 2008 (Based on 4 full and 4 partial tracts)
A) FHA, FSA/RHS & VA Home Purchase Loans
B) Conventional Home Purchase Loans
C) Refinancings
D) Home Improvement Loans
E) Loans on Dwellings For 5+ Families
F) Non-occupant Loans on < 5 Family Dwellings (A B C & D)
G) Loans On Manufactured Home Dwelling (A B C & D)
Number
Average Value
Number
Average Value
Number
Average Value
Number
Average Value
Number
Average Value
Number
Average Value
Number
Average Value
LOANS ORIGINATED
314
$252,620
314
$232,603
917
$232,346
70
$107,017
2
$13,115,005
130
$209,893
45
$157,799
APPLICATIONS APPROVED, NOT ACCEPTED
25
$234,979
50
$220,887
172
$252,887
21
$53,520
1
$235,000
28
$260,994
12
$143,897
APPLICATIONS DENIED
42
$231,268
63
$229,422
669
$249,119
118
$115,758
0
$0
40
$246,265
42
$123,757
APPLICATIONS WITHDRAWN
39
$238,992
46
$290,215
292
$245,944
23
$192,793
0
$0
19
$210,559
13
$163,819
FILES CLOSED FOR INCOMPLETENESS
11
$243,691
9
$262,297
58
$245,104
6
$144,170
0
$0
7
$245,444
5
$206,398
Aggregated Statistics For Year 2007 (Based on 4 full and 4 partial tracts)
A) FHA, FSA/RHS & VA Home Purchase Loans
B) Conventional Home Purchase Loans
C) Refinancings
D) Home Improvement Loans
E) Loans on Dwellings For 5+ Families
F) Non-occupant Loans on < 5 Family Dwellings (A B C & D)
G) Loans On Manufactured Home Dwelling (A B C & D)
Number
Average Value
Number
Average Value
Number
Average Value
Number
Average Value
Number
Average Value
Number
Average Value
Number
Average Value
LOANS ORIGINATED
101
$267,419
997
$205,858
1,564
$216,127
181
$105,697
3
$1,399,807
232
$216,724
69
$110,039
APPLICATIONS APPROVED, NOT ACCEPTED
8
$252,092
152
$190,474
273
$219,450
30
$95,354
0
$0
23
$205,380
17
$106,764
APPLICATIONS DENIED
19
$237,098
217
$218,340
1,041
$233,484
240
$144,932
1
$247,000
72
$236,593
61
$114,364
APPLICATIONS WITHDRAWN
15
$270,510
100
$197,347
469
$236,543
83
$152,662
0
$0
41
$230,643
13
$94,455
FILES CLOSED FOR INCOMPLETENESS
0
$0
34
$185,648
120
$256,809
9
$164,118
0
$0
11
$201,170
10
$113,571
Aggregated Statistics For Year 2006 (Based on 4 full and 4 partial tracts)
A) FHA, FSA/RHS & VA Home Purchase Loans
B) Conventional Home Purchase Loans
C) Refinancings
D) Home Improvement Loans
E) Loans on Dwellings For 5+ Families
F) Non-occupant Loans on < 5 Family Dwellings (A B C & D)
G) Loans On Manufactured Home Dwelling (A B C & D)
Number
Average Value
Number
Average Value
Number
Average Value
Number
Average Value
Number
Average Value
Number
Average Value
Number
Average Value
LOANS ORIGINATED
130
$272,286
1,903
$177,951
1,893
$188,245
230
$94,167
2
$9,763,595
314
$199,240
72
$139,197
APPLICATIONS APPROVED, NOT ACCEPTED
11
$286,763
234
$182,703
313
$192,430
35
$125,798
0
$0
38
$185,528
14
$80,246
APPLICATIONS DENIED
25
$240,845
365
$183,792
928
$200,611
239
$118,496
0
$0
100
$190,352
65
$100,466
APPLICATIONS WITHDRAWN
9
$243,579
189
$175,249
696
$195,853
76
$135,969
0
$0
34
$175,726
15
$140,261
FILES CLOSED FOR INCOMPLETENESS
3
$294,377
37
$174,055
185
$214,198
8
$90,498
0
$0
9
$223,829
3
$130,123
Aggregated Statistics For Year 2005 (Based on 4 full and 4 partial tracts)
A) FHA, FSA/RHS & VA Home Purchase Loans
B) Conventional Home Purchase Loans
C) Refinancings
D) Home Improvement Loans
E) Loans on Dwellings For 5+ Families
F) Non-occupant Loans on < 5 Family Dwellings (A B C & D)
G) Loans On Manufactured Home Dwelling (A B C & D)
Number
Average Value
Number
Average Value
Number
Average Value
Number
Average Value
Number
Average Value
Number
Average Value
Number
Average Value
LOANS ORIGINATED
226
$235,190
2,376
$165,837
2,042
$174,649
162
$93,130
4
$9,512,685
352
$171,478
65
$99,687
APPLICATIONS APPROVED, NOT ACCEPTED
20
$222,036
238
$161,687
313
$171,675
25
$54,274
0
$0
47
$152,567
21
$81,719
APPLICATIONS DENIED
16
$232,993
398
$149,521
903
$176,999
173
$74,889
0
$0
78
$165,180
64
$96,397
APPLICATIONS WITHDRAWN
10
$204,728
263
$165,024
800
$184,659
91
$116,900
0
$0
58
$162,517
29
$123,298
FILES CLOSED FOR INCOMPLETENESS
6
$191,270
54
$149,499
120
$184,457
12
$62,528
0
$0
9
$162,154
1
$120,780
Aggregated Statistics For Year 2004 (Based on 4 full and 4 partial tracts)
A) FHA, FSA/RHS & VA Home Purchase Loans
B) Conventional Home Purchase Loans
C) Refinancings
D) Home Improvement Loans
E) Loans on Dwellings For 5+ Families
F) Non-occupant Loans on < 5 Family Dwellings (A B C & D)
G) Loans On Manufactured Home Dwelling (A B C & D)
Number
Average Value
Number
Average Value
Number
Average Value
Number
Average Value
Number
Average Value
Number
Average Value
Number
Average Value
LOANS ORIGINATED
243
$203,403
1,520
$152,588
1,766
$156,270
159
$67,600
3
$767,267
234
$153,553
62
$103,704
APPLICATIONS APPROVED, NOT ACCEPTED
13
$191,943
170
$145,470
339
$161,350
15
$56,206
0
$0
30
$164,504
13
$92,975
APPLICATIONS DENIED
23
$188,217
212
$143,310
871
$150,407
148
$57,035
3
$2,729,203
42
$164,983
66
$89,635
APPLICATIONS WITHDRAWN
20
$207,058
141
$163,910
713
$164,288
44
$67,400
0
$0
28
$132,932
20
$128,799
FILES CLOSED FOR INCOMPLETENESS
4
$213,705
29
$139,769
100
$162,087
13
$54,676
0
$0
4
$113,828
2
$107,830
Aggregated Statistics For Year 2003 (Based on 4 full and 4 partial tracts)
A) FHA, FSA/RHS & VA Home Purchase Loans
B) Conventional Home Purchase Loans
C) Refinancings
D) Home Improvement Loans
E) Loans on Dwellings For 5+ Families
F) Non-occupant Loans on < 5 Family Dwellings (A B C & D)
Number
Average Value
Number
Average Value
Number
Average Value
Number
Average Value
Number
Average Value
Number
Average Value
LOANS ORIGINATED
384
$181,384
1,280
$146,131
3,369
$150,463
104
$40,235
3
$485,270
268
$147,192
APPLICATIONS APPROVED, NOT ACCEPTED
22
$168,647
178
$138,559
369
$141,598
19
$42,849
1
$1,700,000
26
$129,149
APPLICATIONS DENIED
33
$173,016
203
$129,502
770
$148,476
81
$41,584
0
$0
55
$151,312
APPLICATIONS WITHDRAWN
28
$188,459
145
$134,977
563
$157,599
27
$29,826
0
$0
46
$125,428
FILES CLOSED FOR INCOMPLETENESS
4
$169,692
28
$132,851
113
$157,602
9
$43,708
0
$0
3
$102,090
Aggregated Statistics For Year 2002 (Based on 1 partial tract)
A) FHA, FSA/RHS & VA Home Purchase Loans
B) Conventional Home Purchase Loans
C) Refinancings
D) Home Improvement Loans
E) Loans on Dwellings For 5+ Families
F) Non-occupant Loans on < 5 Family Dwellings (A B C & D)
Number
Average Value
Number
Average Value
Number
Average Value
Number
Average Value
Number
Average Value
Number
Average Value
LOANS ORIGINATED
30
$165,133
92
$146,546
187
$144,760
4
$16,343
1
$72,290
43
$148,160
APPLICATIONS APPROVED, NOT ACCEPTED
1
$248,300
9
$153,239
18
$137,070
1
$13,830
0
$0
3
$180,200
APPLICATIONS DENIED
4
$142,850
19
$112,255
47
$136,687
5
$19,990
0
$0
8
$141,592
APPLICATIONS WITHDRAWN
5
$169,974
11
$146,121
26
$132,465
5
$19,110
0
$0
4
$155,422
FILES CLOSED FOR INCOMPLETENESS
2
$156,205
3
$81,090
8
$157,464
0
$0
0
$0
1
$77,950
Aggregated Statistics For Year 2001 (Based on 1 partial tract)
A) FHA, FSA/RHS & VA Home Purchase Loans
B) Conventional Home Purchase Loans
C) Refinancings
D) Home Improvement Loans
F) Non-occupant Loans on < 5 Family Dwellings (A B C & D)
Number
Average Value
Number
Average Value
Number
Average Value
Number
Average Value
Number
Average Value
LOANS ORIGINATED
27
$159,967
74
$140,942
117
$141,569
4
$20,588
18
$137,943
APPLICATIONS APPROVED, NOT ACCEPTED
1
$89,260
4
$121,948
11
$140,521
1
$72,920
1
$40,860
APPLICATIONS DENIED
0
$0
14
$113,956
33
$103,833
5
$20,240
3
$100,157
APPLICATIONS WITHDRAWN
3
$193,190
10
$121,006
21
$119,673
1
$110,010
3
$81,300
FILES CLOSED FOR INCOMPLETENESS
0
$0
1
$103,090
3
$146,883
0
$0
0
$0
Aggregated Statistics For Year 2000 (Based on 1 partial tract)
A) FHA, FSA/RHS & VA Home Purchase Loans
B) Conventional Home Purchase Loans
C) Refinancings
D) Home Improvement Loans
F) Non-occupant Loans on < 5 Family Dwellings (A B C & D)
Number
Average Value
Number
Average Value
Number
Average Value
Number
Average Value
Number
Average Value
LOANS ORIGINATED
14
$155,534
48
$123,179
19
$116,324
13
$30,173
11
$120,863
APPLICATIONS APPROVED, NOT ACCEPTED
2
$99,320
6
$118,387
6
$114,092
3
$19,697
3
$75,223
APPLICATIONS DENIED
2
$161,550
36
$69,687
16
$91,776
8
$19,880
2
$133,890
APPLICATIONS WITHDRAWN
3
$134,940
1
$116,920
4
$119,435
1
$12,570
0
$0
FILES CLOSED FOR INCOMPLETENESS
0
$0
1
$111,890
1
$107,490
1
$15,720
0
$0
Aggregated Statistics For Year 1999 (Based on 5 partial tracts)
A) FHA, FSA/RHS & VA Home Purchase Loans
B) Conventional Home Purchase Loans
C) Refinancings
D) Home Improvement Loans
E) Loans on Dwellings For 5+ Families
F) Non-occupant Loans on < 5 Family Dwellings (A B C & D)
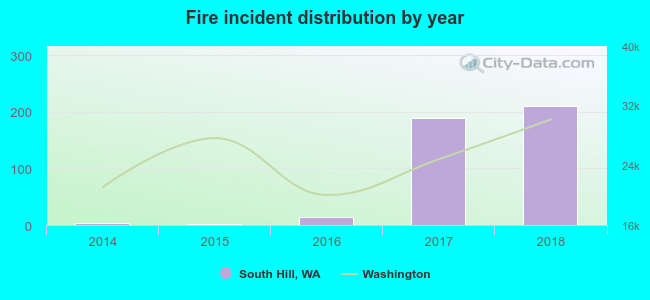
2014 - 2018 National Fire Incident Reporting System (NFIRS) incidents
According to the data from the years 2014 - 2018 the average number of fires per year is 84. The highest number of fires - 211 took place in 2018, and the least - 1 in 2015. The data has a rising trend.
When looking into fire subcategories, the most incidents belonged to: Outside Fires (48.9%), and Structure Fires (35.2%).
Fire incident types reported to NFIRS in South Hill, WA
#7 on the list of "Top 101 cities that people commute from (largest negative percentage daily daytime population change due to commuting) (population 50,000+)"
#8 on the list of "Top 101 cities with the highest average humidity (population 50,000+)"
#14 on the list of "Top 101 cities with the highest maximum monthly morning or afternoon humidity (population 50,000+)"
#19 on the list of "Top 101 cities with the lowest minimum monthly sunshine amount (population 50,000+)"
#19 on the list of "Top 101 cities with the lowest average sunshine amount (population 50,000+)"
#22 on the list of "Top 101 cities with the most people below the poverty level, excluding cities with 15% or more of residents in college and with the median age below 28 (population 50,000+)"
#23 on the list of "Top 101 cities with the lowest maximum monthly sunshine amount (population 50,000+)"
#24 on the list of "Top 101 cities with the lowest average wind speeds (population 50,000+)"
#38 on the list of "Top 101 cities with the smallest household incomes disparities (population 50,000+)"
#49 on the list of "Top 101 cities with the most people below 50% of the poverty level, excluding cities with 15% or more of residents in college and with the median age below 28 (population 50,000+)"
#49 on the list of "Top 101 cities with the most cars per house, population 50,000+"
#50 on the list of "Top 100 cities with highest median household income and median resident age less than 35 (pop. 50,000+)"
#56 on the list of "Top 101 cities with largest percentage of males in occupations: law enforcement workers including supervisors (population 50,000+)"
#57 on the list of "Top 100 cities with longest commuting times (pop. 50,000+)"
#59 on the list of "Top 100 low-educated but high-earning cities (pop. 50,000+)"
#65 on the list of "Top 100 cities with biggest houses (pop. 50,000+)"
#76 on the list of "Top 101 cities with largest percentage of females in occupations: transportation occupations (population 50,000+)"
#79 on the list of "Top 100 cities with newest houses (pop. 50,000+)"
#80 on the list of "Top 100 fastest growing cities from 2000 to 2014 (pop. 50,000+)"
#87 on the list of "Top 101 cities with largest percentage of females in industries: public administration (population 50,000+)"
#28 on the list of "Top 101 counties with the highest average weight of females"
#41 on the list of "Top 101 counties with the largest increase in the number of births per 1000 residents 2000-2006 to 2007-2013 (pop 50,000+)"
#41 on the list of "Top 101 counties with the highest ground withdrawal of fresh water for public supply"
#48 on the list of "Top 101 counties with the highest percentage of residents relocating from foreign countries between 2010 and 2011 (pop. 50,000+)"
#50 on the list of "Top 101 counties with the most Evangelical Protestant congregations"


 Recent articles from our blog. Our writers, many of them Ph.D. graduates or candidates, create easy-to-read articles on a wide variety of topics.

 , pop. 56,970).


 According to the data from the years 2014 - 2018 the average number of fires per year is 84. The highest number of fires - 211 took place in 2018, and the least - 1 in 2015. The data has a rising trend.
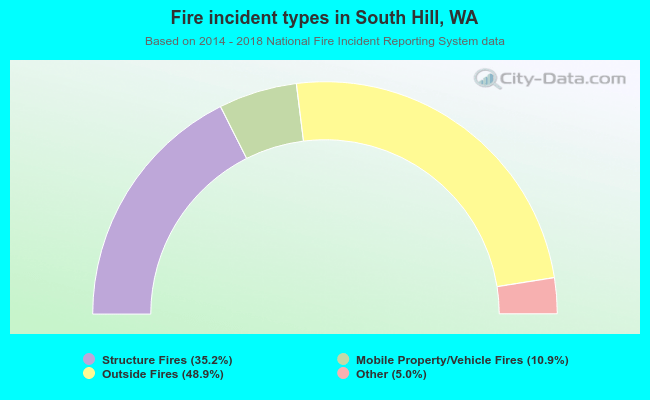 When looking into fire subcategories, the most incidents belonged to: Outside Fires (48.9%), and Structure Fires (35.2%).