South Hill: Fire Incidents, Washington (WA)
Where are fire incidents reported in South Hill, WA
Something went wrong! Please refresh the page.
|
| |||||||||||||||||||||||||||||||||||||||||||||||||||||||||||||||||||||||||||||||||||||||||||||||||||||||||||||
2014 - 2018 National Fire Incident Reporting System (NFIRS) incidents
- Incident types reported to NFIRS in South Hill, WA
- 14,90177.0%Rescue & EMS
- 1,7038.8%Good Intent Call
- 1,1906.1%False Alarm
- 9044.7%Service Call
- 4212.2%Fire
- 2061.1%Hazardous Condition
- Fire incident types reported to NFIRS in South Hill, WA
- 20648.9%Outside Fires
- 14835.2%Structure Fires
- 4610.9%Mobile Property/Vehicle Fires
- 215.0%Other
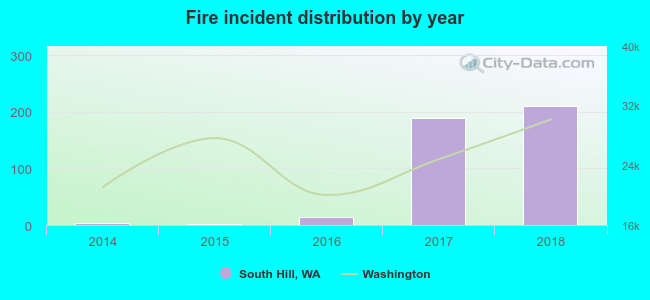 According to the data from the years 2014 - 2018 the average number of fire incidents per year is 84. The highest number of fires - 211 took place in 2018, and the least - 1 in 2015. The data has a rising trend.
The average number of yearly fire incidents per 10k residents in South Hill, WA compared to nearest cities:
(Note: Based on data for the last 3 years, including only cities with population 5,000 and above)
| South Hill: | 26.4 |
| Orting: | 91.8 |
| Puyallup: | 47.5 |
| Graham: | 38.6 |
| Sumner: | 73.0 |
| Spanaway: | 42.1 |
| Parkland: | 53.9 |
| Bonney Lake: | 67.3 |
| Edgewood: | 24.6 |
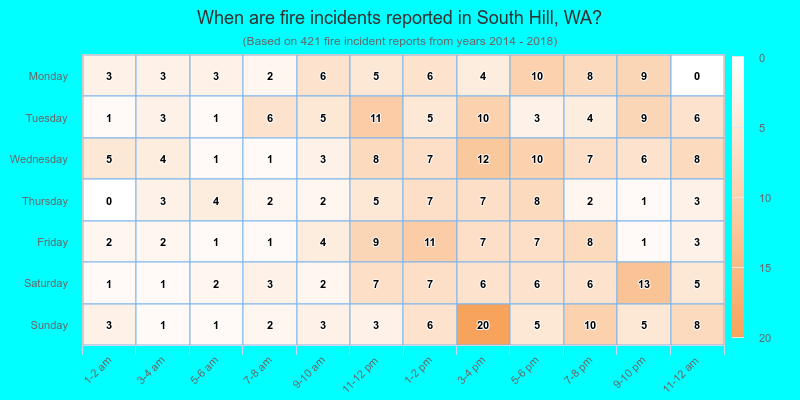
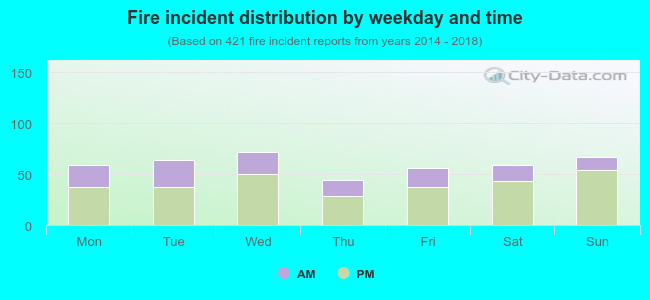 32.1% incidents where reported in the morning and 67.9% in the evening. The most fires (17.1%) took place on Wednesday, and the least (10.5%) on Thursday.
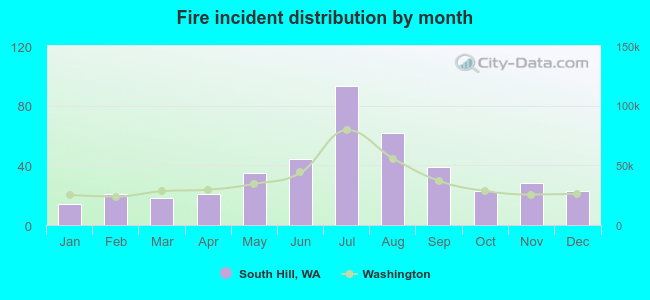 According to the 421 fire incident reports from years 2014 - 2018 most fires (22.1%) took place during July, and the least (3.3%) in January.
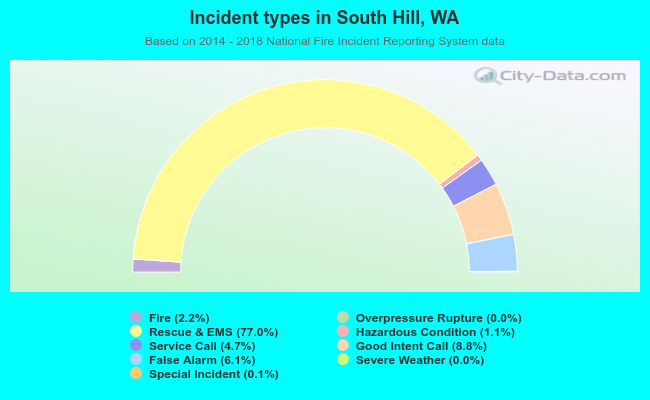 Out of all 19,351 cases reported during the years 2014 - 2018, the most belonged to the categories: Rescue & EMS (77.0%), Good Intent Call (8.8%), and False Alarm (6.1%).
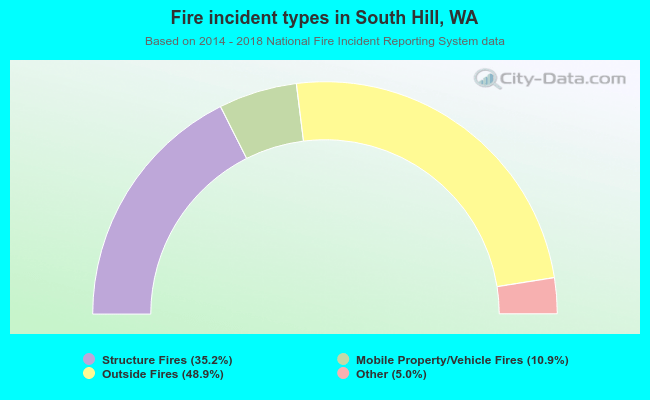 When looking into fire subcategories, the most reports belonged to: Outside Fires (48.9%), and Structure Fires (35.2%).