Pine Castle, Florida Submit your own pictures of this place and show them to the world
OSM Map
General Map
Google Map
MSN Map
OSM Map
General Map
Google Map
MSN Map
OSM Map
General Map
Google Map
MSN Map
OSM Map
General Map
Google Map
MSN Map
Please wait while loading the map...
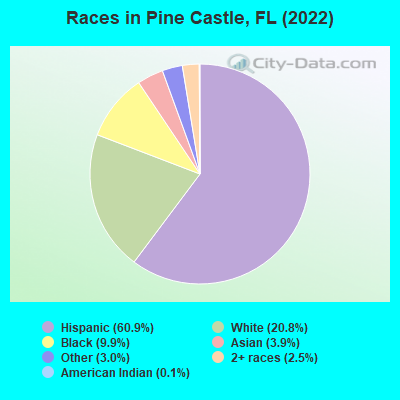
Population in 2010: 10,805. Population change since 2000: +22.7%Males: 5,500 Females: 5,305
March 2022 cost of living index in Pine Castle: 92.2 (less than average, U.S. average is 100) Percentage of residents living in poverty in 2022: 21.9%for White Non-Hispanic residents , 23.9% for Black residents , 27.4% for Hispanic or Latino residents , 48.0% for American Indian residents , 47.9% for other race residents , 12.6% for two or more races residents )Business Search - 14 Million verified businesses
Data:
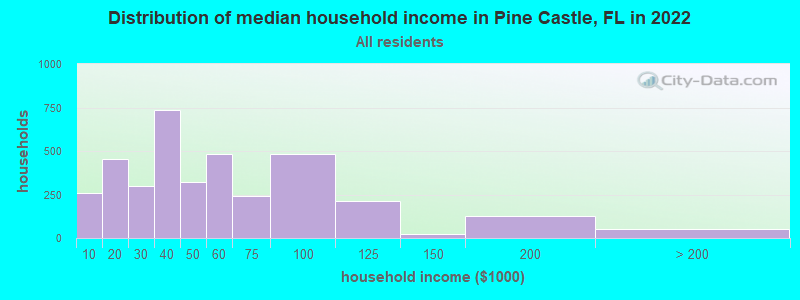
Median household income ($)
Median household income (% change since 2000)
Household income diversity
Ratio of average income to average house value (%)
Ratio of average income to average rent
Median household income ($) - White
Median household income ($) - Black or African American
Median household income ($) - Asian
Median household income ($) - Hispanic or Latino
Median household income ($) - American Indian and Alaska Native
Median household income ($) - Multirace
Median household income ($) - Other Race
Median household income for houses/condos with a mortgage ($)
Median household income for apartments without a mortgage ($)
Races - White alone (%)
Races - White alone (% change since 2000)
Races - Black alone (%)
Races - Black alone (% change since 2000)
Races - American Indian alone (%)
Races - American Indian alone (% change since 2000)
Races - Asian alone (%)
Races - Asian alone (% change since 2000)
Races - Hispanic (%)
Races - Hispanic (% change since 2000)
Races - Native Hawaiian and Other Pacific Islander alone (%)
Races - Native Hawaiian and Other Pacific Islander alone (% change since 2000)
Races - Two or more races (%)
Races - Two or more races (% change since 2000)
Races - Other race alone (%)
Races - Other race alone (% change since 2000)
Racial diversity
Unemployment (%)
Unemployment (% change since 2000)
Unemployment (%) - White
Unemployment (%) - Black or African American
Unemployment (%) - Asian
Unemployment (%) - Hispanic or Latino
Unemployment (%) - American Indian and Alaska Native
Unemployment (%) - Multirace
Unemployment (%) - Other Race
Population density (people per square mile)
Population - Males (%)
Population - Females (%)
Population - Males (%) - White
Population - Males (%) - Black or African American
Population - Males (%) - Asian
Population - Males (%) - Hispanic or Latino
Population - Males (%) - American Indian and Alaska Native
Population - Males (%) - Multirace
Population - Males (%) - Other Race
Population - Females (%) - White
Population - Females (%) - Black or African American
Population - Females (%) - Asian
Population - Females (%) - Hispanic or Latino
Population - Females (%) - American Indian and Alaska Native
Population - Females (%) - Multirace
Population - Females (%) - Other Race
Coronavirus confirmed cases (May 31, 2024)
Deaths caused by coronavirus (May 31, 2024)
Coronavirus confirmed cases (per 100k population) (May 31, 2024)
Deaths caused by coronavirus (per 100k population) (May 31, 2024)
Daily increase in number of cases (May 31, 2024)
Weekly increase in number of cases (May 31, 2024)
Cases doubled (in days) (May 31, 2024)
Hospitalized patients (Apr 18, 2022)
Negative test results (Apr 18, 2022)
Total test results (Apr 18, 2022)
COVID Vaccine doses distributed (per 100k population) (Sep 19, 2023)
COVID Vaccine doses administered (per 100k population) (Sep 19, 2023)
COVID Vaccine doses distributed (Sep 19, 2023)
COVID Vaccine doses administered (Sep 19, 2023)
Likely homosexual households (%)
Likely homosexual households (% change since 2000)
Likely homosexual households - Lesbian couples (%)
Likely homosexual households - Lesbian couples (% change since 2000)
Likely homosexual households - Gay men (%)
Likely homosexual households - Gay men (% change since 2000)
Cost of living index
Median gross rent ($)
Median contract rent ($)
Median monthly housing costs ($)
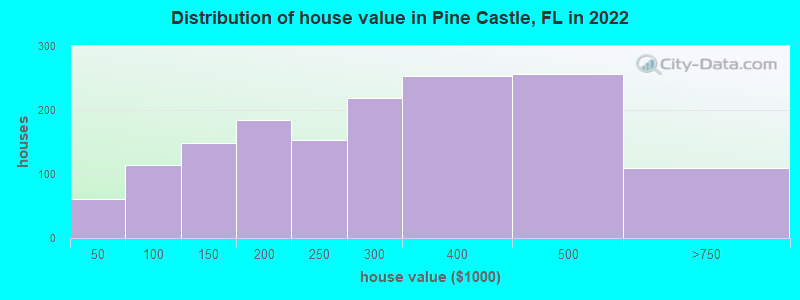
Median house or condo value ($)
Median house or condo value ($ change since 2000)
Mean house or condo value by units in structure - 1, detached ($)
Mean house or condo value by units in structure - 1, attached ($)
Mean house or condo value by units in structure - 2 ($)
Mean house or condo value by units in structure by units in structure - 3 or 4 ($)
Mean house or condo value by units in structure - 5 or more ($)
Mean house or condo value by units in structure - Boat, RV, van, etc. ($)
Mean house or condo value by units in structure - Mobile home ($)
Median house or condo value ($) - White
Median house or condo value ($) - Black or African American
Median house or condo value ($) - Asian
Median house or condo value ($) - Hispanic or Latino
Median house or condo value ($) - American Indian and Alaska Native
Median house or condo value ($) - Multirace
Median house or condo value ($) - Other Race
Median resident age
Resident age diversity
Median resident age - Males
Median resident age - Females
Median resident age - White
Median resident age - Black or African American
Median resident age - Asian
Median resident age - Hispanic or Latino
Median resident age - American Indian and Alaska Native
Median resident age - Multirace
Median resident age - Other Race
Median resident age - Males - White
Median resident age - Males - Black or African American
Median resident age - Males - Asian
Median resident age - Males - Hispanic or Latino
Median resident age - Males - American Indian and Alaska Native
Median resident age - Males - Multirace
Median resident age - Males - Other Race
Median resident age - Females - White
Median resident age - Females - Black or African American
Median resident age - Females - Asian
Median resident age - Females - Hispanic or Latino
Median resident age - Females - American Indian and Alaska Native
Median resident age - Females - Multirace
Median resident age - Females - Other Race
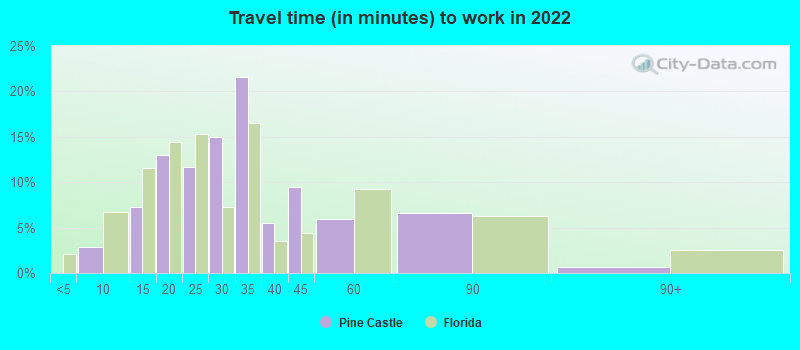
Commute - mean travel time to work (minutes)
Travel time to work - Less than 5 minutes (%)
Travel time to work - Less than 5 minutes (% change since 2000)
Travel time to work - 5 to 9 minutes (%)
Travel time to work - 5 to 9 minutes (% change since 2000)
Travel time to work - 10 to 19 minutes (%)
Travel time to work - 10 to 19 minutes (% change since 2000)
Travel time to work - 20 to 29 minutes (%)
Travel time to work - 20 to 29 minutes (% change since 2000)
Travel time to work - 30 to 39 minutes (%)
Travel time to work - 30 to 39 minutes (% change since 2000)
Travel time to work - 40 to 59 minutes (%)
Travel time to work - 40 to 59 minutes (% change since 2000)
Travel time to work - 60 to 89 minutes (%)
Travel time to work - 60 to 89 minutes (% change since 2000)
Travel time to work - 90 or more minutes (%)
Travel time to work - 90 or more minutes (% change since 2000)
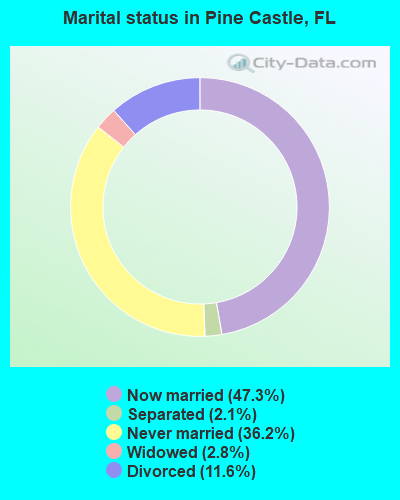
Marital status - Never married (%)
Marital status - Now married (%)
Marital status - Separated (%)
Marital status - Widowed (%)
Marital status - Divorced (%)
Median family income ($)
Median family income (% change since 2000)
Median non-family income ($)
Median non-family income (% change since 2000)
Median per capita income ($)
Median per capita income (% change since 2000)
Median family income ($) - White
Median family income ($) - Black or African American
Median family income ($) - Asian
Median family income ($) - Hispanic or Latino
Median family income ($) - American Indian and Alaska Native
Median family income ($) - Multirace
Median family income ($) - Other Race
Median year house/condo built
Median year apartment built
Year house built - Built 2005 or later (%)
Year house built - Built 2000 to 2004 (%)
Year house built - Built 1990 to 1999 (%)
Year house built - Built 1980 to 1989 (%)
Year house built - Built 1970 to 1979 (%)
Year house built - Built 1960 to 1969 (%)
Year house built - Built 1950 to 1959 (%)
Year house built - Built 1940 to 1949 (%)
Year house built - Built 1939 or earlier (%)
Average household size
Household density (households per square mile)
Average household size - White
Average household size - Black or African American
Average household size - Asian
Average household size - Hispanic or Latino
Average household size - American Indian and Alaska Native
Average household size - Multirace
Average household size - Other Race
Occupied housing units (%)
Vacant housing units (%)
Owner occupied housing units (%)
Renter occupied housing units (%)
Vacancy status - For rent (%)
Vacancy status - For sale only (%)
Vacancy status - Rented or sold, not occupied (%)
Vacancy status - For seasonal, recreational, or occasional use (%)
Vacancy status - For migrant workers (%)
Vacancy status - Other vacant (%)
Residents with income below the poverty level (%)
Residents with income below 50% of the poverty level (%)
Children below poverty level (%)
Poor families by family type - Married-couple family (%)
Poor families by family type - Male, no wife present (%)
Poor families by family type - Female, no husband present (%)
Poverty status for native-born residents (%)
Poverty status for foreign-born residents (%)
Poverty among high school graduates not in families (%)
Poverty among people who did not graduate high school not in families (%)
Residents with income below the poverty level (%) - White
Residents with income below the poverty level (%) - Black or African American
Residents with income below the poverty level (%) - Asian
Residents with income below the poverty level (%) - Hispanic or Latino
Residents with income below the poverty level (%) - American Indian and Alaska Native
Residents with income below the poverty level (%) - Multirace
Residents with income below the poverty level (%) - Other Race
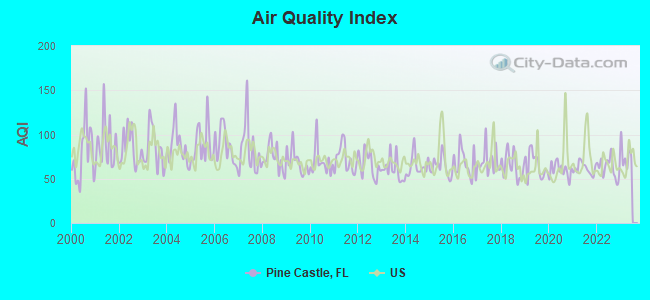
Air pollution - Air Quality Index (AQI)
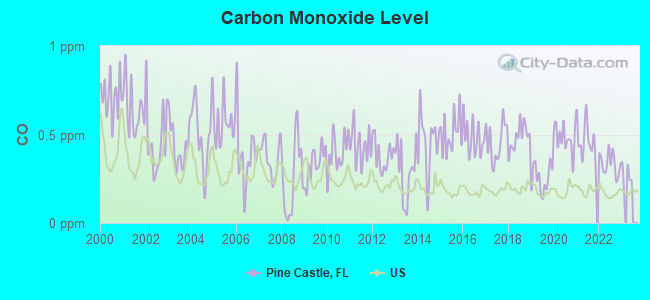
Air pollution - CO
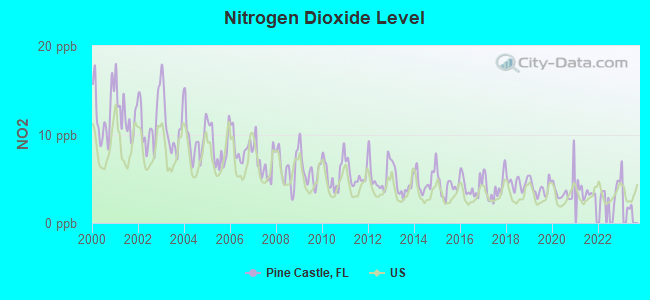
Air pollution - NO2
Air pollution - SO2
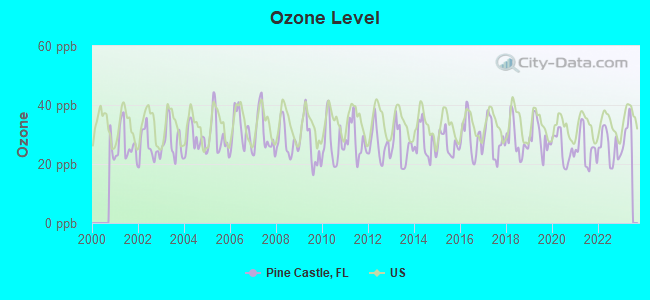
Air pollution - Ozone
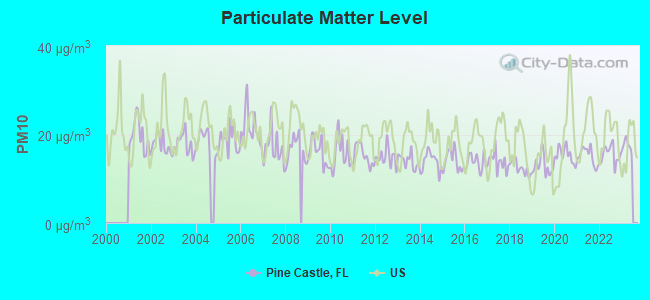
Air pollution - PM10
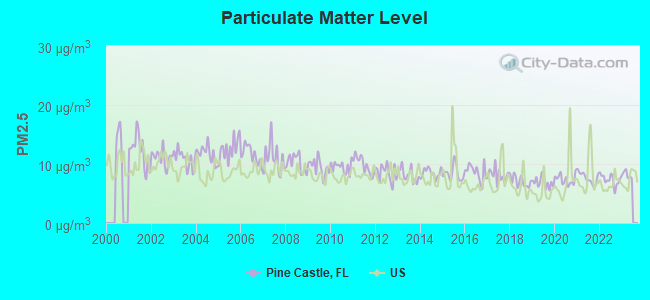
Air pollution - PM25
Air pollution - Pb
Crime - Murders per 100,000 population
Crime - Rapes per 100,000 population
Crime - Robberies per 100,000 population
Crime - Assaults per 100,000 population
Crime - Burglaries per 100,000 population
Crime - Thefts per 100,000 population
Crime - Auto thefts per 100,000 population
Crime - Arson per 100,000 population
Crime - City-data.com crime index
Crime - Violent crime index
Crime - Property crime index
Crime - Murders per 100,000 population (5 year average)
Crime - Rapes per 100,000 population (5 year average)
Crime - Robberies per 100,000 population (5 year average)
Crime - Assaults per 100,000 population (5 year average)
Crime - Burglaries per 100,000 population (5 year average)
Crime - Thefts per 100,000 population (5 year average)
Crime - Auto thefts per 100,000 population (5 year average)
Crime - Arson per 100,000 population (5 year average)
Crime - City-data.com crime index (5 year average)
Crime - Violent crime index (5 year average)
Crime - Property crime index (5 year average)
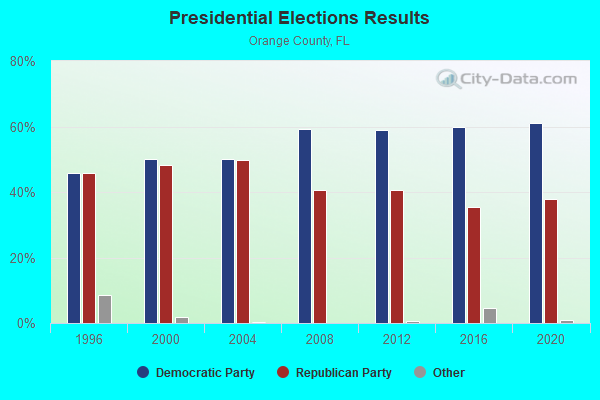
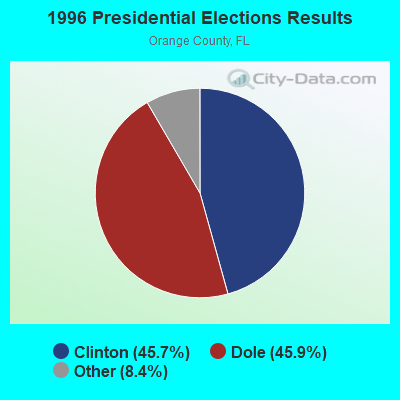
1996 Presidential Elections Results (%) - Democratic Party (Clinton)
1996 Presidential Elections Results (%) - Republican Party (Dole)
1996 Presidential Elections Results (%) - Other
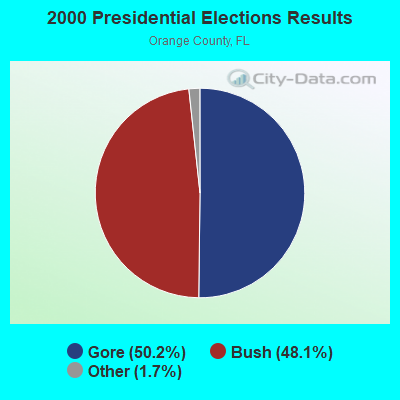
2000 Presidential Elections Results (%) - Democratic Party (Gore)
2000 Presidential Elections Results (%) - Republican Party (Bush)
2000 Presidential Elections Results (%) - Other
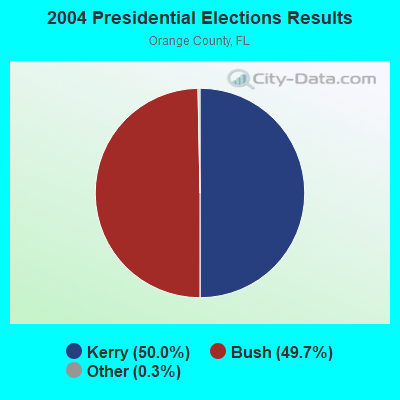
2004 Presidential Elections Results (%) - Democratic Party (Kerry)
2004 Presidential Elections Results (%) - Republican Party (Bush)
2004 Presidential Elections Results (%) - Other
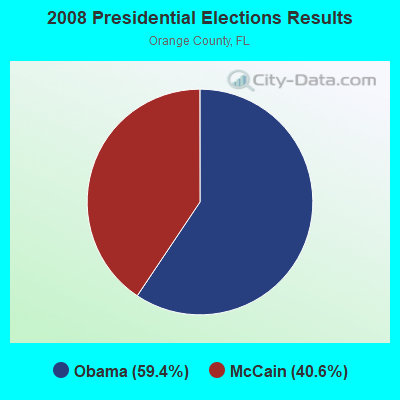
2008 Presidential Elections Results (%) - Democratic Party (Obama)
2008 Presidential Elections Results (%) - Republican Party (McCain)
2008 Presidential Elections Results (%) - Other
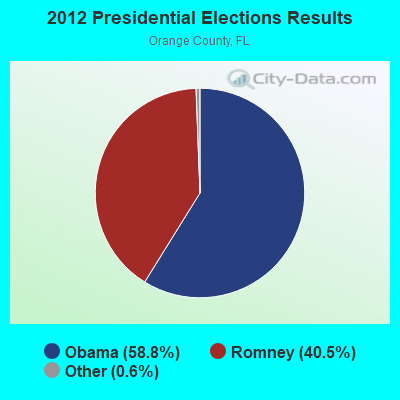
2012 Presidential Elections Results (%) - Democratic Party (Obama)
2012 Presidential Elections Results (%) - Republican Party (Romney)
2012 Presidential Elections Results (%) - Other
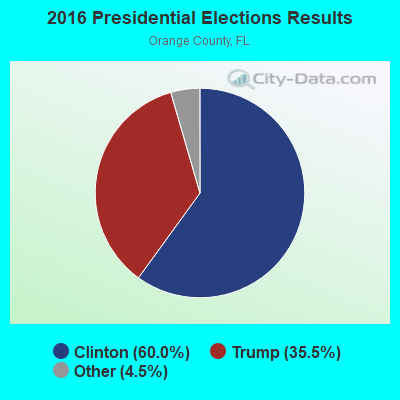
2016 Presidential Elections Results (%) - Democratic Party (Clinton)
2016 Presidential Elections Results (%) - Republican Party (Trump)
2016 Presidential Elections Results (%) - Other
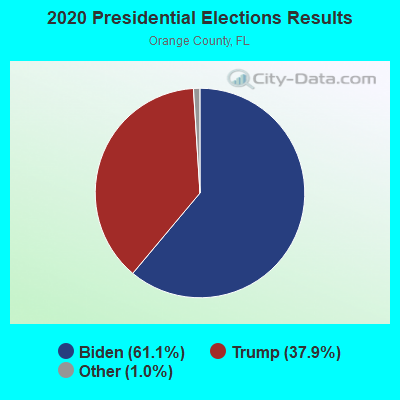
2020 Presidential Elections Results (%) - Democratic Party (Biden)
2020 Presidential Elections Results (%) - Republican Party (Trump)
2020 Presidential Elections Results (%) - Other
Ancestries Reported - Arab (%)
Ancestries Reported - Czech (%)
Ancestries Reported - Danish (%)
Ancestries Reported - Dutch (%)
Ancestries Reported - English (%)
Ancestries Reported - French (%)
Ancestries Reported - French Canadian (%)
Ancestries Reported - German (%)
Ancestries Reported - Greek (%)
Ancestries Reported - Hungarian (%)
Ancestries Reported - Irish (%)
Ancestries Reported - Italian (%)
Ancestries Reported - Lithuanian (%)
Ancestries Reported - Norwegian (%)
Ancestries Reported - Polish (%)
Ancestries Reported - Portuguese (%)
Ancestries Reported - Russian (%)
Ancestries Reported - Scotch-Irish (%)
Ancestries Reported - Scottish (%)
Ancestries Reported - Slovak (%)
Ancestries Reported - Subsaharan African (%)
Ancestries Reported - Swedish (%)
Ancestries Reported - Swiss (%)
Ancestries Reported - Ukrainian (%)
Ancestries Reported - United States (%)
Ancestries Reported - Welsh (%)
Ancestries Reported - West Indian (%)
Ancestries Reported - Other (%)
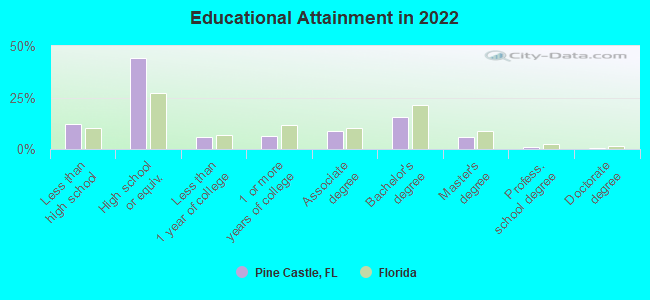
Educational Attainment - No schooling completed (%)
Educational Attainment - Less than high school (%)
Educational Attainment - High school or equivalent (%)
Educational Attainment - Less than 1 year of college (%)
Educational Attainment - 1 or more years of college (%)
Educational Attainment - Associate degree (%)
Educational Attainment - Bachelor's degree (%)
Educational Attainment - Master's degree (%)
Educational Attainment - Professional school degree (%)
Educational Attainment - Doctorate degree (%)
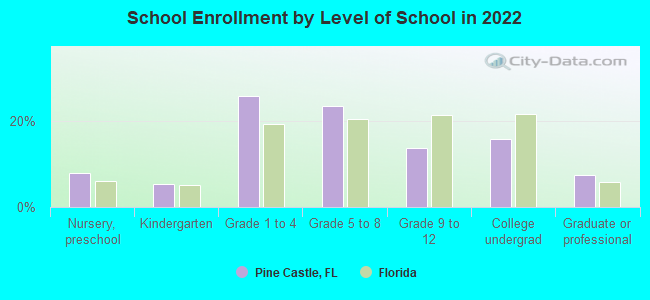
School Enrollment - Nursery, preschool (%)
School Enrollment - Kindergarten (%)
School Enrollment - Grade 1 to 4 (%)
School Enrollment - Grade 5 to 8 (%)
School Enrollment - Grade 9 to 12 (%)
School Enrollment - College undergrad (%)
School Enrollment - Graduate or professional (%)
School Enrollment - Not enrolled in school (%)
School enrollment - Public schools (%)
School enrollment - Private schools (%)
School enrollment - Not enrolled (%)
Median number of rooms in houses and condos
Median number of rooms in apartments
Housing units lacking complete plumbing facilities (%)
Housing units lacking complete kitchen facilities (%)
Density of houses
Urban houses (%)
Rural houses (%)
Households with people 60 years and over (%)
Households with people 65 years and over (%)
Households with people 75 years and over (%)
Households with one or more nonrelatives (%)
Households with no nonrelatives (%)
Population in households (%)
Family households (%)
Nonfamily households (%)
Population in families (%)
Family households with own children (%)
Median number of bedrooms in owner occupied houses
Mean number of bedrooms in owner occupied houses
Median number of bedrooms in renter occupied houses
Mean number of bedrooms in renter occupied houses
Median number of vehichles in owner occupied houses
Mean number of vehichles in owner occupied houses
Median number of vehichles in renter occupied houses
Mean number of vehichles in renter occupied houses
Mortgage status - with mortgage (%)
Mortgage status - with second mortgage (%)
Mortgage status - with home equity loan (%)
Mortgage status - with both second mortgage and home equity loan (%)
Mortgage status - without a mortgage (%)
Average family size
Average family size - White
Average family size - Black or African American
Average family size - Asian
Average family size - Hispanic or Latino
Average family size - American Indian and Alaska Native
Average family size - Multirace
Average family size - Other Race
Geographical mobility - Same house 1 year ago (%)
Geographical mobility - Moved within same county (%)
Geographical mobility - Moved from different county within same state (%)
Geographical mobility - Moved from different state (%)
Geographical mobility - Moved from abroad (%)
Place of birth - Born in state of residence (%)
Place of birth - Born in other state (%)
Place of birth - Native, outside of US (%)
Place of birth - Foreign born (%)
Housing units in structures - 1, detached (%)
Housing units in structures - 1, attached (%)
Housing units in structures - 2 (%)
Housing units in structures - 3 or 4 (%)
Housing units in structures - 5 to 9 (%)
Housing units in structures - 10 to 19 (%)
Housing units in structures - 20 to 49 (%)
Housing units in structures - 50 or more (%)
Housing units in structures - Mobile home (%)
Housing units in structures - Boat, RV, van, etc. (%)
House/condo owner moved in on average (years ago)
Renter moved in on average (years ago)
Year householder moved into unit - Moved in 1999 to March 2000 (%)
Year householder moved into unit - Moved in 1995 to 1998 (%)
Year householder moved into unit - Moved in 1990 to 1994 (%)
Year householder moved into unit - Moved in 1980 to 1989 (%)
Year householder moved into unit - Moved in 1970 to 1979 (%)
Year householder moved into unit - Moved in 1969 or earlier (%)
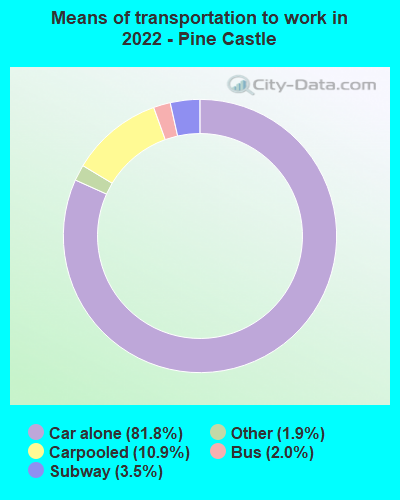
Means of transportation to work - Drove car alone (%)
Means of transportation to work - Carpooled (%)
Means of transportation to work - Public transportation (%)
Means of transportation to work - Bus or trolley bus (%)
Means of transportation to work - Streetcar or trolley car (%)
Means of transportation to work - Subway or elevated (%)
Means of transportation to work - Railroad (%)
Means of transportation to work - Ferryboat (%)
Means of transportation to work - Taxicab (%)
Means of transportation to work - Motorcycle (%)
Means of transportation to work - Bicycle (%)
Means of transportation to work - Walked (%)
Means of transportation to work - Other means (%)
Working at home (%)
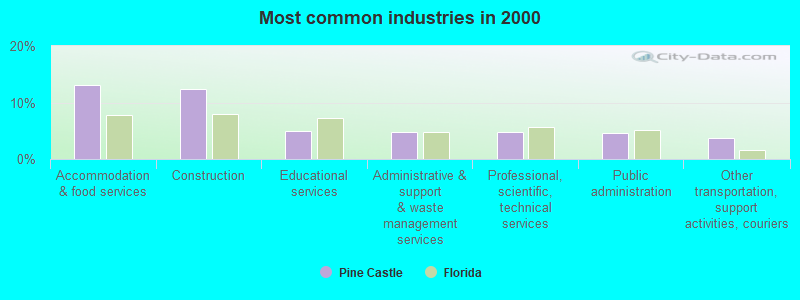
Industry diversity
Most Common Industries - Agriculture, forestry, fishing and hunting, and mining (%)
Most Common Industries - Agriculture, forestry, fishing and hunting (%)
Most Common Industries - Mining, quarrying, and oil and gas extraction (%)
Most Common Industries - Construction (%)
Most Common Industries - Manufacturing (%)
Most Common Industries - Wholesale trade (%)
Most Common Industries - Retail trade (%)
Most Common Industries - Transportation and warehousing, and utilities (%)
Most Common Industries - Transportation and warehousing (%)
Most Common Industries - Utilities (%)
Most Common Industries - Information (%)
Most Common Industries - Finance and insurance, and real estate and rental and leasing (%)
Most Common Industries - Finance and insurance (%)
Most Common Industries - Real estate and rental and leasing (%)
Most Common Industries - Professional, scientific, and management, and administrative and waste management services (%)
Most Common Industries - Professional, scientific, and technical services (%)
Most Common Industries - Management of companies and enterprises (%)
Most Common Industries - Administrative and support and waste management services (%)
Most Common Industries - Educational services, and health care and social assistance (%)
Most Common Industries - Educational services (%)
Most Common Industries - Health care and social assistance (%)
Most Common Industries - Arts, entertainment, and recreation, and accommodation and food services (%)
Most Common Industries - Arts, entertainment, and recreation (%)
Most Common Industries - Accommodation and food services (%)
Most Common Industries - Other services, except public administration (%)
Most Common Industries - Public administration (%)
Occupation diversity
Most Common Occupations - Management, business, science, and arts occupations (%)
Most Common Occupations - Management, business, and financial occupations (%)
Most Common Occupations - Management occupations (%)
Most Common Occupations - Business and financial operations occupations (%)
Most Common Occupations - Computer, engineering, and science occupations (%)
Most Common Occupations - Computer and mathematical occupations (%)
Most Common Occupations - Architecture and engineering occupations (%)
Most Common Occupations - Life, physical, and social science occupations (%)
Most Common Occupations - Education, legal, community service, arts, and media occupations (%)
Most Common Occupations - Community and social service occupations (%)
Most Common Occupations - Legal occupations (%)
Most Common Occupations - Education, training, and library occupations (%)
Most Common Occupations - Arts, design, entertainment, sports, and media occupations (%)
Most Common Occupations - Healthcare practitioners and technical occupations (%)
Most Common Occupations - Health diagnosing and treating practitioners and other technical occupations (%)
Most Common Occupations - Health technologists and technicians (%)
Most Common Occupations - Service occupations (%)
Most Common Occupations - Healthcare support occupations (%)
Most Common Occupations - Protective service occupations (%)
Most Common Occupations - Fire fighting and prevention, and other protective service workers including supervisors (%)
Most Common Occupations - Law enforcement workers including supervisors (%)
Most Common Occupations - Food preparation and serving related occupations (%)
Most Common Occupations - Building and grounds cleaning and maintenance occupations (%)
Most Common Occupations - Personal care and service occupations (%)
Most Common Occupations - Sales and office occupations (%)
Most Common Occupations - Sales and related occupations (%)
Most Common Occupations - Office and administrative support occupations (%)
Most Common Occupations - Natural resources, construction, and maintenance occupations (%)
Most Common Occupations - Farming, fishing, and forestry occupations (%)
Most Common Occupations - Construction and extraction occupations (%)
Most Common Occupations - Installation, maintenance, and repair occupations (%)
Most Common Occupations - Production, transportation, and material moving occupations (%)
Most Common Occupations - Production occupations (%)
Most Common Occupations - Transportation occupations (%)
Most Common Occupations - Material moving occupations (%)
People in Group quarters - Institutionalized population (%)
People in Group quarters - Correctional institutions (%)
People in Group quarters - Federal prisons and detention centers (%)
People in Group quarters - Halfway houses (%)
People in Group quarters - Local jails and other confinement facilities (including police lockups) (%)
People in Group quarters - Military disciplinary barracks (%)
People in Group quarters - State prisons (%)
People in Group quarters - Other types of correctional institutions (%)
People in Group quarters - Nursing homes (%)
People in Group quarters - Hospitals/wards, hospices, and schools for the handicapped (%)
People in Group quarters - Hospitals/wards and hospices for chronically ill (%)
People in Group quarters - Hospices or homes for chronically ill (%)
People in Group quarters - Military hospitals or wards for chronically ill (%)
People in Group quarters - Other hospitals or wards for chronically ill (%)
People in Group quarters - Hospitals or wards for drug/alcohol abuse (%)
People in Group quarters - Mental (Psychiatric) hospitals or wards (%)
People in Group quarters - Schools, hospitals, or wards for the mentally retarded (%)
People in Group quarters - Schools, hospitals, or wards for the physically handicapped (%)
People in Group quarters - Institutions for the deaf (%)
People in Group quarters - Institutions for the blind (%)
People in Group quarters - Orthopedic wards and institutions for the physically handicapped (%)
People in Group quarters - Wards in general hospitals for patients who have no usual home elsewhere (%)
People in Group quarters - Wards in military hospitals for patients who have no usual home elsewhere (%)
People in Group quarters - Juvenile institutions (%)
People in Group quarters - Long-term care (%)
People in Group quarters - Homes for abused, dependent, and neglected children (%)
People in Group quarters - Residential treatment centers for emotionally disturbed children (%)
People in Group quarters - Training schools for juvenile delinquents (%)
People in Group quarters - Short-term care, detention or diagnostic centers for delinquent children (%)
People in Group quarters - Type of juvenile institution unknown (%)
People in Group quarters - Noninstitutionalized population (%)
People in Group quarters - College dormitories (includes college quarters off campus) (%)
People in Group quarters - Military quarters (%)
People in Group quarters - On base (%)
People in Group quarters - Barracks, unaccompanied personnel housing (UPH), (Enlisted/Officer), ;and similar group living quarters for military personnel (%)
People in Group quarters - Transient quarters for temporary residents (%)
People in Group quarters - Military ships (%)
People in Group quarters - Group homes (%)
People in Group quarters - Homes or halfway houses for drug/alcohol abuse (%)
People in Group quarters - Homes for the mentally ill (%)
People in Group quarters - Homes for the mentally retarded (%)
People in Group quarters - Homes for the physically handicapped (%)
People in Group quarters - Other group homes (%)
People in Group quarters - Religious group quarters (%)
People in Group quarters - Dormitories (%)
People in Group quarters - Agriculture workers' dormitories on farms (%)
People in Group quarters - Job Corps and vocational training facilities (%)
People in Group quarters - Other workers' dormitories (%)
People in Group quarters - Crews of maritime vessels (%)
People in Group quarters - Other nonhousehold living situations (%)
People in Group quarters - Other noninstitutional group quarters (%)
Residents speaking English at home (%)
Residents speaking English at home - Born in the United States (%)
Residents speaking English at home - Native, born elsewhere (%)
Residents speaking English at home - Foreign born (%)
Residents speaking Spanish at home (%)
Residents speaking Spanish at home - Born in the United States (%)
Residents speaking Spanish at home - Native, born elsewhere (%)
Residents speaking Spanish at home - Foreign born (%)
Residents speaking other language at home (%)
Residents speaking other language at home - Born in the United States (%)
Residents speaking other language at home - Native, born elsewhere (%)
Residents speaking other language at home - Foreign born (%)
Class of Workers - Employee of private company (%)
Class of Workers - Self-employed in own incorporated business (%)
Class of Workers - Private not-for-profit wage and salary workers (%)
Class of Workers - Local government workers (%)
Class of Workers - State government workers (%)
Class of Workers - Federal government workers (%)
Class of Workers - Self-employed workers in own not incorporated business and Unpaid family workers (%)
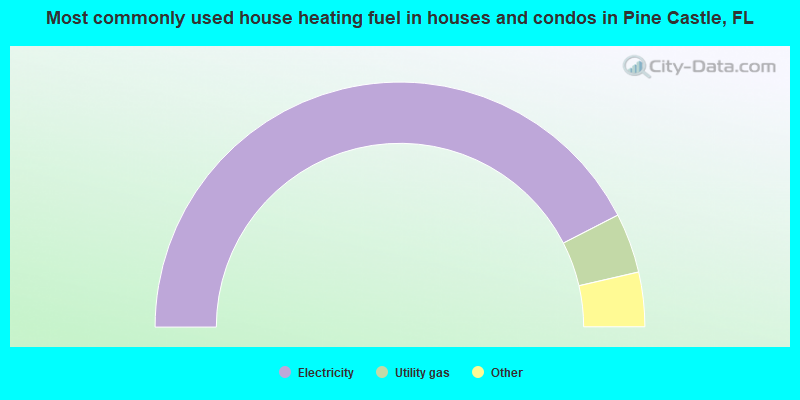
House heating fuel used in houses and condos - Utility gas (%)
House heating fuel used in houses and condos - Bottled, tank, or LP gas (%)
House heating fuel used in houses and condos - Electricity (%)
House heating fuel used in houses and condos - Fuel oil, kerosene, etc. (%)
House heating fuel used in houses and condos - Coal or coke (%)
House heating fuel used in houses and condos - Wood (%)
House heating fuel used in houses and condos - Solar energy (%)
House heating fuel used in houses and condos - Other fuel (%)
House heating fuel used in houses and condos - No fuel used (%)
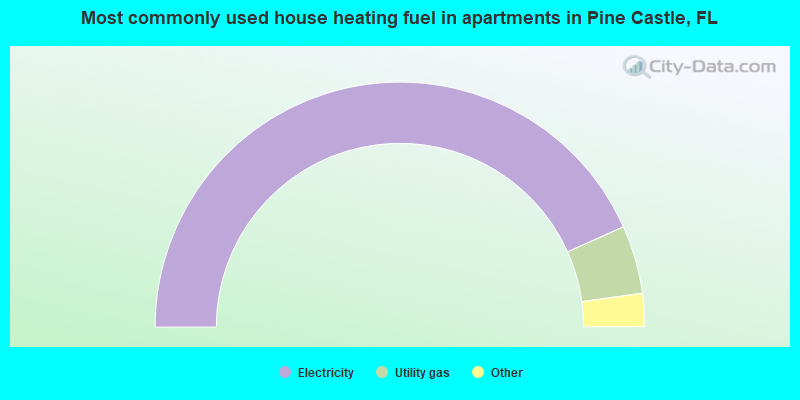
House heating fuel used in apartments - Utility gas (%)
House heating fuel used in apartments - Bottled, tank, or LP gas (%)
House heating fuel used in apartments - Electricity (%)
House heating fuel used in apartments - Fuel oil, kerosene, etc. (%)
House heating fuel used in apartments - Coal or coke (%)
House heating fuel used in apartments - Wood (%)
House heating fuel used in apartments - Solar energy (%)
House heating fuel used in apartments - Other fuel (%)
House heating fuel used in apartments - No fuel used (%)
Armed forces status - In Armed Forces (%)
Armed forces status - Civilian (%)
Armed forces status - Civilian - Veteran (%)
Armed forces status - Civilian - Nonveteran (%)
Fatal accidents locations in years 2005-2021
Fatal accidents locations in 2005
Fatal accidents locations in 2006
Fatal accidents locations in 2007
Fatal accidents locations in 2008
Fatal accidents locations in 2009
Fatal accidents locations in 2010
Fatal accidents locations in 2011
Fatal accidents locations in 2012
Fatal accidents locations in 2013
Fatal accidents locations in 2014
Fatal accidents locations in 2015
Fatal accidents locations in 2016
Fatal accidents locations in 2017
Fatal accidents locations in 2018
Fatal accidents locations in 2019
Fatal accidents locations in 2020
Fatal accidents locations in 2021
Alcohol use - People drinking some alcohol every month (%)
Alcohol use - People not drinking at all (%)
Alcohol use - Average days/month drinking alcohol
Alcohol use - Average drinks/week
Alcohol use - Average days/year people drink much
Audiometry - Average condition of hearing (%)
Audiometry - People that can hear a whisper from across a quiet room (%)
Audiometry - People that can hear normal voice from across a quiet room (%)
Audiometry - Ears ringing, roaring, buzzing (%)
Audiometry - Had a job exposure to loud noise (%)
Audiometry - Had off-work exposure to loud noise (%)
Blood Pressure & Cholesterol - Has high blood pressure (%)
Blood Pressure & Cholesterol - Checking blood pressure at home (%)
Blood Pressure & Cholesterol - Frequently checking blood cholesterol (%)
Blood Pressure & Cholesterol - Has high cholesterol level (%)
Consumer Behavior - Money monthly spent on food at supermarket/grocery store
Consumer Behavior - Money monthly spent on food at other stores
Consumer Behavior - Money monthly spent on eating out
Consumer Behavior - Money monthly spent on carryout/delivered foods
Consumer Behavior - Income spent on food at supermarket/grocery store (%)
Consumer Behavior - Income spent on food at other stores (%)
Consumer Behavior - Income spent on eating out (%)
Consumer Behavior - Income spent on carryout/delivered foods (%)
Current Health Status - General health condition (%)
Current Health Status - Blood donors (%)
Current Health Status - Has blood ever tested for HIV virus (%)
Current Health Status - Left-handed people (%)
Dermatology - People using sunscreen (%)
Diabetes - Diabetics (%)
Diabetes - Had a blood test for high blood sugar (%)
Diabetes - People taking insulin (%)
Diet Behavior & Nutrition - Diet health (%)
Diet Behavior & Nutrition - Milk product consumption (# of products/month)
Diet Behavior & Nutrition - Meals not home prepared (#/week)
Diet Behavior & Nutrition - Meals from fast food or pizza place (#/week)
Diet Behavior & Nutrition - Ready-to-eat foods (#/month)
Diet Behavior & Nutrition - Frozen meals/pizza (#/month)
Drug Use - People that ever used marijuana or hashish (%)
Drug Use - Ever used hard drugs (%)
Drug Use - Ever used any form of cocaine (%)
Drug Use - Ever used heroin (%)
Drug Use - Ever used methamphetamine (%)
Health Insurance - People covered by health insurance (%)
Kidney Conditions-Urology - Avg. # of times urinating at night
Medical Conditions - People with asthma (%)
Medical Conditions - People with anemia (%)
Medical Conditions - People with psoriasis (%)
Medical Conditions - People with overweight (%)
Medical Conditions - Elderly people having difficulties in thinking or remembering (%)
Medical Conditions - People who ever received blood transfusion (%)
Medical Conditions - People having trouble seeing even with glass/contacts (%)
Medical Conditions - People with arthritis (%)
Medical Conditions - People with gout (%)
Medical Conditions - People with congestive heart failure (%)
Medical Conditions - People with coronary heart disease (%)
Medical Conditions - People with angina pectoris (%)
Medical Conditions - People who ever had heart attack (%)
Medical Conditions - People who ever had stroke (%)
Medical Conditions - People with emphysema (%)
Medical Conditions - People with thyroid problem (%)
Medical Conditions - People with chronic bronchitis (%)
Medical Conditions - People with any liver condition (%)
Medical Conditions - People who ever had cancer or malignancy (%)
Mental Health - People who have little interest in doing things (%)
Mental Health - People feeling down, depressed, or hopeless (%)
Mental Health - People who have trouble sleeping or sleeping too much (%)
Mental Health - People feeling tired or having little energy (%)
Mental Health - People with poor appetite or overeating (%)
Mental Health - People feeling bad about themself (%)
Mental Health - People who have trouble concentrating on things (%)
Mental Health - People moving or speaking slowly or too fast (%)
Mental Health - People having thoughts they would be better off dead (%)
Oral Health - Average years since last visit a dentist
Oral Health - People embarrassed because of mouth (%)
Oral Health - People with gum disease (%)
Oral Health - General health of teeth and gums (%)
Oral Health - Average days a week using dental floss/device
Oral Health - Average days a week using mouthwash for dental problem
Oral Health - Average number of teeth
Pesticide Use - Households using pesticides to control insects (%)
Pesticide Use - Households using pesticides to kill weeds (%)
Physical Activity - People doing vigorous-intensity work activities (%)
Physical Activity - People doing moderate-intensity work activities (%)
Physical Activity - People walking or bicycling (%)
Physical Activity - People doing vigorous-intensity recreational activities (%)
Physical Activity - People doing moderate-intensity recreational activities (%)
Physical Activity - Average hours a day doing sedentary activities
Physical Activity - Average hours a day watching TV or videos
Physical Activity - Average hours a day using computer
Physical Functioning - People having limitations keeping them from working (%)
Physical Functioning - People limited in amount of work they can do (%)
Physical Functioning - People that need special equipment to walk (%)
Physical Functioning - People experiencing confusion/memory problems (%)
Physical Functioning - People requiring special healthcare equipment (%)
Prescription Medications - Average number of prescription medicines taking
Preventive Aspirin Use - Adults 40+ taking low-dose aspirin (%)
Reproductive Health - Vaginal deliveries (%)
Reproductive Health - Cesarean deliveries (%)
Reproductive Health - Deliveries resulted in a live birth (%)
Reproductive Health - Pregnancies resulted in a delivery (%)
Reproductive Health - Women breastfeeding newborns (%)
Reproductive Health - Women that had a hysterectomy (%)
Reproductive Health - Women that had both ovaries removed (%)
Reproductive Health - Women that have ever taken birth control pills (%)
Reproductive Health - Women taking birth control pills (%)
Reproductive Health - Women that have ever used Depo-Provera or injectables (%)
Reproductive Health - Women that have ever used female hormones (%)
Sexual Behavior - People 18+ that ever had sex (vaginal, anal, or oral) (%)
Sexual Behavior - Males 18+ that ever had vaginal sex with a woman (%)
Sexual Behavior - Males 18+ that ever performed oral sex on a woman (%)
Sexual Behavior - Males 18+ that ever had anal sex with a woman (%)
Sexual Behavior - Males 18+ that ever had any sex with a man (%)
Sexual Behavior - Females 18+ that ever had vaginal sex with a man (%)
Sexual Behavior - Females 18+ that ever performed oral sex on a man (%)
Sexual Behavior - Females 18+ that ever had anal sex with a man (%)
Sexual Behavior - Females 18+ that ever had any kind of sex with a woman (%)
Sexual Behavior - Average age people first had sex
Sexual Behavior - Average number of female sex partners in lifetime (males 18+)
Sexual Behavior - Average number of female vaginal sex partners in lifetime (males 18+)
Sexual Behavior - Average age people first performed oral sex on a woman (18+)
Sexual Behavior - Average number of woman performed oral sex on in lifetime (18+)
Sexual Behavior - Average number of male sex partners in lifetime (males 18+)
Sexual Behavior - Average number of male anal sex partners in lifetime (males 18+)
Sexual Behavior - Average age people first performed oral sex on a man (18+)
Sexual Behavior - Average number of male oral sex partners in lifetime (18+)
Sexual Behavior - People using protection when performing oral sex (%)
Sexual Behavior - Average number of times people have vaginal or anal sex a year
Sexual Behavior - People having sex without condom (%)
Sexual Behavior - Average number of male sex partners in lifetime (females 18+)
Sexual Behavior - Average number of male vaginal sex partners in lifetime (females 18+)
Sexual Behavior - Average number of female sex partners in lifetime (females 18+)
Sexual Behavior - Circumcised males 18+ (%)
Sleep Disorders - Average hours sleeping at night
Sleep Disorders - People that has trouble sleeping (%)
Smoking-Cigarette Use - People smoking cigarettes (%)
Taste & Smell - People 40+ having problems with smell (%)
Taste & Smell - People 40+ having problems with taste (%)
Taste & Smell - People 40+ that ever had wisdom teeth removed (%)
Taste & Smell - People 40+ that ever had tonsils teeth removed (%)
Taste & Smell - People 40+ that ever had a loss of consciousness because of a head injury (%)
Taste & Smell - People 40+ that ever had a broken nose or other serious injury to face or skull (%)
Taste & Smell - People 40+ that ever had two or more sinus infections (%)
Weight - Average height (inches)
Weight - Average weight (pounds)
Weight - Average BMI
Weight - People that are obese (%)
Weight - People that ever were obese (%)
Weight - People trying to lose weight (%)
Latest news from Pine Castle, FL collected exclusively by city-data.com from local newspapers, TV, and radio stations
Ancestries: Haitian (10.4%), Italian (6.6%), German (2.9%), American (2.8%), French (1.7%), U.S. Virgin Islander (1.0%).
Current Local Time:
Land area: 2.62 square miles.
Population density: 4,130 people per square mile (average).
3,037 residents are foreign born (23.3% Latin America , 3.9% Asia ).
This place:
31.2%Florida:
21.1%
Median real estate property taxes paid for housing units with mortgages in 2022: $1,516 (0.5%)Median real estate property taxes paid for housing units with no mortgage in 2022: $1,289 (0.5%)
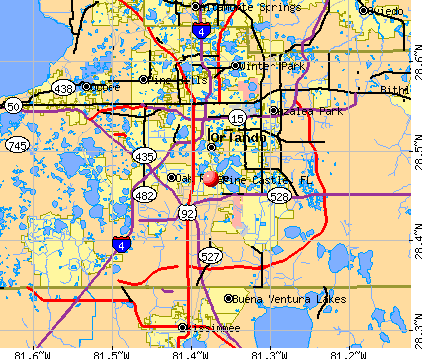
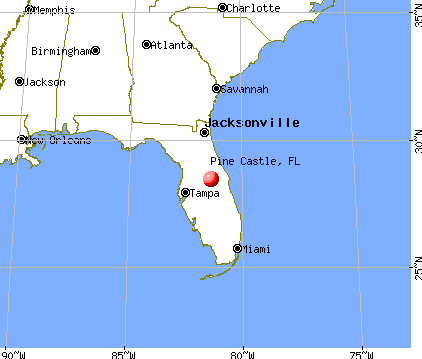
Nearest city with pop. 50,000+: Orlando, FL
Nearest city with pop. 200,000+: Tampa, FL
Nearest city with pop. 1,000,000+: Houston, TX
Nearest cities:
Latitude: 28.47 N, Longitude: 81.37 W
Daytime population change due to commuting: -1,340 (-13.8%)Workers who live and work in this place: 831 (19.7%)
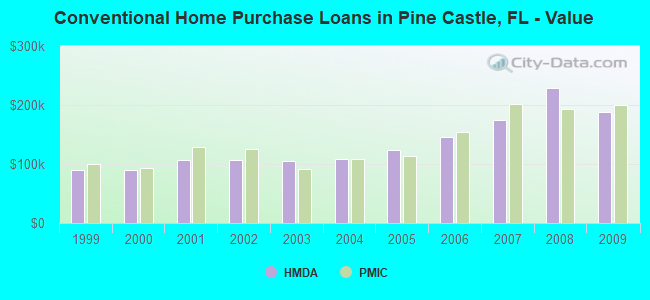
Property values in Pine Castle, FL
Unemployment in December 2023:
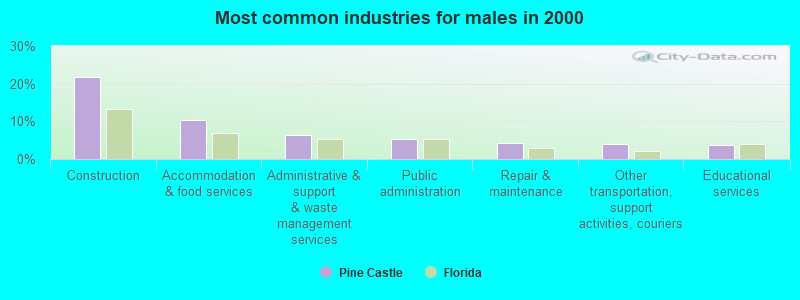
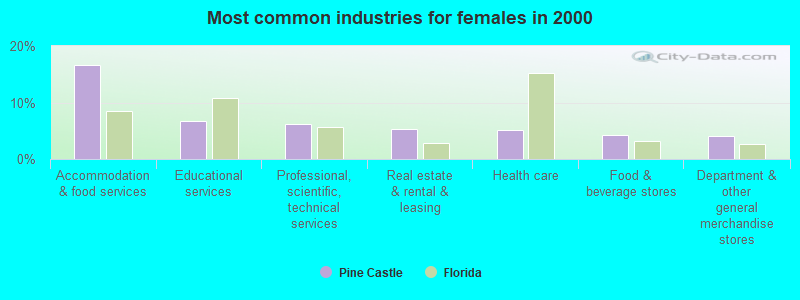
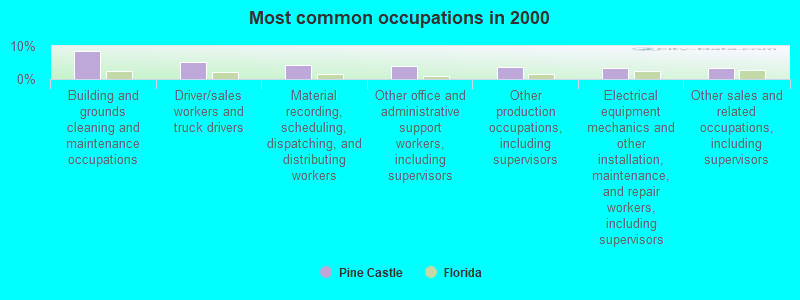
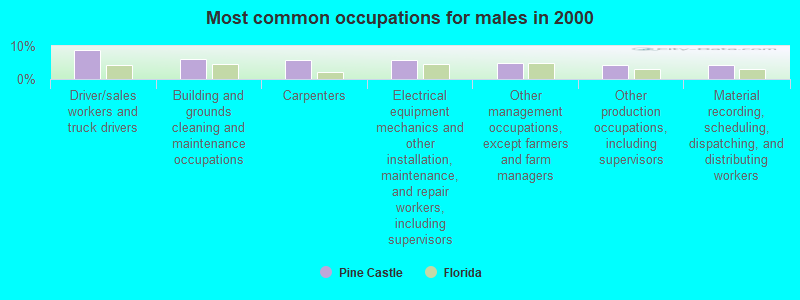
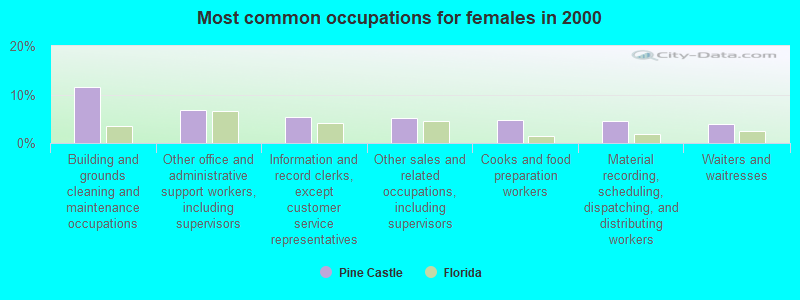
Most common occupations in Pine Castle, FL (%)
Both Males Females
Building and grounds cleaning and maintenance occupations (8.4%)
Driver/sales workers and truck drivers (5.1%)
Material recording, scheduling, dispatching, and distributing workers (4.4%)
Other office and administrative support workers, including supervisors (4.1%)
Other production occupations, including supervisors (3.6%)
Electrical equipment mechanics and other installation, maintenance, and repair workers, including supervisors (3.5%)
Other sales and related occupations, including supervisors (3.3%)
Driver/sales workers and truck drivers (8.9%)
Building and grounds cleaning and maintenance occupations (6.0%)
Carpenters (5.8%)
Electrical equipment mechanics and other installation, maintenance, and repair workers, including supervisors (5.7%)
Other management occupations, except farmers and farm managers (4.8%)
Other production occupations, including supervisors (4.2%)
Material recording, scheduling, dispatching, and distributing workers (4.2%)
Building and grounds cleaning and maintenance occupations (11.5%)
Other office and administrative support workers, including supervisors (6.9%)
Information and record clerks, except customer service representatives (5.4%)
Other sales and related occupations, including supervisors (5.1%)
Cooks and food preparation workers (4.7%)
Material recording, scheduling, dispatching, and distributing workers (4.6%)
Waiters and waitresses (4.0%)
Tornado activity:
Pine Castle-area historical tornado activity is above Florida state average. It is 51% greater than the overall U.S. average.
On 3/19/1981, a category F3 (max. wind speeds 158-206 mph) tornado 3.5 miles away from the Pine Castle place center injured one person and caused between $500,000 and $5,000,000 in damages.
On 2/22/1998, a category F3 tornado 12.1 miles away from the place center killed 3 people and injured 70 people and caused $15 million in damages.
Earthquake activity:
Pine Castle-area historical earthquake activity is significantly above Florida state average. It is 89% smaller than the overall U.S. average. On 9/10/2006 at 14:56:08, a magnitude 5.9 (5.9 MB, 5.5 MS, 5.8 MW, Class: Moderate, Intensity: VI - VII) earthquake occurred 357.4 miles away from Pine Castle center On 11/22/1974 at 05:25:55, a magnitude 4.7 (4.7 MB, Class: Light, Intensity: IV - V) earthquake occurred 315.1 miles away from the city center On 6/23/2016 at 17:20:29, a magnitude 3.8 (3.8 ML, Class: Light, Intensity: II - III) earthquake occurred 157.0 miles away from Pine Castle center On 9/4/2016 at 18:29:29, a magnitude 3.8 (3.8 ML) earthquake occurred 157.8 miles away from Pine Castle center On 9/21/2016 at 16:30:52, a magnitude 3.8 (3.8 ML) earthquake occurred 158.4 miles away from the city center On 7/16/2016 at 20:00:10, a magnitude 3.7 (3.7 MB) earthquake occurred 147.6 miles away from the city center Magnitude types: body-wave magnitude (MB), local magnitude (ML), surface-wave magnitude (MS), moment magnitude (MW) Natural disasters: The number of natural disasters in Orange County (20) is greater than the US average (15).Major Disasters (Presidential) Declared: 9Emergencies Declared: 6Hurricanes: 10, Fires: 5, Tropical Storms: 4, Tornado: 1, Other: 1 (Note: some incidents may be assigned to more than one category). Hospitals and medical centers near Pine Castle: ORLANDO SOUTHWEST DIALYSIS (Dialysis Facility, about 2 miles away; ORLANDO, FL)
CONTINUOUS CARE HEALTH SERVICES CORP (Home Health Center, about 2 miles away; ORLANDO, FL)
NURSE ON CALL - BEST CHOICE (Home Health Center, about 3 miles away; ORLANDO, FL)
FLORIDA DIALYSIS CENTER OF ORLANDO LLC (Dialysis Facility, about 4 miles away; ORLANDO, FL)
ORLANDO HEALTH AND REHABILITATION CENTER (Nursing Home, about 4 miles away; ORLANDO, FL)
PARKS HEALTHCARE AND REHABILITATION CENTER (Nursing Home, about 4 miles away; ORLANDO, FL)
ALPHA HOME HEALTH SOLUTIONS LLC (Home Health Center, about 4 miles away; ORLANDO, FL)
Amtrak stations near Pine Castle: 4 miles: ORLANDO (1400 SLIGH BLVD.) Services: ticket office, fully wheelchair accessible, enclosed waiting area, public restrooms, public payphones, vending machines, free short-term parking, car rental agency, taxi stand, public transit connection.
10 miles: WINTER PARK (150 W. MORSE BLVD.) Services: ticket office, partially wheelchair accessible, enclosed waiting area, public restrooms, public payphones, full-service food facilities, free short-term parking, free long-term parking, call for car rental service, taxi stand, public transit connection.
10 miles: LAKE BUENA VISTA (12521 RTE. 535) - Bus Station Services: fully wheelchair accessible.
Colleges/universities with over 2000 students nearest to Pine Castle:
Universal Technical Institute-Auto Motorcycle & Marine Mechanics Institute Division-Orlando (about 4 miles; Orlando, FL ; Full-time enrollment: 4,338)
Everest University-South Orlando (about 4 miles; Orlando, FL ; FT enrollment: 33,859)
Valencia College (about 7 miles; Orlando, FL ; FT enrollment: 30,467)
Rollins College (about 9 miles; Winter Park, FL ; FT enrollment: 3,085)
Full Sail University (about 10 miles; Winter Park, FL ; FT enrollment: 31,435)
Florida Technical College (about 14 miles; Orlando, FL ; FT enrollment: 4,907)
University of Central Florida (about 15 miles; Orlando, FL ; FT enrollment: 51,457)
Notable locations in Pine Castle: (A) , Orange County Fire Rescue Department Station 70 (B) , Edgewood Police Department (C) . Display/hide their locations on the map
Churches in Pine Castle include: (A) , First Baptist Church Pine Castle (B) , Saint Mary of the Angels (C) , Pine Castle United Methodist Youth Center (D) , First Baptist Church of Pine Castle (E) , Galatian Baptist Church (F) , Galilean Family Worship Center Church of Nazarene (G) , Iglesia Bautista Jerusalem (H) , Iglesia Betania (I) . Display/hide their locations on the map
Lakes: (A) , Bear Head Lake (B) , Lake Mary (C) . Display/hide their locations on the map
Orange County has a predicted average indoor radon screening level less than 2 pCi/L (pico curies per liter) - Low Potential Average household size: This place:
3.0 peopleFlorida:
2.5 people
Percentage of family households: This place:
70.8%Whole state:
65.2%
Percentage of households with unmarried partners: This place:
10.3%Whole state:
7.3%
Likely homosexual households (counted as self-reported same-sex unmarried-partner households)
Lesbian couples: 0.4% of all households Gay men: 0.5% of all households
4 people in other noninstitutional facilities in 2010
For population 15 years and over in Pine Castle:
Never married: 36.2%Now married: 47.3%Separated: 2.1%Widowed: 2.8%Divorced: 11.6% For population 25 years and over in Pine Castle:
High school or higher: 87.9%Bachelor's degree or higher: 20.5%Graduate or professional degree: 7.1%Unemployed: 6.4%Mean travel time to work (commute): 20.6 minutes
Education Gini index (Inequality in education) Here:
12.5Florida average:
12.2
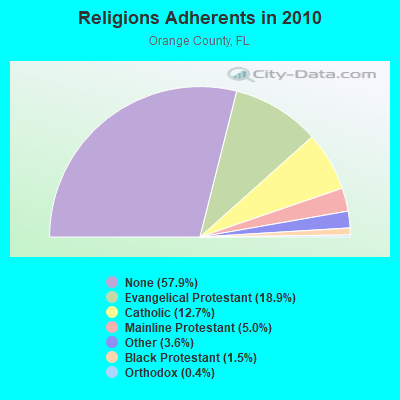
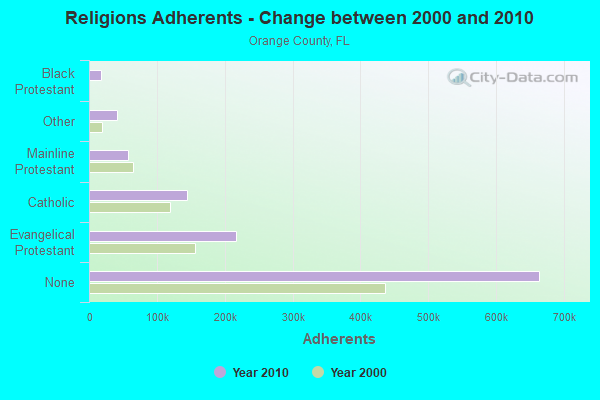
Religion statistics for Pine Castle, FL (based on Orange County data)
Religion Adherents Congregations Evangelical Protestant 216,980 575 Catholic 145,082 21 Mainline Protestant 57,086 93 Other 41,245 85 Black Protestant 17,240 41 Orthodox 4,620 9 None 663,703 -
Source: Clifford Grammich, Kirk Hadaway, Richard Houseal, Dale E.Jones, Alexei Krindatch, Richie Stanley and Richard H.Taylor. 2012. 2010 U.S.Religion Census: Religious Congregations & Membership Study. Association of Statisticians of American Religious Bodies. Jones, Dale E., et al. 2002. Congregations and Membership in the United States 2000. Nashville, TN: Glenmary Research Center. Graphs represent county-level data
Food Environment Statistics: Number of grocery stores : 230This county :
2.16 / 10,000 pop.Florida :
2.04 / 10,000 pop.
Number of supercenters and club stores : 16Here :
0.15 / 10,000 pop.Florida :
0.11 / 10,000 pop.
Number of convenience stores (no gas) : 122Here :
1.15 / 10,000 pop.Florida :
1.28 / 10,000 pop.
Number of convenience stores (with gas) : 365Orange County :
3.43 / 10,000 pop.Florida :
3.04 / 10,000 pop.
Number of full-service restaurants : 881Here :
8.28 / 10,000 pop.Florida :
7.45 / 10,000 pop.
Adult diabetes rate : Orange County :
9.1%Florida :
9.2%
Adult obesity rate : Orange County :
23.0%State :
23.7%
Low-income preschool obesity rate : Orange County :
13.7%Florida :
14.0%
Health and Nutrition: Healthy diet rate : Pine Castle:
48.3%Florida:
51.4%
Average overall health of teeth and gums : Pine Castle:
46.5%Florida:
49.4%
Average BMI : Pine Castle:
28.7State:
28.6
People feeling badly about themselves : Pine Castle:
20.7%Florida:
19.5%
People not drinking alcohol at all : Pine Castle:
10.8%Florida:
10.7%
Average hours sleeping at night : General health condition : Pine Castle:
55.7%State:
57.0%
Average condition of hearing : Pine Castle:
80.9%Florida:
79.2%
More about Health and Nutrition of Pine Castle, FL Residents
9.30% of this county's 2021 resident taxpayers lived in other counties in 2020 ($65,230 average adjusted gross income )
Here:
9.30%Florida average:
8.80%
0.07% of residents moved from foreign countries ($313 average AGI )Orange County:
0.07%Florida average:
0.05%
Top counties from which taxpayers relocated into this county between 2020 and 2021:
9.84% of this county's 2020 resident taxpayers moved to other counties in 2021 ($59,746 average adjusted gross income )
Here:
9.84%Florida average:
7.45%
0.07% of residents moved to foreign countries ($244 average AGI )Orange County:
0.07%Florida average:
0.04%
Top counties to which taxpayers relocated from this county between 2020 and 2021: Strongest AM radio stations in Pine Castle:
WIXL (1190 AM; 5 kW; PINE CASTLE-SKY LAKE, FL; Owner: GENESIS COMMUNICATIONS I, INC.)
WDYZ (990 AM; 50 kW; ORLANDO, FL; Owner: ABC, INC.)
WHOO (1080 AM; daytime; 35 kW; KISSIMMEE, FL; Owner: GENESIS COMMUNICATIONS I, INC.)
WTLN (950 AM; 12 kW; ORLANDO, FL; Owner: TM2, INC.)
WQTM (740 AM; 50 kW; ORLANDO, FL; Owner: CLEAR CHANNEL BROADCASTING LICENSES, INC.)
WFLF (540 AM; 50 kW; PINE HILLS, FL; Owner: CLEAR CHANNEL BROADCASTING LICENSES, INC.)
WONQ (1030 AM; 45 kW; OVIEDO, FL; Owner: FLORIDA BROADCASTERS)
WDBO (580 AM; 5 kW; ORLANDO, FL; Owner: COX RADIO, INC.)
WRLZ (1270 AM; 5 kW; EATONVILLE, FL; Owner: RADIO LUZ, INC.)
WRMQ (1140 AM; 5 kW; ORLANDO, FL; Owner: FLORIDA BROADCASTERS)
WPRD (1440 AM; 5 kW; WINTER PARK, FL; Owner: J & V COMMUNICATIONS, INC.)
WIXC (1060 AM; 50 kW; TITUSVILLE, FL; Owner: GENESIS COMMUNICATIONS I, INC.)
WLAA (1680 AM; 10 kW; WINTER GARDEN, FL; Owner: RAMA COMMUNICATIONS, INC.)
Strongest FM radio stations in Pine Castle:
WMMO (98.9 FM; ORLANDO, FL; Owner: COX RADIO, INC.)
WXXL (106.7 FM; TAVARES, FL; Owner: AMFM RADIO LICENSES, L.L.C.)
WLOQ (103.1 FM; WINTER PARK, FL; Owner: GROSS COMMUNICATIONS CORPORATION)
WJRR (101.1 FM; COCOA BEACH, FL; Owner: CLEAR CHANNEL BROADCASTING LICENSES, INC.)
WSHE (100.3 FM; ORLANDO, FL; Owner: CLEAR CHANNEL BROADCASTING LICENSES, INC.)
WTKS-FM (104.1 FM; COCOA BEACH, FL; Owner: CLEAR CHANNEL BROADCASTING LICENSES, INC.)
WOMX-FM (105.1 FM; ORLANDO, FL; Owner: INFINITY RADIO OPERATIONS INC.)
WHTQ (96.5 FM; ORLANDO, FL; Owner: COX RADIO, INC.)
WWKA (92.3 FM; ORLANDO, FL; Owner: COX RADIO, INC.)
WPOZ (88.3 FM; UNION PARK, FL; Owner: CENTRAL FLORIDA EDUCATIONAL FOUNDATION, INC.)
WPCV (97.5 FM; WINTER HAVEN, FL; Owner: HALL COMMUNICATIONS, INC.)
WMGF (107.7 FM; MOUNT DORA, FL; Owner: CLEAR CHANNEL BROADCASTING LICENSES, INC.)
WUCF-FM (89.9 FM; ORLANDO, FL; Owner: UNIVERSITY OF CENTRAL FLORIDA)
WMFE-FM (90.7 FM; ORLANDO, FL; Owner: COMMUNITY COMMUNICATIONS, INC.)
WOCL (105.9 FM; DELAND, FL; Owner: INFINITY RADIO OPERATIONS INC.)
WPYO (95.3 FM; APOPKA, FL; Owner: CXR HOLDINGS, INC.)
WCFB (94.5 FM; DAYTONA BEACH, FL; Owner: COX RADIO, INC.)
WJHM (101.9 FM; DAYTONA BEACH, FL; Owner: INFINITY RADIO OPERATIONS INC.)
WLAZ (89.1 FM; KISSIMMEE, FL; Owner: CAGUAS EDUCATIONAL TV, INC.)
WWKQ (88.7 FM; CLERMONT, FL; Owner: HISPANIC BROADCAST SYSTEM, INC.)
TV broadcast stations around Pine Castle:
WZXZ-CA (Channel 11; ORLANDO, ETC., FL; Owner: THE BOX WORLDWIDE LLC)
WOKB-LP (Channel 7; ORLANDO, FL; Owner: RAMA COMMUNICATIONS)
WRCF-LP (Channel 29; ORLANDO, FL; Owner: CHARLES S. NAMEY)
WFOL-LP (Channel 4; ORLANDO, FL; Owner: NATIVE COUNTRY B/CING. CORPORATION)
WFTV (Channel 9; ORLANDO, FL; Owner: WFTV-TV HOLDINGS, INC.)
WKMG-TV (Channel 6; ORLANDO, FL; Owner: POST-NEWSWEEK STATIONS ORLANDO, INC.)
WACX (Channel 55; LEESBURG, FL; Owner: ASSOCIATED CHRISTIAN TELEVISION SYSTEM, INC.)
WKCF (Channel 18; CLERMONT, FL; Owner: EMMIS TELEVISION LICENSE CORPORATION)
WLCB-TV (Channel 45; LEESBURG, FL; Owner: GOOD LIFE BROADCASTING, INC.)
WRBW (Channel 65; ORLANDO, FL; Owner: FOX TELEVISION STATIONS, INC.)
WOFL (Channel 35; ORLANDO, FL; Owner: FOX TELEVISION STATIONS, INC.)
WRDQ (Channel 27; ORLANDO, FL; Owner: WFTV-TV HOLDINGS, INC.)
WMFE-TV (Channel 24; ORLANDO, FL; Owner: COMMUNITY COMMUNICATIONS, INC.)
WESH (Channel 2; DAYTONA BEACH, FL; Owner: ORLANDO HEARST-ARGYLE TELEVISION, INC.)
W21AU (Channel 21; ORLANDO, FL; Owner: CENTRAL BROADCAST COMPANY)
WVCI-LP (Channel 16; ORLANDO, FL; Owner: ENTRAVISION HOLDINGS, LLC)
WTGL-TV (Channel 52; COCOA, FL; Owner: GOOD LIFE BROADCASTING, INC.)
WPXG-LP (Channel 31; ORLANDO, FL; Owner: TIGER EYE BROADCASTING CORPORATION)
WBCC (Channel 68; COCOA, FL; Owner: BREVARD COMMUNITY COLLEGE)
WOPX (Channel 56; MELBOURNE, FL; Owner: PAXSON ORLANDO LICENSE, INC.)
WXXU-LP (Channel 12; ALTAMONTE SPRINGS, FL; Owner: RAMA COMMUNICATIONS)
WTOF-LP (Channel 22; ORLANDO, FL; Owner: CHARLES S. NAMEY)
WVEN-TV (Channel 26; DAYTONA BEACH, FL; Owner: ENTRAVISION HOLDINGS, LLC)
WSWF-LP (Channel 13; UNION PARK, FL; Owner: SPECIALTY BROADCASTING CORPORATION)
WTMO-LP (Channel 40; KISSIMMEE, FL; Owner: ZGS BROADCASTING OF ORLANDO, INC.)
National Bridge Inventory (NBI) Statistics 9 Number of bridges171ft / 51.5m Total length314,600 Total average daily traffic28,238 Total average daily truck traffic
FCC Registered Antenna Towers: 26 (
See the full list of FCC Registered Antenna Towers in Pine Castle )
FCC Registered Microwave Towers: 4
Pine Castle, Rrs Orlando-West Palm Bch R1s (088462 / Pine Castle) (Lat: 28.417417 Lon: -81.242639), Type: Tower, Structure height: 77.7 m, Overall height: 79.6 m, Call Sign: WPWE381, Assigned Frequencies: 7112.50 MHz, Grant Date: 10/28/2002, Cancellation Date: 02/12/2021, Certifier: William L Watson, Registrant: The E.W. Scripps Company, 601 Clearwater Park Road, West Palm Beach, FL 33401, Phone: (561) 682-4110, Fax: (561) 659-4754, Email:
Pine Castle, Rrs Orlando-West Palm Bch R1s (088462 / Pine Castle) (Lat: 28.417417 Lon: -81.242639), Type: Tower, Structure height: 77.7 m, Overall height: 79.6 m, Call Sign: WQIK314, Assigned Frequencies: 10995.0 MHz, Grant Date: 03/03/2008, Expiration Date: 03/03/2018, Cancellation Date: 09/03/2009, Certifier: William Chastain, Registrant: Radio Dynamics Corporation, 774 Mays Blvd., #10-465, Silver Spring, MD 20914, Phone: (301) 493-5171, Fax: (301) 576-4553, Email:
OR03XC023, Rrs Orlando-West Palm Bch R1s (088462 / Pine Castle) (Lat: 28.417417 Lon: -81.242639), Type: Ltower, Structure height: 77.7 m, Overall height: 79.6 m, Call Sign: WRJG420, Assigned Frequencies: 10975.0 MHz, 11015.0 MHz, 10975.0 MHz, 11015.0 MHz, 10975.0 MHz, 11015.0 MHz, 10975.0 MHz, 11015.0 MHz, 10975.0 MHz, 11015.0 MHz... (+10 more), Grant Date: 08/25/2020, Expiration Date: 08/25/2030, Cancellation Date: 05/12/2023, Certifier: Jenny Knopf, Registrant: T-Mobile Usa, Inc., 12920 Se 38th Street, Bellevue, WA 98006, Phone: (425) 383-8401, Email:
Lat: 28.501667 Lon: -81.420889, Overall height: 32 m, Call Sign: WLT868, Assigned Frequencies: 2171.60 MHz, Grant Date: 03/06/2001, Expiration Date: 02/01/2011, Cancellation Date: 04/18/2005, Certifier: Carol L Tacker, Registrant: Cingular Wireless LLC, 5565 Glenridge Connector, Suite 1700, Atlanta, GA 30342, Phone: (404) 236-5543, Fax: (404) 236-5575
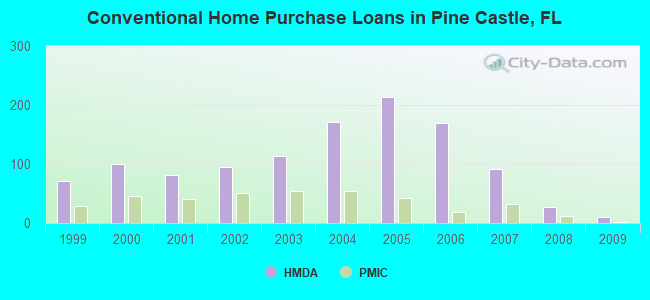
Home Mortgage Disclosure Act Aggregated Statistics For Year 2009(Based on 4 partial tracts) A) FHA, FSA/RHS & VA B) Conventional C) Refinancings D) Home Improvement Loans F) Non-occupant Loans on G) Loans On Manufactured Number Average Value Number Average Value Number Average Value Number Average Value Number Average Value Number Average Value
LOANS ORIGINATED 22 $126,783 11 $188,700 37 $153,279 2 $44,895 3 $131,293 0 $0 APPLICATIONS APPROVED, NOT ACCEPTED 2 $121,415 1 $362,590 4 $168,462 0 $0 0 $0 0 $0 APPLICATIONS DENIED 8 $118,132 4 $126,458 33 $152,538 4 $32,665 4 $108,495 1 $32,950 APPLICATIONS WITHDRAWN 4 $130,398 3 $118,617 11 $200,195 1 $120,040 1 $186,730 0 $0 FILES CLOSED FOR INCOMPLETENESS 2 $127,155 0 $0 6 $163,643 0 $0 1 $114,550 0 $0
Aggregated Statistics For Year 2008(Based on 4 partial tracts) A) FHA, FSA/RHS & VA B) Conventional C) Refinancings D) Home Improvement Loans F) Non-occupant Loans on G) Loans On Manufactured Number Average Value Number Average Value Number Average Value Number Average Value Number Average Value Number Average Value
LOANS ORIGINATED 16 $178,371 27 $228,322 54 $162,951 4 $90,272 10 $164,194 0 $0 APPLICATIONS APPROVED, NOT ACCEPTED 2 $171,670 5 $221,318 17 $171,512 1 $59,120 3 $130,273 0 $0 APPLICATIONS DENIED 10 $167,518 16 $206,709 82 $174,429 16 $81,231 13 $136,372 2 $55,710 APPLICATIONS WITHDRAWN 5 $163,540 6 $156,215 21 $161,198 1 $144,830 3 $116,367 0 $0 FILES CLOSED FOR INCOMPLETENESS 3 $162,487 3 $190,977 10 $172,252 1 $209,540 3 $210,217 0 $0
Aggregated Statistics For Year 2007(Based on 4 partial tracts) A) FHA, FSA/RHS & VA B) Conventional C) Refinancings D) Home Improvement Loans E) Loans on Dwellings For 5+ Families F) Non-occupant Loans on G) Loans On Manufactured Number Average Value Number Average Value Number Average Value Number Average Value Number Average Value Number Average Value Number Average Value
LOANS ORIGINATED 4 $179,522 91 $175,260 156 $159,161 19 $88,731 3 $3,495,350 37 $133,095 0 $0 APPLICATIONS APPROVED, NOT ACCEPTED 0 $0 19 $202,428 26 $170,440 4 $60,950 0 $0 5 $120,046 0 $0 APPLICATIONS DENIED 1 $126,170 44 $163,054 133 $166,786 23 $76,780 0 $0 23 $122,842 1 $65,360 APPLICATIONS WITHDRAWN 2 $144,610 16 $169,511 56 $174,168 1 $83,820 0 $0 9 $139,280 1 $107,870 FILES CLOSED FOR INCOMPLETENESS 1 $43,920 6 $215,713 20 $173,502 0 $0 0 $0 3 $144,330 0 $0
Aggregated Statistics For Year 2006(Based on 4 partial tracts) A) FHA, FSA/RHS & VA B) Conventional C) Refinancings D) Home Improvement Loans E) Loans on Dwellings For 5+ Families F) Non-occupant Loans on G) Loans On Manufactured Number Average Value Number Average Value Number Average Value Number Average Value Number Average Value Number Average Value Number Average Value
LOANS ORIGINATED 3 $171,513 169 $145,508 223 $159,745 24 $97,813 2 $3,031,805 57 $136,950 2 $55,040 APPLICATIONS APPROVED, NOT ACCEPTED 0 $0 36 $144,337 46 $163,064 5 $86,334 0 $0 14 $111,981 1 $60,250 APPLICATIONS DENIED 2 $118,530 98 $118,827 128 $155,957 32 $78,270 0 $0 39 $111,437 6 $38,937 APPLICATIONS WITHDRAWN 0 $0 38 $131,385 115 $149,027 9 $113,878 0 $0 13 $136,908 0 $0 FILES CLOSED FOR INCOMPLETENESS 0 $0 14 $119,846 22 $152,725 1 $88,110 0 $0 5 $143,714 1 $17,570
Aggregated Statistics For Year 2005(Based on 4 partial tracts) A) FHA, FSA/RHS & VA B) Conventional C) Refinancings D) Home Improvement Loans E) Loans on Dwellings For 5+ Families F) Non-occupant Loans on G) Loans On Manufactured Number Average Value Number Average Value Number Average Value Number Average Value Number Average Value Number Average Value Number Average Value
LOANS ORIGINATED 3 $131,947 214 $123,867 198 $141,211 20 $88,225 0 $0 61 $99,912 1 $123,810 APPLICATIONS APPROVED, NOT ACCEPTED 0 $0 37 $114,956 31 $130,015 4 $69,022 0 $0 15 $95,235 1 $50,620 APPLICATIONS DENIED 2 $116,425 87 $112,946 129 $130,593 25 $60,900 1 $604,840 29 $115,441 2 $40,835 APPLICATIONS WITHDRAWN 1 $94,910 54 $132,490 117 $138,392 13 $117,835 0 $0 18 $106,725 0 $0 FILES CLOSED FOR INCOMPLETENESS 0 $0 13 $102,321 33 $128,139 1 $67,490 0 $0 8 $88,115 0 $0
Aggregated Statistics For Year 2004(Based on 4 partial tracts) A) FHA, FSA/RHS & VA B) Conventional C) Refinancings D) Home Improvement Loans E) Loans on Dwellings For 5+ Families F) Non-occupant Loans on G) Loans On Manufactured Number Average Value Number Average Value Number Average Value Number Average Value Number Average Value Number Average Value Number Average Value
LOANS ORIGINATED 13 $117,107 172 $108,012 162 $115,152 17 $48,418 2 $4,042,875 61 $90,779 3 $29,473 APPLICATIONS APPROVED, NOT ACCEPTED 2 $133,680 28 $97,563 40 $118,138 2 $63,875 1 $271,350 6 $78,727 0 $0 APPLICATIONS DENIED 3 $126,570 73 $89,874 129 $113,234 15 $54,302 0 $0 30 $67,083 5 $64,408 APPLICATIONS WITHDRAWN 2 $92,985 31 $112,868 113 $111,534 7 $69,133 0 $0 10 $80,813 1 $64,930 FILES CLOSED FOR INCOMPLETENESS 1 $94,890 8 $101,370 19 $120,494 1 $20,080 0 $0 3 $87,377 0 $0
Aggregated Statistics For Year 2003(Based on 4 partial tracts) A) FHA, FSA/RHS & VA B) Conventional C) Refinancings D) Home Improvement Loans E) Loans on Dwellings For 5+ Families F) Non-occupant Loans on Number Average Value Number Average Value Number Average Value Number Average Value Number Average Value Number Average Value
LOANS ORIGINATED 22 $110,027 114 $105,218 259 $108,488 12 $28,803 1 $351,360 52 $74,851 APPLICATIONS APPROVED, NOT ACCEPTED 0 $0 15 $95,133 48 $99,692 4 $58,422 0 $0 7 $91,086 APPLICATIONS DENIED 5 $85,698 40 $88,803 136 $103,666 12 $24,567 0 $0 21 $76,050 APPLICATIONS WITHDRAWN 3 $88,507 15 $103,469 77 $104,812 2 $39,820 0 $0 4 $90,050 FILES CLOSED FOR INCOMPLETENESS 1 $118,190 7 $88,911 20 $100,854 0 $0 0 $0 3 $91,050
Aggregated Statistics For Year 2002(Based on 4 partial tracts) A) FHA, FSA/RHS & VA B) Conventional C) Refinancings D) Home Improvement Loans E) Loans on Dwellings For 5+ Families F) Non-occupant Loans on Number Average Value Number Average Value Number Average Value Number Average Value Number Average Value Number Average Value
LOANS ORIGINATED 30 $106,102 95 $107,201 179 $109,254 12 $25,442 1 $999,170 32 $78,781 APPLICATIONS APPROVED, NOT ACCEPTED 2 $115,130 13 $98,675 35 $95,975 5 $31,392 1 $109,800 6 $89,827 APPLICATIONS DENIED 6 $107,577 24 $93,937 95 $90,639 15 $25,019 1 $549,000 10 $114,834 APPLICATIONS WITHDRAWN 4 $96,548 22 $117,998 64 $100,621 2 $44,955 1 $192,150 7 $84,663 FILES CLOSED FOR INCOMPLETENESS 2 $78,090 3 $94,223 11 $91,803 0 $0 0 $0 0 $0
Aggregated Statistics For Year 2001(Based on 4 partial tracts) A) FHA, FSA/RHS & VA B) Conventional C) Refinancings D) Home Improvement Loans E) Loans on Dwellings For 5+ Families F) Non-occupant Loans on Number Average Value Number Average Value Number Average Value Number Average Value Number Average Value Number Average Value
LOANS ORIGINATED 35 $94,423 81 $106,285 123 $97,077 9 $28,063 1 $1,990,110 23 $67,603 APPLICATIONS APPROVED, NOT ACCEPTED 1 $78,690 11 $83,131 24 $90,675 6 $30,327 0 $0 3 $86,410 APPLICATIONS DENIED 5 $91,668 33 $70,303 107 $71,434 16 $18,468 0 $0 12 $55,499 APPLICATIONS WITHDRAWN 3 $124,860 22 $112,942 51 $82,526 3 $49,530 0 $0 4 $89,725 FILES CLOSED FOR INCOMPLETENESS 0 $0 4 $117,828 9 $95,622 1 $25,800 0 $0 0 $0
Aggregated Statistics For Year 2000(Based on 4 partial tracts) A) FHA, FSA/RHS & VA B) Conventional C) Refinancings D) Home Improvement Loans F) Non-occupant Loans on Number Average Value Number Average Value Number Average Value Number Average Value Number Average Value
LOANS ORIGINATED 49 $85,366 100 $89,369 37 $71,683 15 $21,827 28 $63,071 APPLICATIONS APPROVED, NOT ACCEPTED 0 $0 24 $67,254 10 $83,729 6 $33,812 8 $64,624 APPLICATIONS DENIED 2 $75,625 58 $67,480 65 $62,740 25 $17,759 18 $58,028 APPLICATIONS WITHDRAWN 4 $101,388 26 $81,755 43 $56,199 2 $19,510 9 $63,367 FILES CLOSED FOR INCOMPLETENESS 1 $65,430 9 $90,543 6 $75,673 0 $0 2 $85,140
Aggregated Statistics For Year 1999(Based on 4 partial tracts) A) FHA, FSA/RHS & VA B) Conventional C) Refinancings D) Home Improvement Loans E) Loans on Dwellings For 5+ Families F) Non-occupant Loans on Number Average Value Number Average Value Number Average Value Number Average Value Number Average Value Number Average Value
LOANS ORIGINATED 55 $83,413 72 $90,427 73 $69,633 10 $18,766 0 $0 13 $54,410 APPLICATIONS APPROVED, NOT ACCEPTED 2 $98,355 14 $75,901 17 $200,129 5 $31,882 1 $98,860 2 $81,550 APPLICATIONS DENIED 7 $79,134 33 $59,551 75 $62,435 20 $18,603 0 $0 8 $55,149 APPLICATIONS WITHDRAWN 3 $95,297 8 $69,159 45 $55,196 2 $26,510 0 $0 3 $65,897 FILES CLOSED FOR INCOMPLETENESS 2 $61,695 5 $130,044 10 $68,647 1 $13,300 0 $0 0 $0
Detailed HMDA statistics for the following Tracts:
0141.00
, 0142.00 , 0143.01 , 0143.02
Private Mortgage Insurance Companies Aggregated Statistics For Year 2009(Based on 3 partial tracts) A) Conventional Number Average Value
LOANS ORIGINATED 2 $199,895 APPLICATIONS APPROVED, NOT ACCEPTED 0 $0 APPLICATIONS DENIED 1 $177,160 APPLICATIONS WITHDRAWN 0 $0 FILES CLOSED FOR INCOMPLETENESS 0 $0
Aggregated Statistics For Year 2008(Based on 4 partial tracts) A) Conventional B) Refinancings C) Non-occupant Loans on Number Average Value Number Average Value Number Average Value
LOANS ORIGINATED 12 $192,869 4 $207,298 1 $197,160 APPLICATIONS APPROVED, NOT ACCEPTED 8 $192,022 5 $178,308 1 $192,360 APPLICATIONS DENIED 1 $278,460 1 $165,320 0 $0 APPLICATIONS WITHDRAWN 1 $366,020 1 $251,910 0 $0 FILES CLOSED FOR INCOMPLETENESS 1 $229,740 0 $0 0 $0
Aggregated Statistics For Year 2007(Based on 4 partial tracts) A) Conventional B) Refinancings C) Non-occupant Loans on Number Average Value Number Average Value Number Average Value
LOANS ORIGINATED 32 $200,889 10 $203,814 5 $168,430 APPLICATIONS APPROVED, NOT ACCEPTED 6 $199,160 4 $196,988 2 $193,985 APPLICATIONS DENIED 1 $97,720 1 $66,820 0 $0 APPLICATIONS WITHDRAWN 3 $245,940 0 $0 1 $93,960 FILES CLOSED FOR INCOMPLETENESS 0 $0 0 $0 0 $0
Aggregated Statistics For Year 2006(Based on 4 partial tracts) A) Conventional B) Refinancings C) Non-occupant Loans on Number Average Value Number Average Value Number Average Value
LOANS ORIGINATED 18 $154,153 7 $186,651 5 $114,544 APPLICATIONS APPROVED, NOT ACCEPTED 4 $134,788 3 $160,430 1 $47,830 APPLICATIONS DENIED 0 $0 0 $0 0 $0 APPLICATIONS WITHDRAWN 5 $142,432 2 $113,165 1 $98,920 FILES CLOSED FOR INCOMPLETENESS 1 $143,350 0 $0 0 $0
Aggregated Statistics For Year 2005(Based on 4 partial tracts) A) Conventional B) Refinancings C) Non-occupant Loans on Number Average Value Number Average Value Number Average Value
LOANS ORIGINATED 42 $114,353 10 $141,703 15 $86,056 APPLICATIONS APPROVED, NOT ACCEPTED 9 $115,777 2 $131,840 3 $71,967 APPLICATIONS DENIED 1 $143,170 0 $0 0 $0 APPLICATIONS WITHDRAWN 2 $183,365 0 $0 0 $0 FILES CLOSED FOR INCOMPLETENESS 1 $24,160 0 $0 1 $24,160
Aggregated Statistics For Year 2004(Based on 4 partial tracts) A) Conventional B) Refinancings C) Non-occupant Loans on Number Average Value Number Average Value Number Average Value
LOANS ORIGINATED 54 $109,205 11 $132,115 18 $81,563 APPLICATIONS APPROVED, NOT ACCEPTED 11 $79,158 5 $121,034 3 $86,830 APPLICATIONS DENIED 1 $129,070 0 $0 0 $0 APPLICATIONS WITHDRAWN 1 $157,230 2 $117,310 0 $0 FILES CLOSED FOR INCOMPLETENESS 1 $104,370 0 $0 0 $0
Aggregated Statistics For Year 2003(Based on 4 partial tracts) A) Conventional B) Refinancings C) Non-occupant Loans on Number Average Value Number Average Value Number Average Value
LOANS ORIGINATED 54 $91,974 25 $112,826 16 $55,980 APPLICATIONS APPROVED, NOT ACCEPTED 10 $161,560 8 $107,789 4 $85,832 APPLICATIONS DENIED 1 $205,430 1 $117,470 1 $201,820 APPLICATIONS WITHDRAWN 5 $127,430 2 $176,315 1 $152,440 FILES CLOSED FOR INCOMPLETENESS 0 $0 0 $0 0 $0
Aggregated Statistics For Year 2002(Based on 4 partial tracts) A) Conventional B) Refinancings C) Non-occupant Loans on Number Average Value Number Average Value Number Average Value
LOANS ORIGINATED 51 $124,801 17 $122,814 9 $110,520 APPLICATIONS APPROVED, NOT ACCEPTED 6 $177,298 5 $99,354 1 $47,350 APPLICATIONS DENIED 3 $84,893 1 $91,790 2 $49,345 APPLICATIONS WITHDRAWN 4 $143,485 2 $152,300 0 $0 FILES CLOSED FOR INCOMPLETENESS 0 $0 0 $0 0 $0
Aggregated Statistics For Year 2001(Based on 4 partial tracts) A) Conventional B) Refinancings C) Non-occupant Loans on Number Average Value Number Average Value Number Average Value
LOANS ORIGINATED 41 $128,741 15 $106,109 5 $91,048 APPLICATIONS APPROVED, NOT ACCEPTED 5 $154,160 3 $103,247 1 $50,940 APPLICATIONS DENIED 0 $0 2 $124,580 0 $0 APPLICATIONS WITHDRAWN 2 $112,730 2 $98,885 0 $0 FILES CLOSED FOR INCOMPLETENESS 0 $0 0 $0 0 $0
Aggregated Statistics For Year 2000(Based on 4 partial tracts) A) Conventional B) Refinancings C) Non-occupant Loans on Number Average Value Number Average Value Number Average Value
LOANS ORIGINATED 45 $93,909 3 $99,577 15 $62,919 APPLICATIONS APPROVED, NOT ACCEPTED 2 $119,470 1 $87,130 1 $36,290 APPLICATIONS DENIED 2 $128,045 0 $0 1 $45,570 APPLICATIONS WITHDRAWN 1 $82,520 0 $0 0 $0 FILES CLOSED FOR INCOMPLETENESS 1 $50,510 0 $0 1 $14,270
Aggregated Statistics For Year 1999(Based on 4 partial tracts) A) Conventional B) Refinancings C) Non-occupant Loans on Number Average Value Number Average Value Number Average Value
LOANS ORIGINATED 29 $99,706 10 $89,891 3 $53,287 APPLICATIONS APPROVED, NOT ACCEPTED 2 $57,505 1 $134,520 0 $0 APPLICATIONS DENIED 1 $183,180 1 $71,570 0 $0 APPLICATIONS WITHDRAWN 0 $0 0 $0 0 $0 FILES CLOSED FOR INCOMPLETENESS 0 $0 0 $0 0 $0
Detailed PMIC statistics for the following Tracts:
0141.00
, 0142.00 , 0143.01 , 0143.02 Pine Castle compared to Florida state average:
Median household income below state average. Unemployed percentage below state average. Hispanic race population percentage above state average. Median age significantly below state average. Foreign-born population percentage above state average. Renting percentage above state average. Length of stay since moving in significantly above state average. Pine Castle on our top lists :
#52 on the list of "Top 101 cities with largest percentage of females in industries: accommodation and food services (population 5,000+)"
#53 on the list of "Top 101 cities with the most residents born in Haiti (population 500+)"
#66 on the list of "Top 101 cities with the most residents born in Bosnia and Herzegovina (population 500+)"
#79 on the list of "Top 101 cities with the most residents born in Guyana (population 500+)"
#81 on the list of "Top 101 cities with the most residents born in Thailand (population 500+)"
#84 on the list of "Top 101 cities with the most residents born in Cuba (population 500+)"
#9 on the list of "Top 101 counties with the highest ground withdrawal of fresh water for public supply"
#19 on the list of "Top 101 counties with the most Evangelical Protestant adherents"
#20 on the list of "Top 101 counties with the most Evangelical Protestant congregations"
#21 on the list of "Top 101 counties with the largest decrease in the number of deaths per 1000 residents 2000-2006 to 2007-2013 (pop. 50,000+)"
#30 on the list of "Top 101 counties with the highest total withdrawal of fresh water for public supply (pop. 50,000+)"


 Recent articles from our blog. Our writers, many of them Ph.D. graduates or candidates, create easy-to-read articles on a wide variety of topics.

 (4.5 miles